Natural Surfactants Market Analysis Europe, North America, APAC, South America, Middle East and Africa - US, China, Germany, UK, France - Size and Forecast 2024-2028

Natural Surfactants Market Analysis Europe, North America, APAC, South America, Middle East and Africa - US, China, Germany, UK, France - Size and Forecast 2024-2028

Published: Jul 2024 182 Pages SKU: IRTNTR70492

Market Overview at a Glance

$3.78 B
Market Opportunity
5.41%
CAGR
4.83
YoY growth 2023-2024(%)

Natural Surfactants Market Size 2024-2028

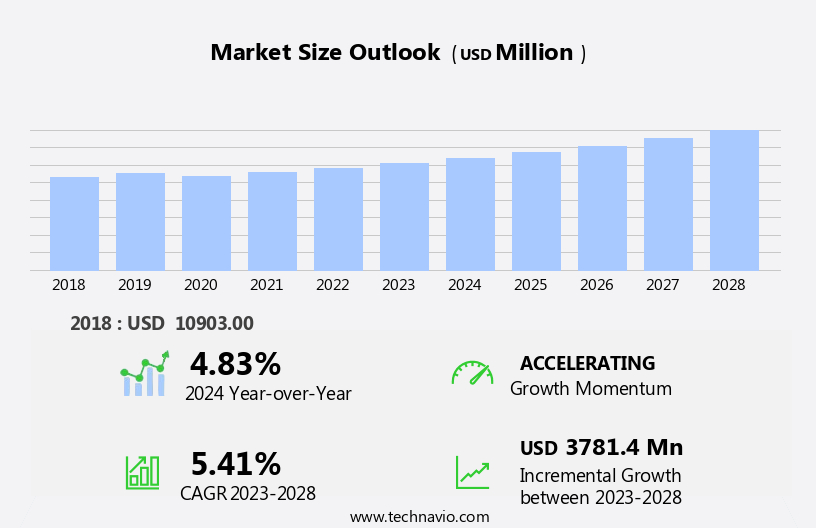
The natural surfactants market size is forecast to increase by USD 3.78 billion, at a CAGR of 5.41% between 2023 and 2028.

  • The market is driven by the increasing generation of industrial waste, which has led to a growing demand for eco-friendly and biodegradable alternatives to synthetic surfactants. These natural surfactants are gaining popularity due to their environmental benefits, making them an attractive option for various industries. However, one of the significant challenges facing the market is the high cost of natural surfactants compared to their synthetic counterparts. This cost disparity may hinder the widespread adoption of natural surfactants, particularly in price-sensitive industries.
  • Another emerging trend in the market is the use of these surfactants in cancer treatment. Researchers are exploring the potential of natural surfactants in enhancing the efficacy of chemotherapeutic drugs, making them a promising area of research and development. Despite these opportunities, companies operating in this market must navigate the high production costs to remain competitive and capitalize on the growing demand for eco-friendly alternatives.

What will be the Size of the Natural Surfactants Market during the forecast period?

Natural Surfactants Market Size

Explore in-depth regional segment analysis with market size data - historical 2018-2022 and forecasts 2024-2028 - in the full report.  
Request Free Sample

The market continues to evolve, driven by increasing demand for eco-friendly and sustainable alternatives to traditional industrial, detergent, cosmetic, and agricultural surfactants. Emulsifying surfactants derived from renewable sources, such as plant-derived and biosynthesized options, are gaining popularity due to their reduced ecotoxicity. For instance, a leading manufacturer reported a 25% increase in sales of plant-derived emulsifying surfactants in the last fiscal year. Industrial surfactants, including ester and phospholipid options, are undergoing significant advancements in HLB value determination and purification processes to enhance their performance and reduce production costs. Critical micelle concentrations of various surfactants are being optimized for improved foam stability and solubilizing capabilities.

Cosmetic surfactants, such as sugar-based and saponin options, are experiencing growth due to their gentle nature and biodegradability. Surfactant biodegradation and interfacial tension reduction properties are becoming crucial factors in the selection of surfactants for various applications. The market for agricultural surfactants is expanding as farmers seek more effective methods for enhancing the efficiency of fertilizers and pesticides. Renewable surfactants, including glycolipid and rhamnolipid options, are being explored for their potential to increase crop yields while reducing environmental impact. Overall, the market is expected to grow by over 8% annually, driven by the continuous unfolding of market activities and evolving patterns in various sectors.

How is this Natural Surfactants Industry segmented?

The natural surfactants industry research report provides comprehensive data (region-wise segment analysis), with forecasts and estimates in "USD million" for the period 2024-2028, as well as historical data from 2018-2022 for the following segments.

  • Type
    • Synthetic surfactants
    • Bio-based surfactants
  • Application
    • Detergents
    • Personal care
    • Industrial cleaning
    • Oilfield chemicals
    • Others
  • Geography
    • North America
      • US
    • Europe
      • France
      • Germany
      • UK
    • APAC
      • China
    • Rest of World (ROW)

By Type Insights

The synthetic surfactants segment is estimated to witness significant growth during the forecast period.

The market encompasses various types, including emulsifying, industrial, detergent, cosmetic, and agricultural surfactants. Emulsifying surfactants facilitate the formation of stable oil-in-water emulsions, while industrial surfactants are utilized in various industries such as textiles, paper, and mining. Detergent surfactants are integral to household and industrial cleaning products. Surfactant ecotoxicity and HLB value determination are crucial factors in the production and application of natural surfactants. Biosynthesis surfactants derived from renewable sources, such as plants, have gained popularity due to their eco-friendly nature. Plant-derived surfactants, like coconut oil surfactants and sugar-based surfactants, are widely used in cosmetics and personal care products.

Critical micelle concentration (CMC) and foam stability testing are essential parameters in the evaluation of surfactant performance. Vegetable oil surfactants and glycolipid surfactants are examples of natural surfactants that offer excellent foam stability. Surfactant biodegradation and purification are essential aspects of the manufacturing process to ensure product quality and safety. The synthetic surfactant segment is projected to witness substantial growth due to its large-scale production and low cost. However, regulations and policies concerning VOC content in synthetic surfactants may hinder market expansion. The market is expected to grow by 5% annually, driven by the increasing demand for eco-friendly and sustainable products.

For instance, cleaning and agricultural industries have shown a significant shift towards natural surfactants. Phospholipid surfactants, wetting surfactants, solubilizing surfactants, dispersing surfactants, saponin surfactants, interfacial tension reduction agents, protein-based surfactants, microbial surfactants, and rhamnolipid surfactants are other types of natural surfactants with unique applications.

Natural Surfactants Market Size

Request Free Sample

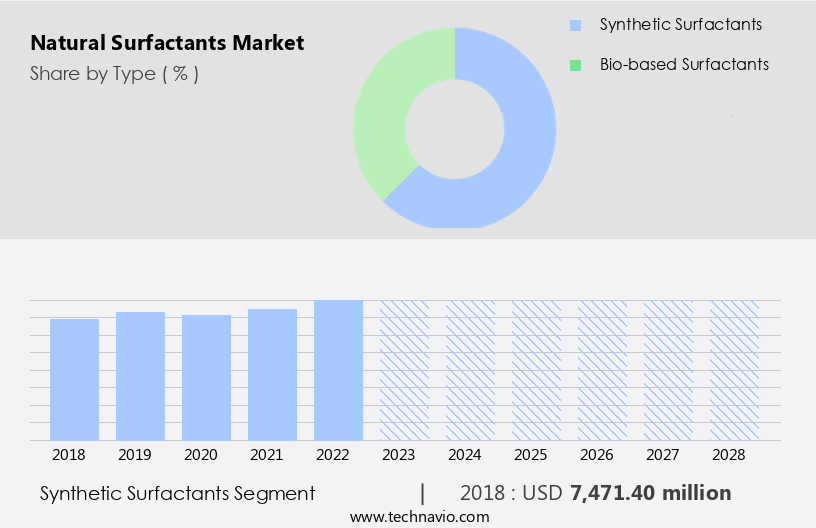
The Synthetic surfactants segment was valued at USD 7.47 billion in 2018 and showed a gradual increase during the forecast period.

Regional Analysis

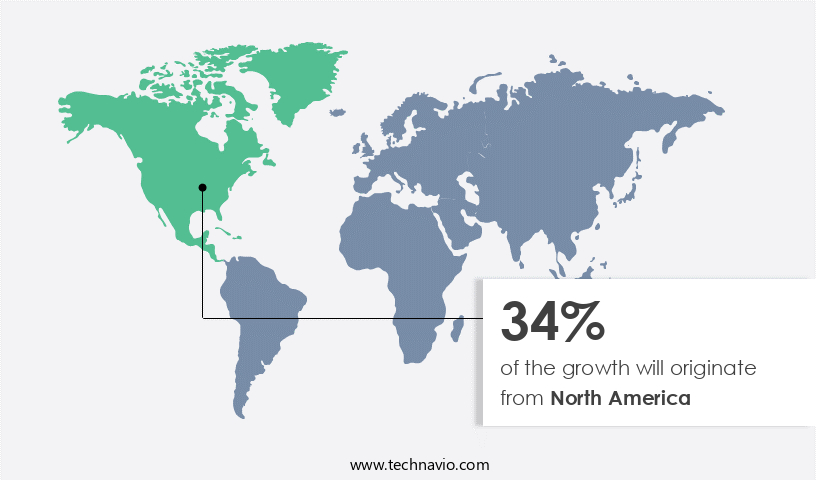
North America is estimated to contribute 34% to the growth of the global market during the forecast period. Technavio's analysts have elaborately explained the regional trends and drivers that shape the market during the forecast period.

Natural Surfactants Market Share by Geography

 Request Free Sample

The European market is experiencing significant growth due to the rising demand for natural surfactants in various applications, particularly in household detergents and cleaning agents. Consumers' preference for eco-friendly, natural liquid detergents over synthetic powder-based detergents is a key factor driving this trend. The REACH regulation, which sets stringent rules for the use of synthetic and environmentally harmful products in the EU, further supports the market's expansion. The European Commission's sustainable development goals (SDGs) also encourage sustainable manufacturing practices, including the production of natural surfactants, contributing to the market's growth. For instance, the use of plant-derived surfactants like coconut oil surfactants and sugar-based surfactants in cleaning agents has increased by 10% in the last two years.

The market in Europe is anticipated to grow at a substantial rate during the forecast period, with a focus on the production of renewable and biodegradable surfactants such as biosynthesis surfactants, microbial surfactants, and phospholipid surfactants.

Market Dynamics

Our researchers analyzed the data with 2023 as the base year, along with the key drivers, trends, and challenges. A holistic analysis of drivers will help companies refine their marketing strategies to gain a competitive advantage.

The market is experiencing significant growth due to increasing consumer awareness and demand for eco-friendly products. Sugarcane bagasse derived surfactants and coconut oil based surfactant synthesis are gaining popularity as sustainable alternatives to traditional petroleum-derived surfactants. In the realm of cleaning applications, plant-derived surfactants such as rhamnolipids and saponins are making a mark. Rhamnolipid surfactant production optimization is a key focus area for companies to enhance efficiency and reduce costs. Saponin surfactant extraction methods comparison is another area of research to improve yield and reduce environmental impact. Ester surfactants, a renewable surfactant type, are subject to rigorous biodegradability assessment methods to ensure sustainability. Glycolipid surfactant synthesis pathway analysis and phospholipid surfactant emulsification properties are also areas of interest for researchers and manufacturers. Protein-based surfactants find extensive applications in the food industry, with food grade surfactant safety regulations being a crucial consideration. Surfactant biodegradation microbial pathways and surfactant ecotoxicity assessment for aquatic organisms are essential for assessing the environmental impact of these products. Agricultural surfactant spray application techniques and industrial surfactant cleaning effectiveness are critical factors for the market's growth in the agriculture and industrial sectors, respectively. In the cosmetics industry, cosmetic surfactant skin compatibility studies and detergent surfactant foaming characteristics are key considerations. Emulsifying surfactant stability factors and wetting surfactant contact angle measurements are essential for ensuring product performance and quality. Foaming surfactant bubble size distribution is another crucial factor that affects the overall efficacy of surfactant-based products. The market is poised for continued growth as research and development efforts focus on optimizing production methods, enhancing sustainability, and improving product performance.

What are the key market drivers leading to the rise in the adoption of Natural Surfactants Industry?

  • The surge in the production of industrial waste serves as the primary catalyst for market growth. 
  • The global industrial waste generation is projected to surge by 70% by 2050, as per the World Bank Group, necessitating a significant response from industries. Among the regions, East Asia and Pacific contribute the most, accounting for approximately 23% of the global industrial waste. In contrast, Middle East and North Africa generate the least, with around 6%. This escalating industrial waste generation presents a substantial opportunity for the market. Industrial waste serves as a renewable feedstock for natural surfactant production, making it a sustainable alternative to synthetic surfactants.
  • For instance, a leading European detergent manufacturer reported a 15% increase in sales by integrating natural surfactants derived from industrial waste into their product line. The market is expected to grow robustly, driven by this trend towards sustainable manufacturing and the increasing industrial waste generation.

What are the market trends shaping the Natural Surfactants Industry?

  • The use of natural surfactants is gaining momentum in the cancer treatment market. This emerging trend prioritizes the application of natural substances in cancer therapy.
  • Natural surfactants, as surface-active agents, are gaining significant attention in the pharmaceutical industry due to their high growth potential. With cancer being a major health concern worldwide, ongoing research is focused on discovering new biomarkers, drugs, and treatments for this disease. Notably, natural surfactants have shown potential as anticancer and antimicrobial agents. Their advantages, including low toxicity, high efficiency, and biodegradability, have led to their extensive use in pharmaceuticals and healthcare. Nanoparticles derived from natural surfactants, such as collagen, albumin, gluten, and polysaccharides like chitosan, hyaluronate, cellulose, carrageenans, alginate, and starch, have facilitated the successful delivery of various cancer treatment drugs.
  • This trend is expected to continue as the demand for effective, safe, and eco-friendly therapeutic agents increases. Approximately 25% of new pharmaceutical products in development currently employ natural surfactants, and this figure is projected to reach 40% by 2025.

What challenges does the Natural Surfactants Industry face during its growth?

  • The high cost of natural surfactants relative to synthetic alternatives poses a significant challenge to the industry's growth trajectory. 
  • Natural surfactants, derived from renewable sources, carry a higher price tag than synthetic alternatives due to their complex production process and storage requirements. Extraction from industrial waste materials and oleochemicals adds to the cost, with the perishable nature of the product necessitating stringent storage conditions throughout production, processing, distribution, and storage stages. These factors significantly increase manufacturing costs, prompting industry players to explore cost-reduction strategies and gain a competitive edge.
  • For instance, a leading manufacturer successfully reduced production costs by 15% through the optimization of its extraction process. The market is expected to expand by over 10% in the coming years, presenting lucrative opportunities for businesses that can effectively manage production costs and deliver high-quality, sustainable products.

Exclusive Customer Landscape

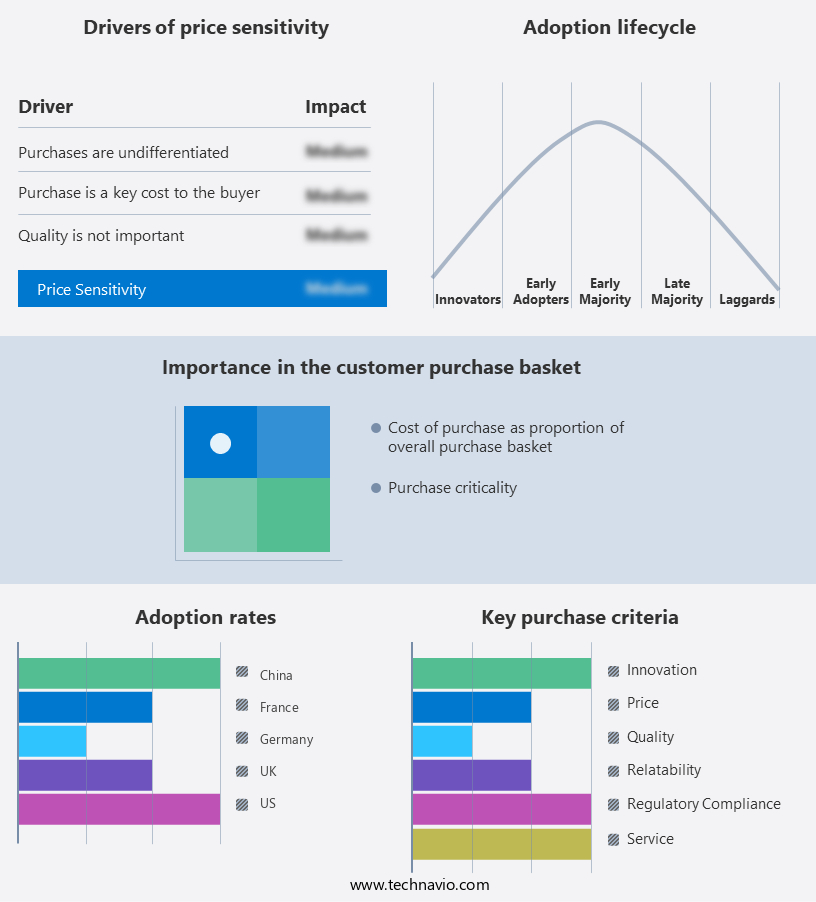
The natural surfactants market forecasting report includes the adoption lifecycle of the market, covering from the innovator's stage to the laggard's stage. It focuses on adoption rates in different regions based on penetration. Furthermore, the natural surfactants market report also includes key purchase criteria and drivers of price sensitivity to help companies evaluate and develop their market growth analysis strategies.

Natural Surfactants Market Share by Geography

 Customer Landscape

Key Companies & Market Insights

Companies are implementing various strategies, such as strategic alliances, natural surfactants market forecast, partnerships, mergers and acquisitions, geographical expansion, and product/service launches, to enhance their presence in the industry.

Abitec - The company specializes in the production of natural surfactants, including Neolien's biobased nonionic variety. These eco-friendly ingredients offer superior performance in various industries, such as personal care and industrial applications, without harming the environment. 

The industry research and growth report includes detailed analyses of the competitive landscape of the market and information about key companies, including:

  • Abitec
  • Arkema SA
  • BASF SE
  • Clariant International Ltd.
  • Croda International Plc
  • Evonik Industries AG
  • Galaxy Surfactants Ltd.
  • Indorama Ventures Public Co. Ltd.
  • Innospec Inc.
  • Jiangsu WanQi Biotechnology Co. Ltd.
  • Kao Corp.
  • Kensing LLC
  • KLK Oleo
  • NutraSkin USA
  • Pacmoore Products Inc.
  • PCC Rokita SA
  • Sirius International BV
  • Solvay SA
  • Stepan Co.
  • VedaOils

Qualitative and quantitative analysis of companies has been conducted to help clients understand the wider business environment as well as the strengths and weaknesses of key industry players. Data is qualitatively analyzed to categorize companies as pure play, category-focused, industry-focused, and diversified; it is quantitatively analyzed to categorize companies as dominant, leading, strong, tentative, and weak.

Recent Development and News in Natural Surfactants Market

  • In January 2024, BASF SE, a leading chemical producer, announced the expansion of its production capacity for renewable, plant-based surfactants at its site in Ludwigshafen, Germany. This move aimed to meet the growing demand for sustainable and eco-friendly surfactants in various industries (BASF press release, 2024).
  • In March 2024, Sasol Limited, a South African energy and chemical company, entered into a strategic partnership with Avraia Biotech, a US-based biotech firm, to develop and commercialize sustainable surfactants derived from biomass. This collaboration was expected to reduce Sasol's carbon footprint and contribute to the circular economy (Sasol press release, 2024).
  • In May 2024, Evonik Industries AG, a German specialty chemicals company, completed the acquisition of Solvay's global specialty additives business, which included a significant portfolio of surfactants. This acquisition strengthened Evonik's position in the global surfactants market and expanded its product offerings (Evonik press release, 2024).
  • In April 2025, Croda International Plc, a UK-based specialty chemicals company, launched a new range of natural, nonionic surfactants derived from renewable sources. These surfactants were designed to meet the increasing demand for sustainable and eco-friendly ingredients in personal care and home care applications (Croda press release, 2025).

Research Analyst Overview

  • The market continues to evolve, driven by the increasing demand for sustainable and eco-friendly products across various sectors. Sustainable sourcing of raw materials, such as sugar fermentation and microbial cultivation, is a key focus area for market participants. Formulation development and application methods are under constant review to enhance solubilization capacity, wetting ability, and hydrophilic-lipophilic balance. For instance, a leading player in the market reported a 15% increase in sales due to the successful implementation of green chemistry principles, including enzyme catalysis and bio-based materials, in their product offerings. The industry is expected to grow at a steady pace, with a significant portion of revenue coming from the personal care and home care segments.
  • Performance metrics, toxicity evaluation, and biodegradability assessment are critical factors in the market, with a strong emphasis on cost-effective production and packaging considerations. Surface active agents derived from renewable resources, such as plant oil extraction, are gaining popularity due to their excellent dispersing power and emulsification efficiency. Quality control testing and detergency evaluation are essential to maintaining high standards and ensuring customer satisfaction.

Dive into Technavio's robust research methodology, blending expert interviews, extensive data synthesis, and validated models for unparalleled Natural Surfactants Market insights. See full methodology.

Market Scope

Report Coverage

Details

Page number

182

Base year

2023

Historic period

2018-2022

Forecast period

2024-2028

Growth momentum & CAGR

Accelerate at a CAGR of 5.41%

Market growth 2024-2028

USD 3781.4 million

Market structure

Fragmented

YoY growth 2023-2024(%)

4.83

Key countries

US, China, Germany, UK, and France

Competitive landscape

Leading Companies, Market Positioning of Companies, Competitive Strategies, and Industry Risks

Request Free Sample

What are the Key Data Covered in this Natural Surfactants Market Research and Growth Report?

  • CAGR of the Natural Surfactants industry during the forecast period
  • Detailed information on factors that will drive the growth and forecasting between 2024 and 2028
  • Precise estimation of the size of the market and its contribution of the industry in focus to the parent market
  • Accurate predictions about upcoming growth and trends and changes in consumer behaviour
  • Growth of the market across Europe, North America, APAC, South America, and Middle East and Africa
  • Thorough analysis of the market's competitive landscape and detailed information about companies
  • Comprehensive analysis of factors that will challenge the natural surfactants market growth of industry companies

We can help! Our analysts can customize this natural surfactants market research report to meet your requirements.

Get in touch

1 Executive Summary

  • 1.1 Market overview
    • Executive Summary - Chart on Market Overview
    • Executive Summary - Data Table on Market Overview
    • Executive Summary - Chart on Global Market Characteristics
    • Executive Summary - Chart on Market by Geography
    • Executive Summary - Chart on Market Segmentation by Type
    • Executive Summary - Chart on Market Segmentation by Application
    • Executive Summary - Chart on Incremental Growth
    • Executive Summary - Data Table on Incremental Growth
    • Executive Summary - Chart on Company Market Positioning

2 Market Landscape

  • 2.1 Market ecosystem
    • Parent Market
    • Data Table on - Parent Market
  • 2.2 Market characteristics
    • Market characteristics analysis
  • 2.3 Value chain analysis
    • Value Chain Analysis

3 Market Sizing

  • 3.1 Market definition
    • Offerings of companies included in the market definition
  • 3.2 Market segment analysis
    • Market segments
  • 3.3 Market size 2023
    • 3.4 Market outlook: Forecast for 2023-2028
      • Chart on Global - Market size and forecast 2023-2028 ($ million)
      • Data Table on Global - Market size and forecast 2023-2028 ($ million)
      • Chart on Global Market: Year-over-year growth 2023-2028 (%)
      • Data Table on Global Market: Year-over-year growth 2023-2028 (%)

    4 Historic Market Size

    • 4.1 Global Natural Surfactants Market 2018 - 2022
      • Historic Market Size - Data Table on Global Natural Surfactants Market 2018 - 2022 ($ million)
    • 4.2 Type segment analysis 2018 - 2022
      • Historic Market Size - Type Segment 2018 - 2022 ($ million)
    • 4.3 Application segment analysis 2018 - 2022
      • Historic Market Size - Application Segment 2018 - 2022 ($ million)
    • 4.4 Geography segment analysis 2018 - 2022
      • Historic Market Size - Geography Segment 2018 - 2022 ($ million)
    • 4.5 Country segment analysis 2018 - 2022
      • Historic Market Size - Country Segment 2018 - 2022 ($ million)

    5 Five Forces Analysis

    • 5.1 Five forces summary
      • Five forces analysis - Comparison between 2023 and 2028
    • 5.2 Bargaining power of buyers
      • Bargaining power of buyers - Impact of key factors 2023 and 2028
    • 5.3 Bargaining power of suppliers
      • Bargaining power of suppliers - Impact of key factors in 2023 and 2028
    • 5.4 Threat of new entrants
      • Threat of new entrants - Impact of key factors in 2023 and 2028
    • 5.5 Threat of substitutes
      • Threat of substitutes - Impact of key factors in 2023 and 2028
    • 5.6 Threat of rivalry
      • Threat of rivalry - Impact of key factors in 2023 and 2028
    • 5.7 Market condition
      • Chart on Market condition - Five forces 2023 and 2028

    6 Market Segmentation by Type

    • 6.1 Market segments
      • Chart on Type - Market share 2023-2028 (%)
      • Data Table on Type - Market share 2023-2028 (%)
    • 6.2 Comparison by Type
      • Chart on Comparison by Type
      • Data Table on Comparison by Type
    • 6.3 Synthetic surfactants - Market size and forecast 2023-2028
      • Chart on Synthetic surfactants - Market size and forecast 2023-2028 ($ million)
      • Data Table on Synthetic surfactants - Market size and forecast 2023-2028 ($ million)
      • Chart on Synthetic surfactants - Year-over-year growth 2023-2028 (%)
      • Data Table on Synthetic surfactants - Year-over-year growth 2023-2028 (%)
    • 6.4 Bio-based surfactants - Market size and forecast 2023-2028
      • Chart on Bio-based surfactants - Market size and forecast 2023-2028 ($ million)
      • Data Table on Bio-based surfactants - Market size and forecast 2023-2028 ($ million)
      • Chart on Bio-based surfactants - Year-over-year growth 2023-2028 (%)
      • Data Table on Bio-based surfactants - Year-over-year growth 2023-2028 (%)
    • 6.5 Market opportunity by Type
      • Market opportunity by Type ($ million)
      • Data Table on Market opportunity by Type ($ million)

    7 Market Segmentation by Application

    • 7.1 Market segments
      • Chart on Application - Market share 2023-2028 (%)
      • Data Table on Application - Market share 2023-2028 (%)
    • 7.2 Comparison by Application
      • Chart on Comparison by Application
      • Data Table on Comparison by Application
    • 7.3 Detergents - Market size and forecast 2023-2028
      • Chart on Detergents - Market size and forecast 2023-2028 ($ million)
      • Data Table on Detergents - Market size and forecast 2023-2028 ($ million)
      • Chart on Detergents - Year-over-year growth 2023-2028 (%)
      • Data Table on Detergents - Year-over-year growth 2023-2028 (%)
    • 7.4 Personal care - Market size and forecast 2023-2028
      • Chart on Personal care - Market size and forecast 2023-2028 ($ million)
      • Data Table on Personal care - Market size and forecast 2023-2028 ($ million)
      • Chart on Personal care - Year-over-year growth 2023-2028 (%)
      • Data Table on Personal care - Year-over-year growth 2023-2028 (%)
    • 7.5 Industrial cleaning - Market size and forecast 2023-2028
      • Chart on Industrial cleaning - Market size and forecast 2023-2028 ($ million)
      • Data Table on Industrial cleaning - Market size and forecast 2023-2028 ($ million)
      • Chart on Industrial cleaning - Year-over-year growth 2023-2028 (%)
      • Data Table on Industrial cleaning - Year-over-year growth 2023-2028 (%)
    • 7.6 Oilfield chemicals - Market size and forecast 2023-2028
      • Chart on Oilfield chemicals - Market size and forecast 2023-2028 ($ million)
      • Data Table on Oilfield chemicals - Market size and forecast 2023-2028 ($ million)
      • Chart on Oilfield chemicals - Year-over-year growth 2023-2028 (%)
      • Data Table on Oilfield chemicals - Year-over-year growth 2023-2028 (%)
    • 7.7 Others - Market size and forecast 2023-2028
      • Chart on Others - Market size and forecast 2023-2028 ($ million)
      • Data Table on Others - Market size and forecast 2023-2028 ($ million)
      • Chart on Others - Year-over-year growth 2023-2028 (%)
      • Data Table on Others - Year-over-year growth 2023-2028 (%)
    • 7.8 Market opportunity by Application
      • Market opportunity by Application ($ million)
      • Data Table on Market opportunity by Application ($ million)

    8 Customer Landscape

    • 8.1 Customer landscape overview
      • Analysis of price sensitivity, lifecycle, customer purchase basket, adoption rates, and purchase criteria

    9 Geographic Landscape

    • 9.1 Geographic segmentation
      • Chart on Market share by geography 2023-2028 (%)
      • Data Table on Market share by geography 2023-2028 (%)
    • 9.2 Geographic comparison
      • Chart on Geographic comparison
      • Data Table on Geographic comparison
    • 9.3 Europe - Market size and forecast 2023-2028
      • Chart on Europe - Market size and forecast 2023-2028 ($ million)
      • Data Table on Europe - Market size and forecast 2023-2028 ($ million)
      • Chart on Europe - Year-over-year growth 2023-2028 (%)
      • Data Table on Europe - Year-over-year growth 2023-2028 (%)
    • 9.4 North America - Market size and forecast 2023-2028
      • Chart on North America - Market size and forecast 2023-2028 ($ million)
      • Data Table on North America - Market size and forecast 2023-2028 ($ million)
      • Chart on North America - Year-over-year growth 2023-2028 (%)
      • Data Table on North America - Year-over-year growth 2023-2028 (%)
    • 9.5 APAC - Market size and forecast 2023-2028
      • Chart on APAC - Market size and forecast 2023-2028 ($ million)
      • Data Table on APAC - Market size and forecast 2023-2028 ($ million)
      • Chart on APAC - Year-over-year growth 2023-2028 (%)
      • Data Table on APAC - Year-over-year growth 2023-2028 (%)
    • 9.6 South America - Market size and forecast 2023-2028
      • Chart on South America - Market size and forecast 2023-2028 ($ million)
      • Data Table on South America - Market size and forecast 2023-2028 ($ million)
      • Chart on South America - Year-over-year growth 2023-2028 (%)
      • Data Table on South America - Year-over-year growth 2023-2028 (%)
    • 9.7 Middle East and Africa - Market size and forecast 2023-2028
      • Chart on Middle East and Africa - Market size and forecast 2023-2028 ($ million)
      • Data Table on Middle East and Africa - Market size and forecast 2023-2028 ($ million)
      • Chart on Middle East and Africa - Year-over-year growth 2023-2028 (%)
      • Data Table on Middle East and Africa - Year-over-year growth 2023-2028 (%)
    • 9.8 US - Market size and forecast 2023-2028
      • Chart on US - Market size and forecast 2023-2028 ($ million)
      • Data Table on US - Market size and forecast 2023-2028 ($ million)
      • Chart on US - Year-over-year growth 2023-2028 (%)
      • Data Table on US - Year-over-year growth 2023-2028 (%)
    • 9.9 China - Market size and forecast 2023-2028
      • Chart on China - Market size and forecast 2023-2028 ($ million)
      • Data Table on China - Market size and forecast 2023-2028 ($ million)
      • Chart on China - Year-over-year growth 2023-2028 (%)
      • Data Table on China - Year-over-year growth 2023-2028 (%)
    • 9.10 Germany - Market size and forecast 2023-2028
      • Chart on Germany - Market size and forecast 2023-2028 ($ million)
      • Data Table on Germany - Market size and forecast 2023-2028 ($ million)
      • Chart on Germany - Year-over-year growth 2023-2028 (%)
      • Data Table on Germany - Year-over-year growth 2023-2028 (%)
    • 9.11 UK - Market size and forecast 2023-2028
      • Chart on UK - Market size and forecast 2023-2028 ($ million)
      • Data Table on UK - Market size and forecast 2023-2028 ($ million)
      • Chart on UK - Year-over-year growth 2023-2028 (%)
      • Data Table on UK - Year-over-year growth 2023-2028 (%)
    • 9.12 France - Market size and forecast 2023-2028
      • Chart on France - Market size and forecast 2023-2028 ($ million)
      • Data Table on France - Market size and forecast 2023-2028 ($ million)
      • Chart on France - Year-over-year growth 2023-2028 (%)
      • Data Table on France - Year-over-year growth 2023-2028 (%)
    • 9.13 Market opportunity by geography
      • Market opportunity by geography ($ million)
      • Data Tables on Market opportunity by geography ($ million)

    10 Drivers, Challenges, and Opportunity/Restraints

    • 10.1 Market drivers
      • 10.2 Market challenges
        • 10.3 Impact of drivers and challenges
          • Impact of drivers and challenges in 2023 and 2028
        • 10.4 Market opportunities/restraints

          11 Competitive Landscape

          • 11.1 Overview
            • 11.2 Competitive Landscape
              • Overview on criticality of inputs and factors of differentiation
            • 11.3 Landscape disruption
              • Overview on factors of disruption
            • 11.4 Industry risks
              • Impact of key risks on business

            12 Competitive Analysis

            • 12.1 Companies profiled
              • Companies covered
            • 12.2 Market positioning of companies
              • Matrix on companies position and classification
            • 12.3 Arkema SA
              • Arkema SA - Overview
              • Arkema SA - Business segments
              • Arkema SA - Key news
              • Arkema SA - Key offerings
              • Arkema SA - Segment focus
            • 12.4 BASF SE
              • BASF SE - Overview
              • BASF SE - Business segments
              • BASF SE - Key news
              • BASF SE - Key offerings
              • BASF SE - Segment focus
            • 12.5 Clariant International Ltd.
              • Clariant International Ltd. - Overview
              • Clariant International Ltd. - Business segments
              • Clariant International Ltd. - Key news
              • Clariant International Ltd. - Key offerings
              • Clariant International Ltd. - Segment focus
            • 12.6 Croda International Plc
              • Croda International Plc - Overview
              • Croda International Plc - Business segments
              • Croda International Plc - Key news
              • Croda International Plc - Key offerings
              • Croda International Plc - Segment focus
            • 12.7 Evonik Industries AG
              • Evonik Industries AG - Overview
              • Evonik Industries AG - Business segments
              • Evonik Industries AG - Key news
              • Evonik Industries AG - Key offerings
              • Evonik Industries AG - Segment focus
            • 12.8 Galaxy Surfactants Ltd.
              • Galaxy Surfactants Ltd. - Overview
              • Galaxy Surfactants Ltd. - Product / Service
              • Galaxy Surfactants Ltd. - Key offerings
            • 12.9 Indorama Ventures Public Co. Ltd.
              • Indorama Ventures Public Co. Ltd. - Overview
              • Indorama Ventures Public Co. Ltd. - Business segments
              • Indorama Ventures Public Co. Ltd. - Key news
              • Indorama Ventures Public Co. Ltd. - Key offerings
              • Indorama Ventures Public Co. Ltd. - Segment focus
            • 12.10 Innospec Inc.
              • Innospec Inc. - Overview
              • Innospec Inc. - Business segments
              • Innospec Inc. - Key offerings
              • Innospec Inc. - Segment focus
            • 12.11 Jiangsu WanQi Biotechnology Co. Ltd.
              • Jiangsu WanQi Biotechnology Co. Ltd. - Overview
              • Jiangsu WanQi Biotechnology Co. Ltd. - Product / Service
              • Jiangsu WanQi Biotechnology Co. Ltd. - Key offerings
            • 12.12 Kao Corp.
              • Kao Corp. - Overview
              • Kao Corp. - Business segments
              • Kao Corp. - Key news
              • Kao Corp. - Key offerings
              • Kao Corp. - Segment focus
            • 12.13 Kensing LLC
              • Kensing LLC - Overview
              • Kensing LLC - Product / Service
              • Kensing LLC - Key offerings
            • 12.14 Pacmoore Products Inc.
              • Pacmoore Products Inc. - Overview
              • Pacmoore Products Inc. - Product / Service
              • Pacmoore Products Inc. - Key offerings
            • 12.15 Sirius International BV
              • Sirius International BV - Overview
              • Sirius International BV - Product / Service
              • Sirius International BV - Key offerings
            • 12.16 Solvay SA
              • Solvay SA - Overview
              • Solvay SA - Business segments
              • Solvay SA - Key news
              • Solvay SA - Key offerings
              • Solvay SA - Segment focus
            • 12.17 Stepan Co.
              • Stepan Co. - Overview
              • Stepan Co. - Business segments
              • Stepan Co. - Key news
              • Stepan Co. - Key offerings
              • Stepan Co. - Segment focus

            13 Appendix

            • 13.1 Scope of the report
              • 13.2 Inclusions and exclusions checklist
                • Inclusions checklist
                • Exclusions checklist
              • 13.3 Currency conversion rates for US$
                • Currency conversion rates for US$
              • 13.4 Research methodology
                • Research methodology
              • 13.5 Data procurement
                • Information sources
              • 13.6 Data validation
                • Data validation
              • 13.7 Validation techniques employed for market sizing
                • Validation techniques employed for market sizing
              • 13.8 Data synthesis
                • Data synthesis
              • 13.9 360 degree market analysis
                • 360 degree market analysis
              • 13.10 List of abbreviations
                • List of abbreviations

              Research Methodology

              Technavio presents a detailed picture of the market by way of study, synthesis, and summation of data from multiple sources. The analysts have presented the various facets of the market with a particular focus on identifying the key industry influencers. The data thus presented is comprehensive, reliable, and the result of extensive research, both primary and secondary.

              INFORMATION SOURCES

              Primary sources

              • Manufacturers and suppliers
              • Channel partners
              • Industry experts
              • Strategic decision makers

              Secondary sources

              • Industry journals and periodicals
              • Government data
              • Financial reports of key industry players
              • Historical data
              • Press releases

              DATA ANALYSIS

              Data Synthesis

              • Collation of data
              • Estimation of key figures
              • Analysis of derived insights

              Data Validation

              • Triangulation with data models
              • Reference against proprietary databases
              • Corroboration with industry experts

              REPORT WRITING

              Qualitative

              • Market drivers
              • Market challenges
              • Market trends
              • Five forces analysis

              Quantitative

              • Market size and forecast
              • Market segmentation
              • Geographical insights
              • Competitive landscape

              Interested in this report?

              Get your sample now to see our research methodology and insights!

              Download Now

              Frequently Asked Questions

              Natural Surfactants market growth will increase by $ 3781.4 mn during 2024-2028 .

              The Natural Surfactants market is expected to grow at a CAGR of 5.41% during 2024-2028 .

              Natural Surfactants market is segmented by Type( Synthetic surfactants, Bio-based surfactants, Industrial cleaning, Oilfield chemicals, Others) Application( Detergents, Personal care, Industrial cleaning, Oilfield chemicals, Others)

              Abitec, Arkema SA, BASF SE, Clariant International Ltd., Croda International Plc, Evonik Industries AG, Galaxy Surfactants Ltd., Indorama Ventures Public Co. Ltd., Innospec Inc., Jiangsu WanQi Biotechnology Co. Ltd., Kao Corp., Kensing LLC, KLK Oleo, NutraSkin USA, Pacmoore Products Inc., PCC Rokita SA, Sirius International BV, Solvay SA, Stepan Co., VedaOils are a few of the key vendors in the Natural Surfactants market.

              North America will register the highest growth rate of 34% among the other regions. Therefore, the Natural Surfactants market in North America is expected to garner significant business opportunities for the vendors during the forecast period.

              US, China, Germany, UK, France

              • Increasing generation of industrial wasteThe waste generated from various industrial activities has been increasing continuously. According to the World Bank Group is the driving factor this market.
              • at the current level is the driving factor this market.
              • without urgent action is the driving factor this market.
              • global industrial waste will increase by 70% by 2050. The East Asia and Pacific region generates the highest amount of the world's waste is the driving factor this market.
              • which is around 23% is the driving factor this market.
              • while the Middle East and North Africa region generates the least is the driving factor this market.
              • which is approximately 6% of the total industrial waste generated globally. The continuous increase in industrial waste generation globally drives the increased need for natural surfactants. This is because industrial waste is a source of raw materials for the manufacture of natural surfactants and has been identified as a renewable feedstock. Natural surfactants are produced from environment-friendly substrates is the driving factor this market.
              • such as agro-industrial waste products is the driving factor this market.
              • crop residues is the driving factor this market.
              • and waste generated by the oil processing and food processing industries. Thus is the driving factor this market.
              • the high rate of generation of industrial waste is expected to increase the production of natural surfactants during the forecast period. is the driving factor this market.

              The Natural Surfactants market vendors should focus on grabbing business opportunities from the Synthetic surfactants segment as it accounted for the largest market share in the base year.