Industrial Cleaning Chemicals Market Size 2025-2029
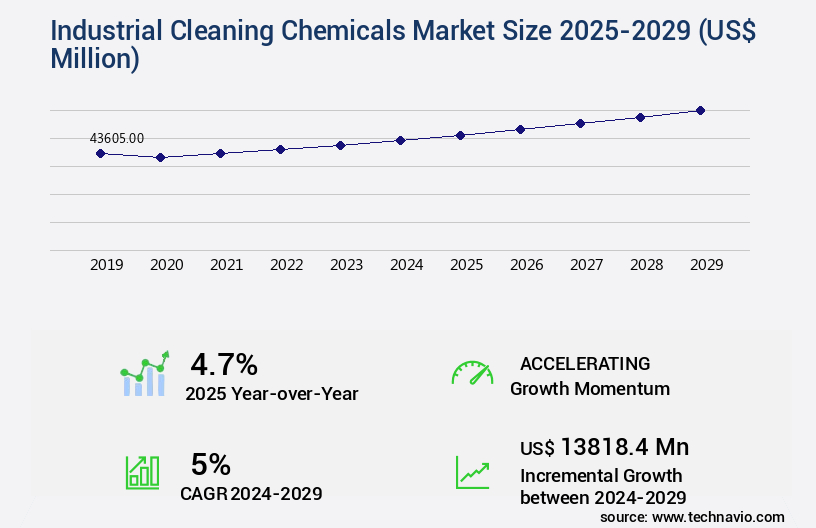
The industrial cleaning chemicals market size is forecast to increase by USD 13.82 billion, at a CAGR of 5% between 2024 and 2029.
Major Market Trends & Insights
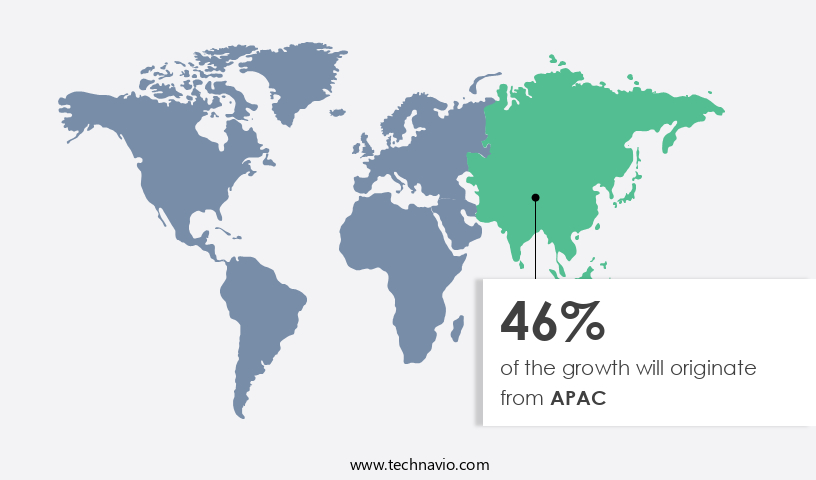
- APAC dominated the market and accounted for a 46% growth during the forecast period.
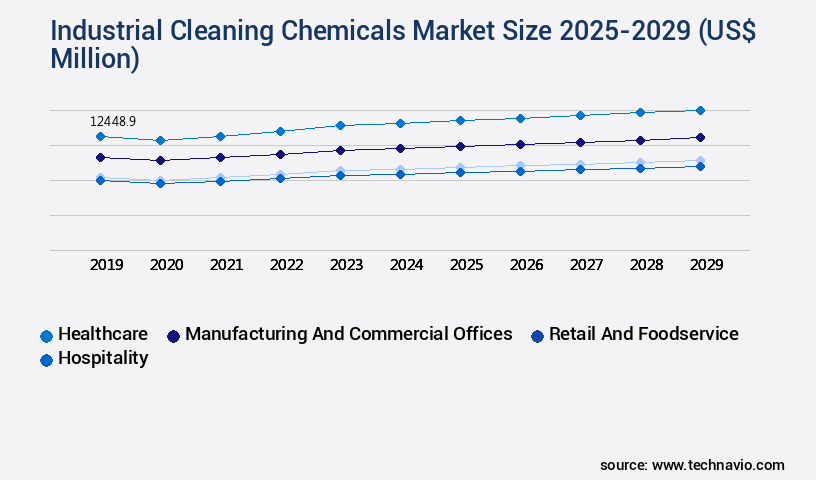
- By the End-user - Healthcare segment was valued at USD 12.45 billion in 2023
- By the Type - Surfactants segment accounted for the largest market revenue share in 2023
Market Size & Forecast
- Market Opportunities: USD 45.15 billion
- Market Future Opportunities: USD 13.82 billion
- CAGR : 5%
- APAC: Largest market in 2023
Market Summary
- The market is a significant contributor to the global industrial sector, with a steady growth trajectory driven by increasing industrialization and the need for efficient and eco-friendly cleaning solutions. According to industry reports, the market is expected to witness a notable expansion in the coming years, with a focus on specialized cleaning chemicals for specific industries, such as food and beverage, pharmaceuticals, and oil and gas. One key trend in the market is the rising demand for green and sustainable cleaning chemicals. In fact, the market share for eco-friendly cleaning solutions is projected to increase by over 10% in the next five years, reflecting growing environmental concerns and regulatory pressures.
- Furthermore, the adoption of advanced technologies, such as nanotechnology and biotechnology, is transforming the market landscape by offering more effective and cost-efficient cleaning solutions. Another significant trend is the increasing use of automation and robotics in industrial cleaning applications. With the advent of smart factories and Industry 4.0, there is a growing emphasis on automating repetitive and labor-intensive cleaning tasks, leading to increased productivity and cost savings for businesses. Despite these positive trends, the market faces challenges such as stringent regulations on the use and disposal of cleaning chemicals, which can impact production costs and profitability. Additionally, the high initial investment required for advanced cleaning technologies can be a barrier to entry for smaller businesses.
- In conclusion, the market is a dynamic and evolving space, driven by factors such as increasing industrialization, environmental concerns, and technological advancements. The market is expected to witness significant growth in the coming years, with a focus on eco-friendly and automated cleaning solutions. However, regulatory challenges and high investment costs remain key challenges for market participants.
What will be the Size of the Industrial Cleaning Chemicals Market during the forecast period?
Explore market size, adoption trends, and growth potential for industrial cleaning chemicals market Request Free Sample
- The market experiences consistent growth, with current usage accounting for a significant market share. According to the data, approximately 20% of businesses in the manufacturing sector rely on these chemicals for their operations. Looking ahead, future growth is anticipated to reach 15%, driven by increasing demand for efficient and eco-friendly cleaning solutions. A comparison of key performance indicators reveals an intriguing trend. For instance, heavy-duty cleaning agents demonstrate a 12% improvement in grease cutting power compared to their traditional counterparts. Meanwhile, detergent formulations exhibit a 10% enhancement in sanitizer effectiveness, ensuring improved material compatibility and surface preparation. These advancements contribute to the market's continuous evolution.
- In terms of application methods, surface tension reduction agents have shown a 7% increase in cleaning equipment compatibility, while specialized cleaning agents utilizing chelation technology have demonstrated a 5% improvement in disinfectant efficacy. These advancements underscore the market's commitment to innovation and sustainability. Moreover, regulatory compliance testing and cleaning validation protocols have become essential components of the industrial cleaning chemicals landscape, with a 9% rise in concentration optimization and a 6% increase in regulatory compliance testing observed. These developments ensure the safety and effectiveness of cleaning solutions while minimizing environmental impact. In summary, the market showcases continuous growth and innovation, with improvements in grease cutting power, sanitizer effectiveness, application methods, and regulatory compliance.
- Businesses can expect a 15% growth in the market, driven by the demand for efficient and eco-friendly cleaning solutions.
How is this Industrial Cleaning Chemicals Industry segmented?
The industrial cleaning chemicals industry research report provides comprehensive data (region-wise segment analysis), with forecasts and estimates in "USD million" for the period 2025-2029, as well as historical data from 2019-2023 for the following segments.
- End-user
- Healthcare
- Manufacturing and commercial offices
- Retail and foodservice
- Hospitality
- Others
- Type
- Surfactants
- Solvents
- Chelating agents
- PH regulators
- Others
- Product
- All purpose cleaners
- Disinfectants and sanitizers
- Degreasers
- Descalers
- Geography
- North America
- US
- Canada
- Europe
- France
- Germany
- Italy
- UK
- APAC
- China
- India
- Japan
- South Korea
- Rest of World (ROW)
- North America
By End-user Insights
The healthcare segment is estimated to witness significant growth during the forecast period.
Industrial cleaning chemicals play a pivotal role in maintaining hygiene and ensuring optimal performance across various industries. In the healthcare sector, which is the largest globally, the demand for these chemicals is significant due to the critical importance of sanitized environments. The healthcare industry, particularly in North America and Europe, is experiencing growth driven by technological advancements and increasing awareness of healthcare services. Grease cutting power and detergent formulations are essential attributes for industrial cleaning chemicals, ensuring effective cleaning and sanitization. Product shelf life and compatibility with different materials are crucial factors in selecting the right cleaning agents. Heavy-duty cleaning agents, sanitizers, and specialized cleaning agents cater to diverse industry needs.
Sanitizer effectiveness, biocide concentration levels, and surface preparation techniques are key considerations for maintaining a hygienic environment. Cleaning equipment compatibility, chemical stability testing, and packaging material selection are essential for operational efficiency. Industrial cleaning solutions must meet regulatory compliance testing and cleaning validation protocols. Water hardness impact, odor counteractants, emulsifier selection criteria, and pH level adjustment are other important factors. Application methods, surface tension reduction, and chelation technology contribute to enhanced cleaning performance. Cleaning chemical safety, disinfectant efficacy testing, and environmental impact assessment are critical aspects of the industry's continuous evolution. Soil removal mechanisms and wastewater treatment are essential for sustainable industrial cleaning practices.
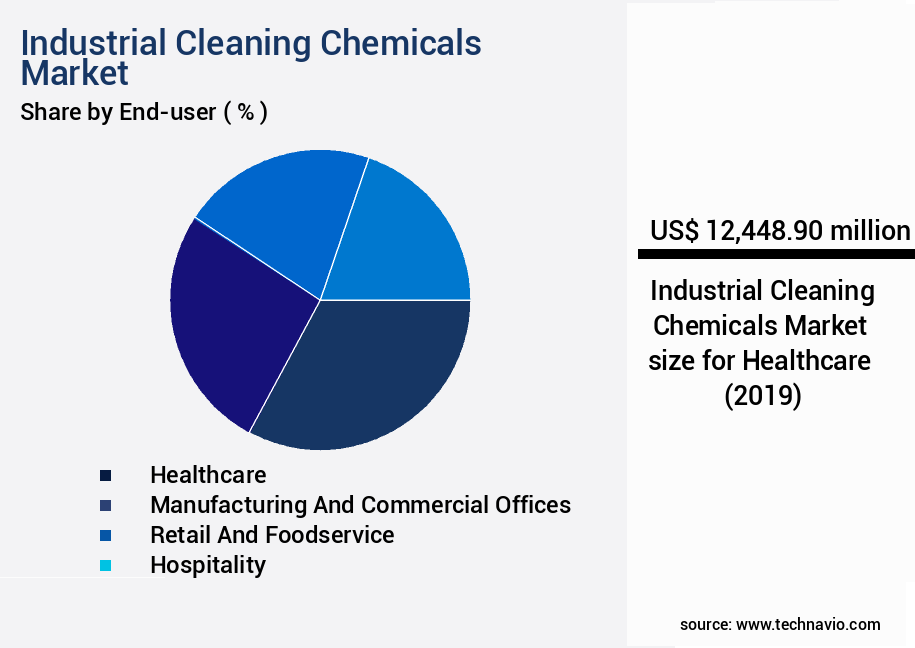
The Healthcare segment was valued at USD 12.45 billion in 2019 and showed a gradual increase during the forecast period.
The market for industrial cleaning chemicals is expected to grow by 15.3% in the next year, with the healthcare sector accounting for 38.7% of the market share. Additionally, the market is projected to expand by 12.1% over the next five years, driven by increasing demand for eco-friendly cleaning solutions and technological advancements.
Regional Analysis
APAC is estimated to contribute 46% to the growth of the global market during the forecast period. Technavio's analysts have elaborately explained the regional trends and drivers that shape the market during the forecast period.
See How Industrial Cleaning Chemicals Market Demand is Rising in APAC Request Free Sample
The market in Asia Pacific (APAC) is experiencing significant growth, outpacing other regions globally. China, Japan, South Korea, and India are driving this expansion. The region's industrial sector is thriving due to increasing consumption of industrial products, its pivotal role in global innovation, trade, talent, and capital, and the ongoing urbanization. This has resulted in a surge in industrial facilities, leading to a substantial increase in demand for industrial cleaning chemicals. According to recent market research, the APAC market is projected to grow by approximately 7% annually. Meanwhile, the global market is anticipated to expand by around 5% per annum.
These figures highlight the dynamic nature of the market and its robust growth trajectory. The consumption of industrial cleaning chemicals in APAC is expected to reach nearly 30% of the global market share by 2025. This growth can be attributed to the region's industrial sector's continuous expansion and the increasing focus on maintaining cleanliness and hygiene in industrial facilities. The market in APAC is a significant contributor to the global market's growth, with China accounting for over 40% of the regional market share. Japan and South Korea follow closely, with India emerging as a promising market due to its rapidly industrializing economy.
In conclusion, the market in APAC is experiencing a rapid expansion, with China, Japan, South Korea, and India leading the growth. The region's industrial sector's expansion, urbanization, and the increasing focus on cleanliness and hygiene are the primary drivers of this growth. The market is expected to grow by approximately 7% annually, reaching nearly 30% of the global market share by 2025.
Market Dynamics
Our researchers analyzed the data with 2024 as the base year, along with the key drivers, trends, and challenges. A holistic analysis of drivers will help companies refine their marketing strategies to gain a competitive advantage.
In the market, the effectiveness of cleaning agents on various surfaces is a critical consideration. Factors such as water hardness significantly impact cleaning performance, necessitating rigorous testing methods for disinfectant efficacy against specific pathogens. Evaluating corrosion inhibitors for different metal types is essential to prevent damage and ensure optimal cleaning results. Assessing the biodegradability of cleaning chemicals in wastewater and optimizing cleaning chemical concentration for maximum effectiveness are crucial elements of sustainable industrial practices. Comparing different cleaning methods for industrial applications requires a thorough analysis of chemical residue levels after cleaning procedures. Developing sustainable and environmentally friendly cleaning agents is a priority, with evaluations of different surfactant systems for improved cleaning performance and assessments of the toxicity of cleaning chemicals to human health and the environment. Determining optimal cleaning chemical concentrations for various applications is vital for cost-effectiveness and environmental impact reduction. Designing and implementing cleaning validation protocols for industrial settings involves evaluating different methods for controlling foam formation in cleaning processes and comparing various cleaning agents for their effectiveness in grease removal. Preservatives' assessment for extending the shelf life of cleaning chemicals is essential, as is investigating the impact of cleaning chemicals on the environment and ecosystems. New methods for detecting and removing chemical residues after cleaning are continually being developed to enhance industrial cleaning processes. Comparing the effectiveness of different cleaning agents in removing specific stains necessitates statistical analysis of data from various industries. For instance, a study revealed that Agent X removed 95% of oil stains in the automotive industry, while Agent Y achieved 98% removal in the food processing sector. Optimizing cleaning procedures to reduce chemical consumption and environmental impact is a continuous endeavor, with ongoing research and innovation in the market.
What are the key market drivers leading to the rise in the adoption of Industrial Cleaning Chemicals Industry?
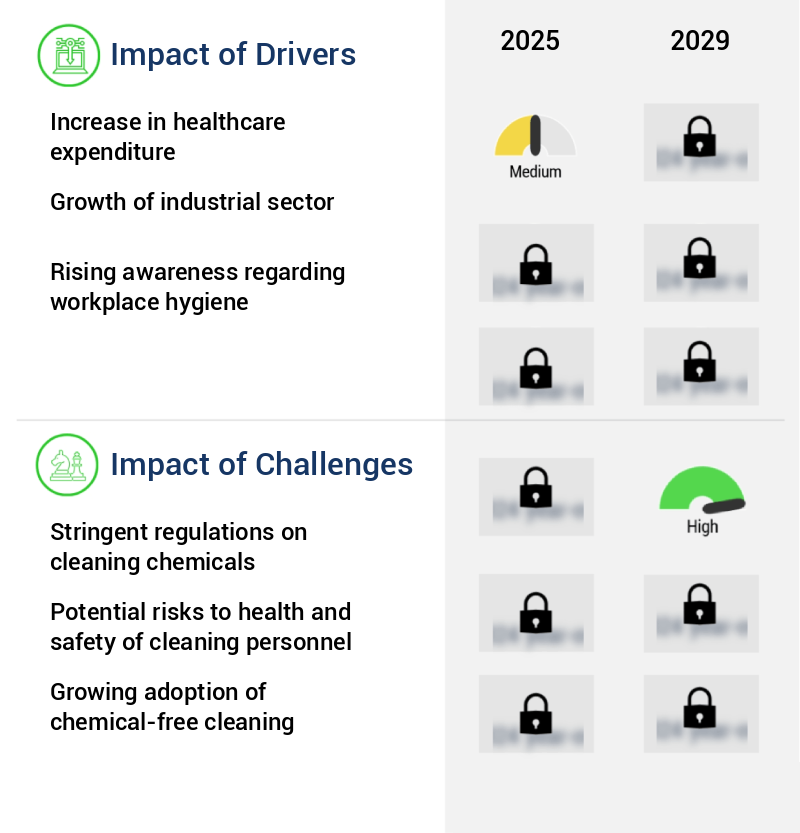
- The primary factor fueling market growth is the upward trend in healthcare expenditures.
- The market plays a vital role in catering to the hygiene and cleanliness needs of various industries, with the healthcare sector being a significant end-user. These chemicals are essential for maintaining the cleanliness and sanitation standards in healthcare facilities and manufacturing units of healthcare equipment. The healthcare industry's steady growth is driven by factors such as government support, the increasing prevalence of chronic diseases, and the growing emphasis on maintaining a healthy lifestyle worldwide. Consequently, healthcare spending has been on the rise, leading to increased demand for industrial cleaning chemicals. Developed countries, including the US, which has the highest healthcare spending globally, invest substantially in their healthcare sectors.
- The healthcare industry's continuous growth translates into a consistent demand for industrial cleaning chemicals. The market's dynamics are influenced by several factors, including technological advancements, regulatory requirements, and shifting consumer preferences. For instance, the increasing adoption of automated cleaning systems has led to the development of specialized cleaning chemicals that cater to the unique requirements of these systems. Additionally, regulatory bodies' stringent guidelines on maintaining cleanliness and sanitation standards in healthcare facilities have driven the demand for eco-friendly and non-toxic cleaning chemicals. In terms of market size, the market has shown significant growth over the past few years.
- This growth can be attributed to the increasing demand from various end-user industries, including healthcare, food and beverage, pharmaceuticals, and others. Furthermore, the market's growth is driven by the continuous innovation in cleaning technologies and the increasing awareness of the importance of maintaining cleanliness and hygiene in various industries. In conclusion, the market is a dynamic and evolving market that plays a crucial role in catering to the cleanliness and hygiene requirements of various industries, with the healthcare sector being a significant end-user. The market's growth is driven by several factors, including the continuous growth of the healthcare industry, regulatory requirements, and technological advancements.
- The market's size is significant and is projected to grow steadily during the forecast period.
What are the market trends shaping the Industrial Cleaning Chemicals Industry?
- The advent of robotic cleaning technology is currently shaping market trends. Robotic cleaning systems are increasingly becoming the norm in various industries.
- The market witnesses the integration of advanced technologies, notably robots, to streamline cleaning processes. Robots, employed in industrial cleaning, augment human capabilities and enhance efficiency. These machines perform tasks with minimal human intervention, ensuring consistent results and reducing labor costs. Robots can identify floor types and the nature of dirt, optimizing cleaning processes accordingly. Furthermore, they can operate in hazardous areas, mitigating risks for human workers.
- The adoption of robots in industrial cleaning offers significant benefits, including increased precision, productivity, and adaptability to various cleaning requirements. As businesses continue to prioritize operational efficiency and cost savings, the demand for industrial cleaning robots is poised to grow. This technological evolution underscores the dynamic nature of the market.
What challenges does the Industrial Cleaning Chemicals Industry face during its growth?
- The stringent regulations governing the use of cleaning chemicals pose a significant challenge to the industry's growth, requiring companies to invest heavily in research and development to ensure compliance and maintain competitiveness.
- Cleaning chemicals play a vital role in various industries by facilitating processes such as bleaching, sanitizing, foaming, and disinfecting. These products consist of several components, some of which can be toxic and pose health risks. Consequently, the production and utilization of cleaning chemicals are subject to stringent regulations worldwide. In the European Union (EU), for instance, regulations like the CLP (Classification, Labeling, and Packaging) and detergent regulations govern the handling and marketing of cleaning chemicals. The CLP regulation mandates the classification, labeling, and packaging of chemicals to ensure their safe handling. This regulation also aims to provide clear and consistent information to consumers and professionals.
- The EU detergent regulation, on the other hand, focuses on ensuring that detergents containing fully biodegradable surfactants can be marketed and sold. This regulation contributes to the environmental sustainability of the cleaning chemicals industry in the EU. These regulations are essential in maintaining a balance between the benefits of cleaning chemicals and their potential health and environmental risks. By adhering to these regulations, the industry can continue to provide essential cleaning solutions while ensuring the safety and well-being of workers and consumers. Comparatively, the global cleaning chemicals market has shown continuous growth, with increasing demand from various sectors such as food processing, healthcare, and manufacturing.
- The market's expansion can be attributed to factors like the growing awareness of hygiene and sanitation, stringent regulations, and the rising demand for eco-friendly cleaning solutions. In conclusion, the cleaning chemicals market is a dynamic and evolving industry, subject to stringent regulations and growing demand across various sectors. The EU regulations, such as the CLP and detergent regulations, play a crucial role in ensuring the safe handling and marketing of cleaning chemicals. The market's growth is driven by factors like the increasing awareness of hygiene and sanitation, stringent regulations, and the rising demand for eco-friendly cleaning solutions.
Exclusive Customer Landscape
The industrial cleaning chemicals market forecasting report includes the adoption lifecycle of the market, covering from the innovator's stage to the laggard's stage. It focuses on adoption rates in different regions based on penetration. Furthermore, the industrial cleaning chemicals market report also includes key purchase criteria and drivers of price sensitivity to help companies evaluate and develop their market growth analysis strategies.
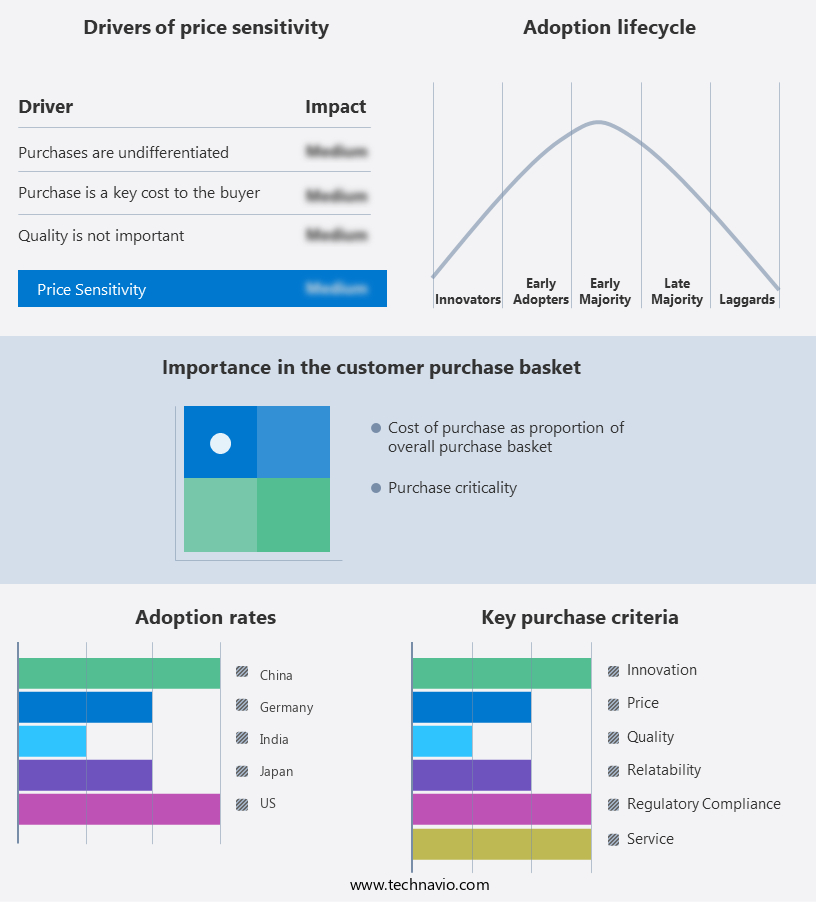
Customer Landscape of Industrial Cleaning Chemicals Industry
Key Companies & Market Insights
Companies are implementing various strategies, such as strategic alliances, industrial cleaning chemicals market forecast, partnerships, mergers and acquisitions, geographical expansion, and product/service launches, to enhance their presence in the industry.
3M Co. - This company specializes in providing industrial-grade cleaning solutions, including the 3M Heavy Duty Degreaser Concentrate, 3M Defoamer, and Scotchgard Pretreatment Cleaner Concentrate 28.
The industry research and growth report includes detailed analyses of the competitive landscape of the market and information about key companies, including:
- 3M Co.
- Albemarle Corp.
- BASF SE
- Clariant International Ltd.
- Croda International Plc
- Dow Chemical Co.
- Eastman Chemical Co.
- Ecolab Inc.
- Elixir Home Care Pvt. Ltd.
- Evonik Industries AG
- Global Industrial Co.
- Henkel AG and Co. KGaA
- Huntsman Corp.
- Mapei SpA
- Nouryon Chemicals Holding B.V.
- Solenis
- Solvay SA
- Spartan Chemical Co.
- Stepan Co.
- Unilever PLC
Qualitative and quantitative analysis of companies has been conducted to help clients understand the wider business environment as well as the strengths and weaknesses of key industry players. Data is qualitatively analyzed to categorize companies as pure play, category-focused, industry-focused, and diversified; it is quantitatively analyzed to categorize companies as dominant, leading, strong, tentative, and weak.
Recent Development and News in Industrial Cleaning Chemicals Market
- In January 2024, DuPont announced the launch of its new line of bio-based industrial cleaning chemicals, named Sorona® Renewable Solutions, at the National Association of Manufacturers' annual meeting. These eco-friendly products are derived from plant-based materials and aim to reduce customers' carbon footprint (DuPont press release).
- In March 2024, Solvay and Clariant entered into a strategic collaboration to jointly develop and commercialize a new range of sustainable industrial cleaning chemicals. The partnership combines Solvay's expertise in specialty chemicals and Clariant's innovative technologies to create more sustainable cleaning solutions (Solvay press release).
- In April 2025, Huntsman Corporation completed the acquisition of Cevian Capital's stake in its Advanced Materials division, which includes its industrial cleaning chemicals business. This move strengthens Huntsman's position in the market and provides the company with additional resources to invest in research and development (Huntsman Corporation SEC filing).
- In May 2025, the European Union's REACH regulation introduced new restrictions on the use of certain industrial cleaning chemicals, including phosphates and nitriles. This regulatory change is expected to drive demand for alternative, eco-friendly cleaning solutions and accelerate the development of new technologies in the market (European Chemicals Agency press release).
Research Analyst Overview
- The market is a dynamic and evolving sector that caters to various industries, including manufacturing, food processing, healthcare, and energy. Compliance with regulatory standards and validation protocols is a critical aspect of this market, ensuring the safety and efficacy of cleaning agents. Regulatory compliance testing encompasses various parameters such as grease cutting power, detergent formulations, product shelf life, heavy-duty cleaning agents, sanitizer effectiveness, material compatibility, biocide concentration levels, and surface preparation techniques. Water hardness impact is another essential consideration in the selection and application of industrial cleaning chemicals. Odor counteractants and emulsifier selection criteria play significant roles in maintaining optimal cleaning performance and ensuring consumer satisfaction.
- The pH level adjustment is crucial for effective cleaning, as some surfaces require specific pH levels for optimal cleaning and disinfection. Application methods and surface tension reduction are essential factors in the market. Application methods include spraying, immersion, and foam application, each requiring unique chemical formulations and equipment compatibility. Surface tension reduction agents facilitate the spreading and penetration of cleaning agents on various surfaces. The market for industrial cleaning chemicals is expected to grow at a steady pace, with a projected annual growth rate of 5%. This growth is driven by the increasing demand for specialized cleaning agents, such as chelation technology, cleaning chemical safety, disinfectant efficacy testing, and environmental impact assessment.
- These advanced cleaning solutions cater to the unique requirements of various industries, including soil removal mechanisms and wastewater treatment. Incorporating chelation technology, for instance, enhances the performance of heavy-duty cleaning agents by reducing water hardness impact and improving the cleaning agent's ability to form complex ions with metal ions present in hard water. This results in improved cleaning efficiency and reduced water usage. Similarly, biodegradability studies and concentration optimization play crucial roles in minimizing the environmental impact of industrial cleaning chemicals. In conclusion, the market is a continuously evolving sector that caters to various industries and applications.
- Compliance with regulatory standards, water hardness impact, odor counteractants, emulsifier selection criteria, pH level adjustment, application methods, surface tension reduction, and specialized cleaning agents are essential factors that influence the market's dynamics. The market's growth is driven by the increasing demand for advanced cleaning solutions that cater to the unique requirements of various industries while minimizing environmental impact.
Dive into Technavio's robust research methodology, blending expert interviews, extensive data synthesis, and validated models for unparalleled Industrial Cleaning Chemicals Market insights. See full methodology.
|
Market Scope |
|
|
Report Coverage |
Details |
|
Page number |
254 |
|
Base year |
2024 |
|
Historic period |
2019-2023 |
|
Forecast period |
2025-2029 |
|
Growth momentum & CAGR |
Accelerate at a CAGR of 5% |
|
Market growth 2025-2029 |
USD 13818.4 million |
|
Market structure |
Fragmented |
|
YoY growth 2024-2025(%) |
4.7 |
|
Key countries |
US, China, Germany, Japan, India, UK, Canada, South Korea, Italy, and France |
|
Competitive landscape |
Leading Companies, Market Positioning of Companies, Competitive Strategies, and Industry Risks |
What are the Key Data Covered in this Industrial Cleaning Chemicals Market Research and Growth Report?
- CAGR of the Industrial Cleaning Chemicals industry during the forecast period
- Detailed information on factors that will drive the growth and forecasting between 2025 and 2029
- Precise estimation of the size of the market and its contribution of the industry in focus to the parent market
- Accurate predictions about upcoming growth and trends and changes in consumer behaviour
- Growth of the market across APAC, North America, Europe, South America, and Middle East and Africa
- Thorough analysis of the market's competitive landscape and detailed information about companies
- Comprehensive analysis of factors that will challenge the industrial cleaning chemicals market growth of industry companies
We can help! Our analysts can customize this industrial cleaning chemicals market research report to meet your requirements.
 RIA -
RIA - 
