Natural Thickeners Market Size 2026-2030
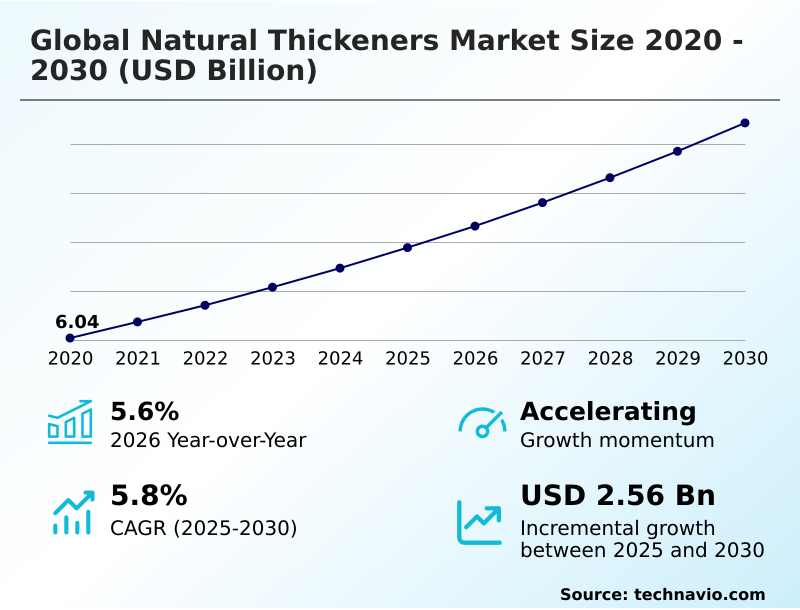
The natural thickeners market size is valued to increase by USD 2.56 billion, at a CAGR of 5.8% from 2025 to 2030. Increasing adoption of nutritional dietary natural thickeners will drive the natural thickeners market.
Major Market Trends & Insights
- APAC dominated the market and accounted for a 49.5% growth during the forecast period.
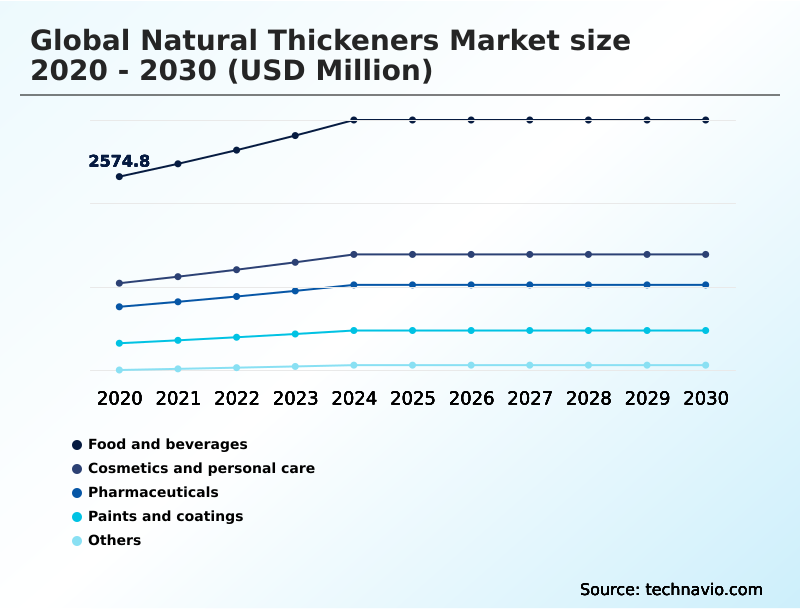
- By Application - Food and beverages segment was valued at USD 3.22 billion in 2024
- By Type - Plant based thickeners segment accounted for the largest market revenue share in 2024
Market Size & Forecast
- Market Opportunities: USD 4.40 billion
- Market Future Opportunities: USD 2.56 billion
- CAGR from 2025 to 2030 : 5.8%
Market Summary
- The natural thickeners market is experiencing significant evolution, driven primarily by the consumer-led clean-label movement. Demand for simple, recognizable ingredients has pushed manufacturers in food, beverage, and personal care industries to replace synthetic additives with natural alternatives. This shift underscores the importance of ingredients that provide viscosity, texture, and stability.
- Key drivers include the growing popularity of plant-based and gluten-free diets, which rely heavily on hydrocolloids to replicate the mouthfeel and structure of conventional products. For instance, a food manufacturer reformulating a dairy-free yogurt must leverage specific gelling agents to achieve a creamy consistency without syneresis, directly impacting consumer acceptance and brand loyalty.
- This necessitates a deep understanding of how different plant-based thickeners, such as starches, gums, and proteins, interact within complex food matrices. However, the market faces challenges from supply chain volatility and price fluctuations of raw agricultural materials. Additionally, the consistent performance and lower cost of some synthetic substitutes remain a competitive pressure, particularly in non-food applications.
- Current trends focus on innovation in plant-based sources and improving the functionality of existing thickeners to offer enhanced stability and sensory properties.
What will be the Size of the Natural Thickeners Market during the forecast period?
Get Key Insights on Market Forecast (PDF) Get Free Sample
How is the Natural Thickeners Market Segmented?
The natural thickeners industry research report provides comprehensive data (region-wise segment analysis), with forecasts and estimates in "USD million" for the period 2026-2030, as well as historical data from 2020-2024 for the following segments.
- Application
- Food and beverages
- Cosmetics and personal care
- Pharmaceuticals
- Paints and coatings
- Others
- Type
- Plant based thickeners
- Animal based thickeners
- Formulation
- Powdered thickeners
- Liquid thickeners
- Gel-based thickeners
- Geography
- APAC
- China
- India
- Japan
- Europe
- Germany
- France
- UK
- North America
- US
- Canada
- Mexico
- Middle East and Africa
- South Africa
- UAE
- Saudi Arabia
- South America
- Brazil
- Argentina
- Rest of World (ROW)
- APAC
By Application Insights
The food and beverages segment is estimated to witness significant growth during the forecast period.
The food and beverage segment is the largest end-user, with demand driven by the need for texture modification and emulsion stability in processed foods.
The application of gel-based structuring agents and starch retrogradation inhibitors is fundamental in creating desirable mouthfeel and extending shelf life in products from sauces to baked goods.
With approximately 1.4% of the global population affected by celiac disease, the role of ingredients providing moisture retention is critical in gluten-free formulations.
This consumer-led push for clean label products propels the use of colloidal suspension stabilizers and hydrocolloid blend synergy to replace synthetic additives, ensuring both functionality and transparency in an increasingly health-conscious marketplace.
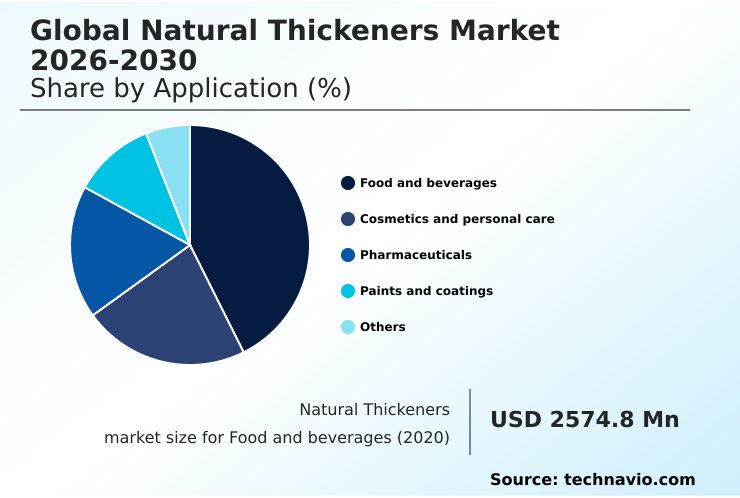
The Food and beverages segment was valued at USD 3.22 billion in 2024 and showed a gradual increase during the forecast period.
Regional Analysis
APAC is estimated to contribute 49.5% to the growth of the global market during the forecast period.Technavio’s analysts have elaborately explained the regional trends and drivers that shape the market during the forecast period.
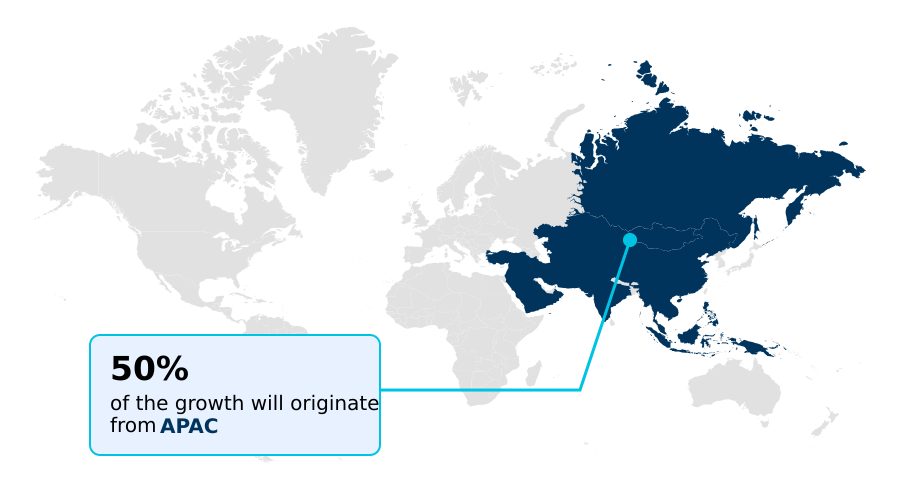
See How Natural Thickeners Market Demand is Rising in APAC Get Free Sample
Geographically, APAC is the epicenter of market growth, accounting for 49.5% of the global expansion, driven by rising demand for processed foods requiring ingredients like xanthan gum.
In Europe, where household expenditure recently grew by 6.29%, the focus is on premium applications for pharmaceutical excipient binders and dairy alternative stabilizers.
North America remains a mature market with strong demand for powdered thickener dispersibility and texture modification systems to support its extensive convenience food and beverage sectors.
The adoption of locust bean gum and tara gum is rising globally, driven by the plant-based movement. These regional dynamics shape the global sourcing and application strategies for firms dealing with natural film-forming agents and suspension agents.
Market Dynamics
Our researchers analyzed the data with 2025 as the base year, along with the key drivers, trends, and challenges. A holistic analysis of drivers will help companies refine their marketing strategies to gain a competitive advantage.
- Strategic decision-making in the natural thickeners market requires a deep understanding of specific application nuances and ingredient performance. For example, selecting xanthan gum for gluten-free baking is critical for crumb structure, while the choice of pectin for low sugar jams directly impacts gel strength and texture.
- In the rapidly growing plant-based sector, using carrageenan in dairy-free milk provides essential suspension, whereas gellan gum in plant-based yogurts creates a desirable firm set. Manufacturers focusing on indulgence categories often rely on guar gum for ice cream stabilization to control ice crystal growth.
- Formulators also evaluate using cellulose for low-fat dressings to mimic the mouthfeel of full-fat versions and using agar-agar as a gelatin substitute in vegan confectionery. The choice between tara gum for frozen desserts and locust bean gum in cream cheese depends on the desired melt-rate and creaminess.
- A key operational consideration is supply chain stability; price fluctuations in a single hydrocolloid, sometimes exceeding 20% in a quarter, can significantly impact cost-effective natural food thickeners sourcing. This drives interest in comparing xanthan gum vs guar gum for both cost and functionality. Furthermore, hydrocolloids for dysphagia diets must meet strict viscosity standards.
- The use of natural thickeners for cosmetic creams, stabilizing sauces with starches, and sourcing plant-based thickeners for vegan food all highlight the need for specialized solutions. The market also includes applications for rheology modifiers in water-based paints, natural excipients in pharmaceutical suspensions, and ingredients for preventing syneresis in dairy products, demonstrating the wide-ranging and technical demands placed on these ingredients.
What are the key market drivers leading to the rise in the adoption of Natural Thickeners Industry?
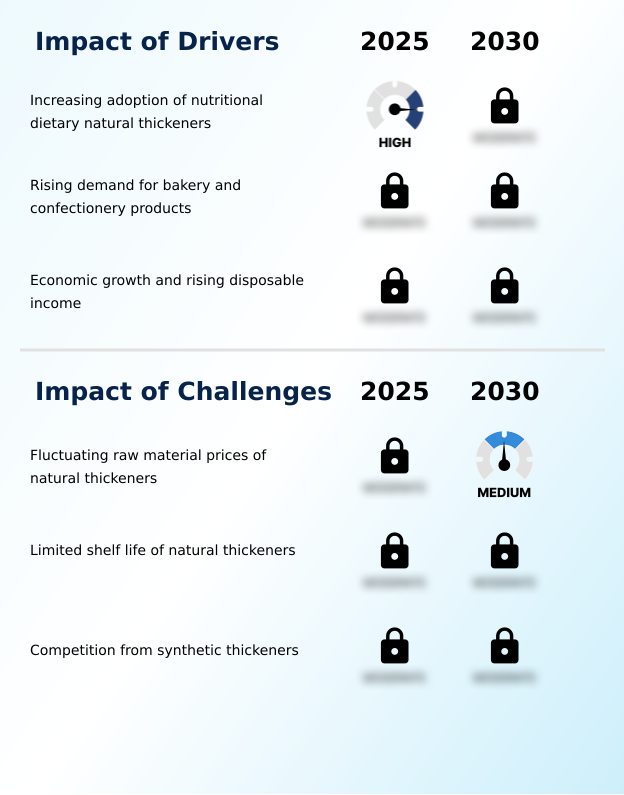
- The increasing adoption of nutritional and dietary natural thickeners, spurred by rising health consciousness and demand for clean-label products, is a key driver for market growth.
- Market growth is strongly driven by rising disposable incomes and heightened health awareness. As household consumption expenditure increases, consumers are prioritizing products with natural food additives and clean-label texturizing solutions.
- This fuels demand for high-viscosity food starches and animal-derived protein thickeners like gelatin in premium food products. The need for effective mouthfeel enhancement hydrocolloids and texture enhancement is critical in formulating products that meet these elevated consumer expectations.
- Furthermore, the pharmaceutical and cosmetic sectors are leveraging natural rheology modifiers and ingredients like agar-agar for improved product performance and stability, capitalizing on the consumer willingness to invest in higher-quality goods.
- In some developed economies, disposable income per capita has risen by over 3%.
What are the market trends shaping the Natural Thickeners Industry?
- A prominent market trend is the increasing number of product launches centered on plant-based thickeners. This shift is driven by growing consumer demand for clean-label and sustainable ingredients.
- A primary trend is the accelerated development of plant-based hydrocolloid systems and microbial fermentation thickeners, driven by consumer demand for sustainable and clean label ingredients. Innovations in cold water soluble gums are enabling manufacturers to improve processing efficiency, with some achieving up to a 15% reduction in hydration time.
- The expansion of plant based diets is fueling R&D in food-grade gelling agents like gellan gum and pectin to create novel textures. With the prevalence of biopsy-confirmed celiac disease at 0.7%, there is a heightened focus on gluten-free baking hydrocolloids.
- This shift is compelling firms to explore a wider range of plant-derived polysaccharide gums and carrageenan to meet both functional and dietary requirements, moving beyond traditional modified starches.
What challenges does the Natural Thickeners Industry face during its growth?
- The fluctuating prices of agricultural and microbial raw materials present a significant challenge to the stable growth of the natural thickeners industry.
- A significant challenge confronting the market is raw material price volatility and supply chain instability. Prices for key ingredients like guar gum can surge by as much as 20% in a single quarter due to agricultural conditions or competing industrial demand, disrupting production costs for syneresis control agents and stabilizing agents.
- This instability creates pressure to find reliable alternatives among hydrocolloids and cellulose derivatives. Furthermore, the technical challenge of ensuring consistent performance from natural ingredients, such as achieving desired viscosity control and preventing syneresis, requires significant formulation expertise.
- Firms must balance the consumer appeal of natural cosmetic emulsion stabilizers against the predictable functionality and lower cost of synthetic substitutes, a key consideration for maintaining competitive pricing.
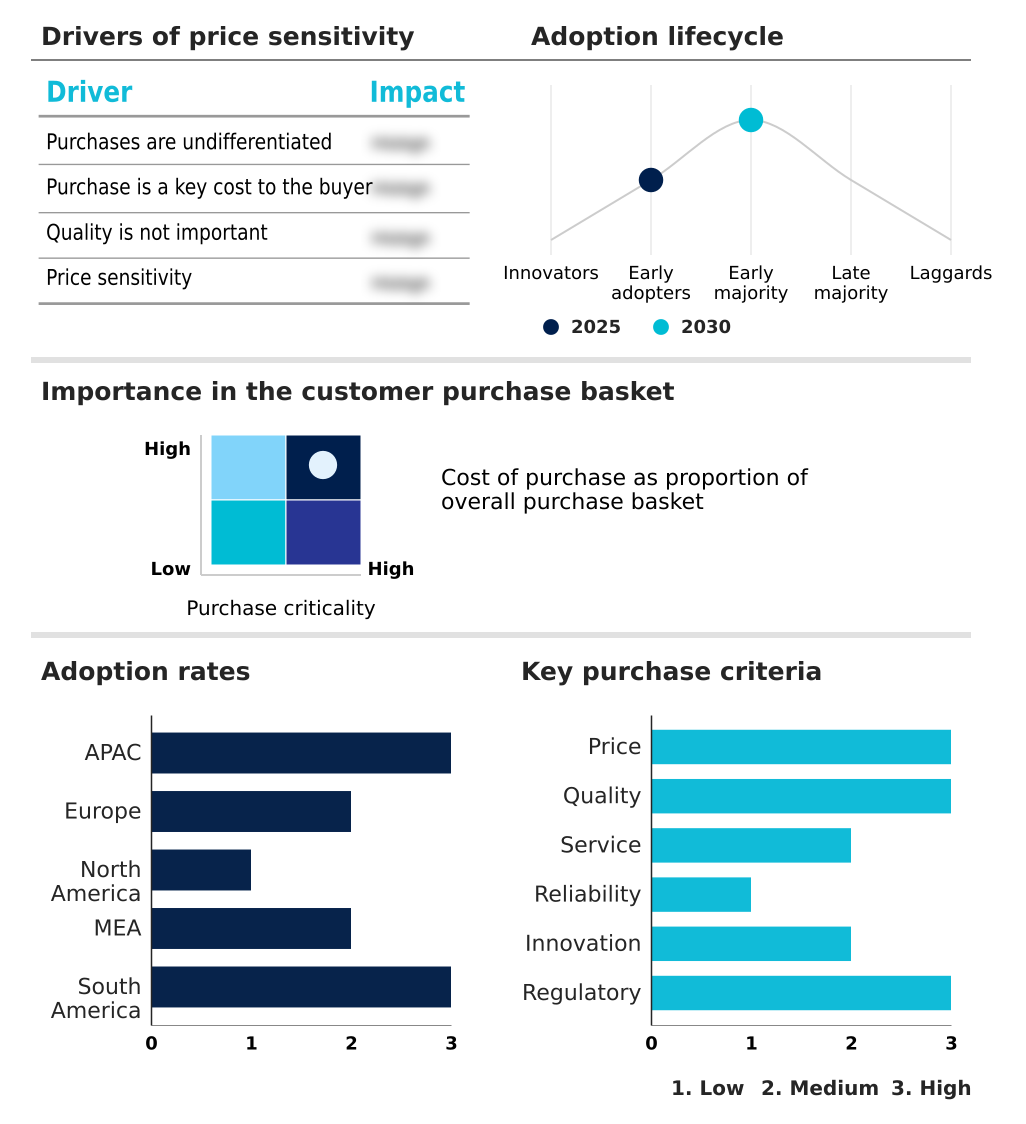
Exclusive Technavio Analysis on Customer Landscape
The natural thickeners market forecasting report includes the adoption lifecycle of the market, covering from the innovator’s stage to the laggard’s stage. It focuses on adoption rates in different regions based on penetration. Furthermore, the natural thickeners market report also includes key purchase criteria and drivers of price sensitivity to help companies evaluate and develop their market growth analysis strategies.
Customer Landscape of Natural Thickeners Industry
Competitive Landscape
Companies are implementing various strategies, such as strategic alliances, natural thickeners market forecast, partnerships, mergers and acquisitions, geographical expansion, and product/service launches, to enhance their presence in the industry.
Archer Daniels Midland Co. - The portfolio features advanced hydrocolloid solutions, including xanthan gum, designed to deliver superior viscosity and texture modification for diverse food and industrial applications.
The industry research and growth report includes detailed analyses of the competitive landscape of the market and information about key companies, including:
- Archer Daniels Midland Co.
- Ashland Inc.
- Avlast Hydrocolloids
- Cargill Inc.
- Compania Espanola S.A.
- CP Kelco US Inc.
- Fiberstar Inc.
- Gelita AG
- Ingredion Inc.
- Jungbunzlauer Suisse AG
- Lamberti SpA
- Lonza Group Ltd.
- NEXIRA
- Roquette Freres SA
- Scott Bader Co. Ltd.
- SEPPIC SA
- Silvateam Spa
- Tate and Lyle PLC
- The Lubrizol Corp.
Qualitative and quantitative analysis of companies has been conducted to help clients understand the wider business environment as well as the strengths and weaknesses of key industry players. Data is qualitatively analyzed to categorize companies as pure play, category-focused, industry-focused, and diversified; it is quantitatively analyzed to categorize companies as dominant, leading, strong, tentative, and weak.
Recent Development and News in Natural thickeners market
- In August, 2024, market volatility was highlighted as guar gum prices increased by approximately 20% due to heightened demand from feed industries and concerns over crop yields.
- In September, 2024, guar gum futures prices experienced a decline as dealers adjusted their positions in response to negative spot market trends.
- In February, 2025, Ingredion Inc. expanded its clean-label offerings by launching HOMECRAFT pulse flours and starches, a new range of thickeners derived from lentils, chickpeas, and yellow peas to meet demand for sustainable ingredients.
- In April, 2025, Tate and Lyle PLC introduced PROMITA F200, a specialized plant-based thickener designed to enhance the texture and mouthfeel in dairy alternative products like yogurts and beverages.
Dive into Technavio’s robust research methodology, blending expert interviews, extensive data synthesis, and validated models for unparalleled Natural Thickeners Market insights. See full methodology.
| Market Scope | |
|---|---|
| Page number | 300 |
| Base year | 2025 |
| Historic period | 2020-2024 |
| Forecast period | 2026-2030 |
| Growth momentum & CAGR | Accelerate at a CAGR of 5.8% |
| Market growth 2026-2030 | USD 2555.3 million |
| Market structure | Fragmented |
| YoY growth 2025-2026(%) | 5.6% |
| Key countries | China, India, Japan, South Korea, Australia, Indonesia, Germany, France, UK, Italy, Spain, The Netherlands, US, Canada, Mexico, South Africa, UAE, Saudi Arabia, Egypt, Israel, Brazil, Argentina and Chile |
| Competitive landscape | Leading Companies, Market Positioning of Companies, Competitive Strategies, and Industry Risks |
Research Analyst Overview
- The market is defined by a strategic pivot toward clean-label texturizing solutions and plant-based hydrocolloid systems. This transition is not merely a consumer trend but a fundamental shift impacting product development across food, pharmaceuticals, and cosmetics. Boardroom decisions are increasingly centered on securing reliable supply chains for microbial fermentation thickeners and plant-derived polysaccharide gums, as volatility can disrupt production.
- Companies are achieving enhanced product quality by leveraging mouthfeel enhancement hydrocolloids and syneresis control agents, which is critical in the competitive dairy alternative space. As disposable household incomes in key economies rise, consumers are more willing to pay a premium for products with superior texture and natural ingredients.
- The application of high-viscosity food starches and cold water soluble gums allows for innovation in convenience foods. Success hinges on mastering texture modification systems, including food-grade gelling agents and cosmetic emulsion stabilizers, to create differentiated offerings. The use of gluten-free baking hydrocolloids and dairy alternative stabilizers further illustrates the market's response to specialized dietary needs.
What are the Key Data Covered in this Natural Thickeners Market Research and Growth Report?
-
What is the expected growth of the Natural Thickeners Market between 2026 and 2030?
-
USD 2.56 billion, at a CAGR of 5.8%
-
-
What segmentation does the market report cover?
-
The report is segmented by Application (Food and beverages, Cosmetics and personal care, Pharmaceuticals, Paints and coatings, and Others), Type (Plant based thickeners, and Animal based thickeners), Formulation (Powdered thickeners, Liquid thickeners, and Gel-based thickeners) and Geography (APAC, Europe, North America, Middle East and Africa, South America)
-
-
Which regions are analyzed in the report?
-
APAC, Europe, North America, Middle East and Africa and South America
-
-
What are the key growth drivers and market challenges?
-
Increasing adoption of nutritional dietary natural thickeners, Fluctuating raw material prices of natural thickeners
-
-
Who are the major players in the Natural Thickeners Market?
-
Archer Daniels Midland Co., Ashland Inc., Avlast Hydrocolloids, Cargill Inc., Compania Espanola S.A., CP Kelco US Inc., Fiberstar Inc., Gelita AG, Ingredion Inc., Jungbunzlauer Suisse AG, Lamberti SpA, Lonza Group Ltd., NEXIRA, Roquette Freres SA, Scott Bader Co. Ltd., SEPPIC SA, Silvateam Spa, Tate and Lyle PLC and The Lubrizol Corp.
-
Market Research Insights
- Market dynamics are shaped by a strong consumer preference for clean label ingredients, boosting demand for natural food additives like xanthan gum and guar gum. The versatility of hydrocolloids is central to achieving specific gelling properties and texture enhancement in various formulations.
- With celiac disease affecting approximately 1.4% of the population, the need for effective gluten-free solutions drives innovation in ingredients such as pectin and modified starches. Firms are focused on viscosity control and emulsion stability to improve mouthfeel and product consistency. However, supply chains face pressure from competing industries, with biofuel demand for raw materials expected to increase by 30%.
- This dynamic forces a focus on diverse plant based sources like carrageenan and agar-agar to ensure a stable supply of stabilizing agents and prevent syneresis.
We can help! Our analysts can customize this natural thickeners market research report to meet your requirements.
 RIA -
RIA - 
