Near-Infrared (NIR) Spectroscopy Market Size 2025-2029
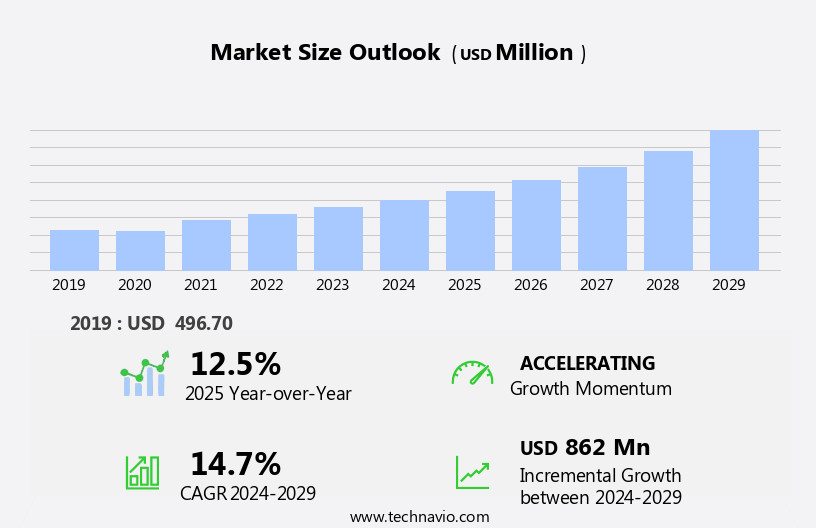
The near-infrared (NIR) spectroscopy market size is forecast to increase by USD 862 million at a CAGR of 14.7% between 2024 and 2029.
- The market is experiencing significant growth, driven primarily by the increasing concern for food safety and quality assurance in various industries. This trend is particularly prominent in the food and beverage sector, where NIR spectroscopy is used extensively for rapid and non-destructive analysis of food components, ensuring consumer safety and product authenticity. Another key driver is the evolution of miniature NIR spectrometers, which offer portability and flexibility, enabling on-site analysis and real-time monitoring. However, the high cost of NIR Spectroscopy devices remains a significant challenge for market expansion, particularly for small and medium-sized enterprises. To capitalize on market opportunities and navigate these challenges effectively, companies must focus on developing cost-effective solutions while maintaining the high-performance standards demanded by the industry.
- By doing so, they can cater to the growing demand for NIR spectroscopy in food safety and quality assurance applications, as well as in other sectors such as pharmaceuticals, agriculture, and materials testing.
What will be the Size of the Near-Infrared (NIR) Spectroscopy Market during the forecast period?
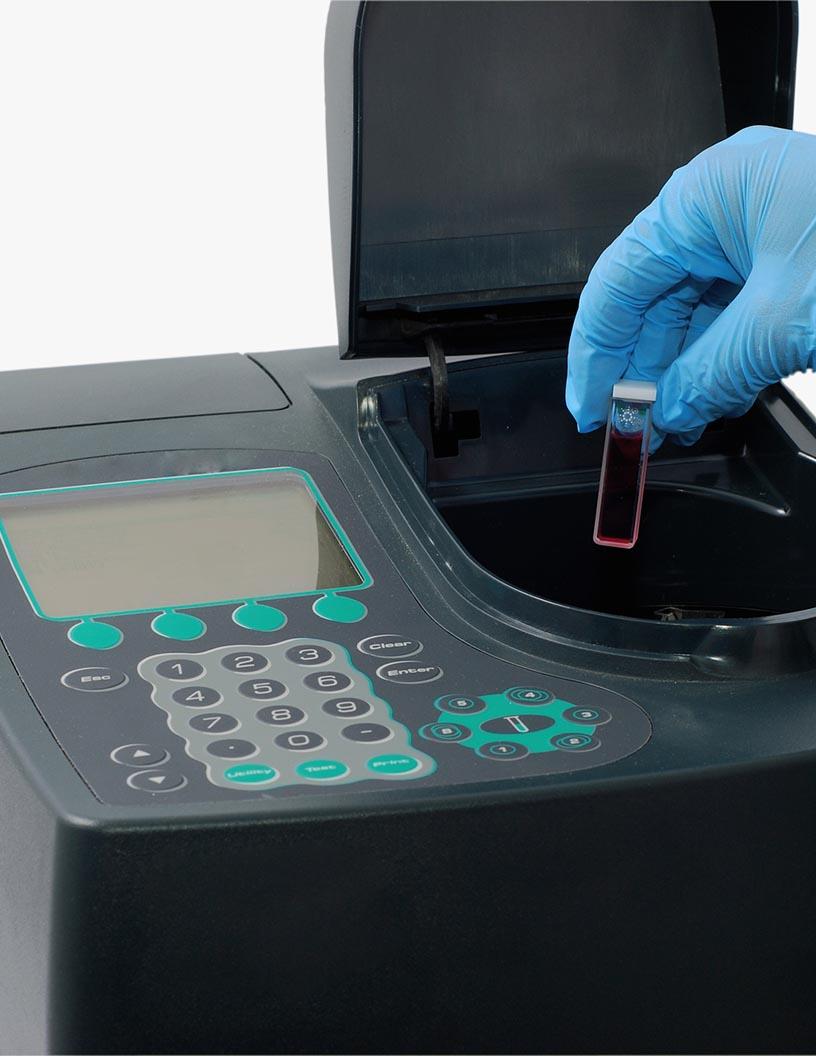
- Near-infrared (NIR) spectroscopy, a non-destructive analytical technique, continues to evolve and find applications across various sectors. In the realm of quality control, NIR spectroscopy is utilized for real-time monitoring of product composition, ensuring consistency and accuracy in manufacturing processes. This technique's data analysis capabilities extend to material identification, enabling efficient sorting and classification of materials in industries such as pharmaceuticals and agriculture. In clinical diagnostics, NIR spectroscopy plays a pivotal role in disease diagnosis, particularly in tissue analysis and cancer detection. Spectral analysis and calibration models enable the identification of disease biomarkers, contributing significantly to the advancement of medical imaging and non-invasive diagnostic tools.
- NIR spectroscopy's applications span beyond quality control and diagnostics. In agriculture, it is used for soil analysis, crop yield prediction, and pest detection, optimizing fertilizer usage and ensuring food safety. The technique's versatility extends to material characterization, where it is employed for polymer analysis and composition analysis, enabling the optimization of pharmaceutical formulations and at-line analysis in various industries. The continuous unfolding of market activities in NIR spectroscopy is driven by advancements in fiber optics, spectral library development, and molecular analysis. These innovations contribute to the technique's expanding role in process control, fiber content analysis, and in-line analysis, making NIR spectroscopy an indispensable tool for businesses seeking to enhance their analytical capabilities and improve operational efficiency.
How is this Near-Infrared (NIR) Spectroscopy Industry segmented?
The near-infrared (NIR) spectroscopy industry research report provides comprehensive data (region-wise segment analysis), with forecasts and estimates in "USD million" for the period 2025-2029, as well as historical data from 2019-2023 for the following segments.
- Product
- Benchtop
- Portable
- End-user
- Pharmaceutical and biomedical industry
- Food and beverage industry
- Others
- Product Type
- Fourier transform near-infrared (FT-NIR)
- Dispersive near-infrared (DNIR)
- Microelectromechanical Systems (MEMS)
- Geography
- North America
- US
- Canada
- Europe
- France
- Germany
- Italy
- UK
- APAC
- China
- India
- Japan
- South Korea
- Rest of World (ROW)
- North America
By Product Insights
The benchtop segment is estimated to witness significant growth during the forecast period.
NIR spectroscopy, a non-destructive analytical technique, is gaining significant traction in various industries for quality control and material characterization. In clinical diagnostics, NIR spectroscopy is used for cancer detection and tissue analysis, providing real-time, quantitative information. In agriculture, NIR spectroscopy is employed for crop yield prediction, soil analysis, and fertilizer optimization. In the pharmaceutical sector, it is used for drug content analysis, formulation composition, and polymers characterization. NIR spectroscopy's ability to identify materials based on their unique spectral signatures makes it an essential tool for food authenticity and product authentication. It is also used for chemical analysis, moisture content, ash content, and sugar content measurement in food safety applications.
In industrial processes, NIR spectroscopy is used for process control, in-line analysis, and at-line analysis. NIR spectroscopy techniques include transmission, reflection, and attenuated total reflectance (ATR). Data analysis is carried out using spectral libraries and molecular analysis. Calibration models are developed for quantitative analysis, and NIR spectroscopy is used for pest detection and fiber content measurement. Light scattering and spectral analysis are used to enhance the accuracy of the measurements. Fiber optics and hyperspectral imaging are used to extend the capabilities of NIR spectroscopy. NIR spectroscopy is also used for disease diagnosis, fiber content measurement, and protein content analysis.
In material identification, NIR spectroscopy is used for material characterization and composition analysis. NIR spectroscopy's ability to provide real-time, non-destructive, and accurate analysis makes it an essential tool for various industries. Its applications are vast, ranging from clinical diagnostics to agricultural analysis, from food safety to industrial process control. The use of NIR spectroscopy is expected to continue growing as more industries discover its benefits.
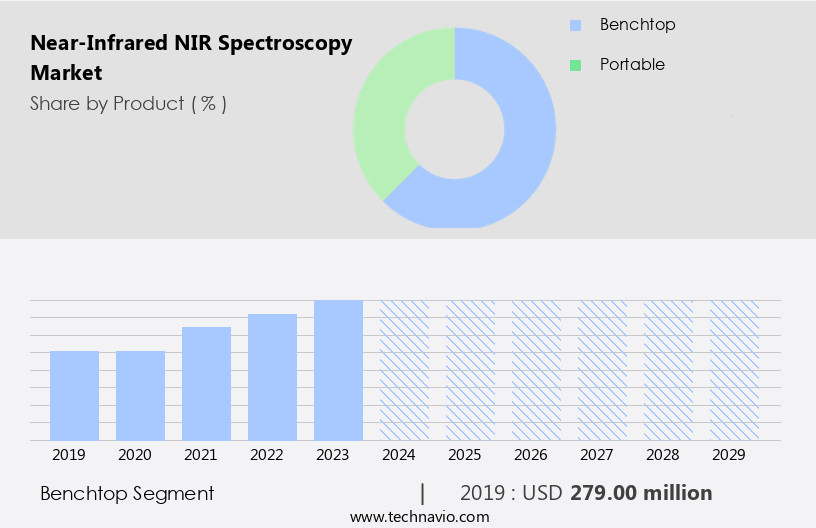
The Benchtop segment was valued at USD 279.00 million in 2019 and showed a gradual increase during the forecast period.
Regional Analysis
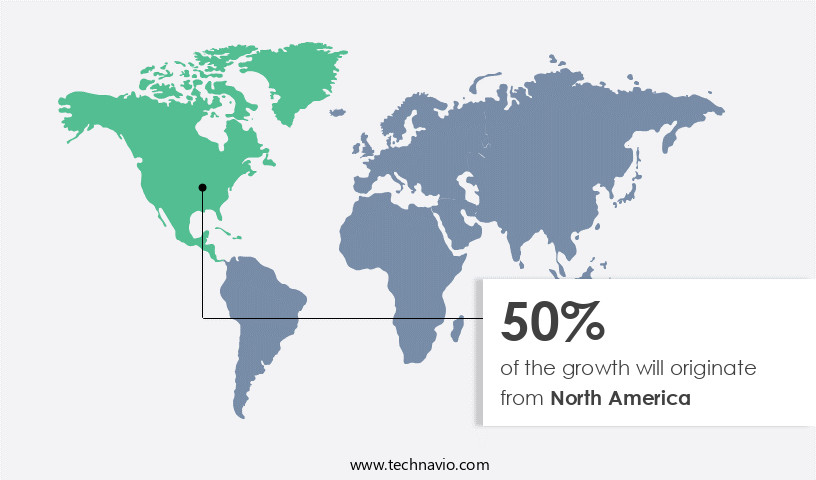
North America is estimated to contribute 50% to the growth of the global market during the forecast period. Technavio's analysts have elaborately explained the regional trends and drivers that shape the market during the forecast period.
The Near-Infrared Spectroscopy (NIR) market in the US is witnessing significant growth, particularly in the food and beverage industry. With an increasing number of food and beverage processing plants in leading agricultural states like California, New York, Texas, Pennsylvania, and Illinois, NIR spectroscopy is becoming increasingly important for real-time, non-destructive analysis of food and beverage products. NIRS analyzers enable quick insights into product composition, identifying parameters such as fat content, moisture content, sugar content, protein content, fiber content, and ash content. This data-driven approach helps optimize raw materials and ingredients, reduce off-specification products, and minimize reprocessing and disposal costs.
NIR spectroscopy is also used in clinical diagnostics, pharmaceutical analysis, and material identification, among other applications. The technology's ability to provide quantitative analysis and spectral libraries for molecular and material characterization makes it an essential tool for process control and quality assurance. NIR spectroscopy is also used in agriculture for crop yield analysis, soil analysis, and pest detection. In addition, NIR spectroscopy is used in industries such as polymers and fertilizers for optimization and composition analysis. Overall, the NIR spectroscopy market is evolving, with advancements in technology leading to applications in various industries, including food safety, medical imaging, and disease diagnosis.
Market Dynamics
Our researchers analyzed the data with 2024 as the base year, along with the key drivers, trends, and challenges. A holistic analysis of drivers will help companies refine their marketing strategies to gain a competitive advantage.
What are the key market drivers leading to the rise in the adoption of Near-Infrared (NIR) Spectroscopy Industry?
- The primary factor fueling market growth is the escalating concern for food safety.
- NIR spectroscopy is a valuable tool in various industries for ensuring food safety and quality control. This non-destructive analytical technique employs spectroscopic methods to analyze the light interaction with matter, providing valuable information on the chemical composition and physical properties of samples. In the food and beverage industries, NIR spectroscopy is used for material identification, tissue analysis, and on-line analysis to determine the fat content, moisture, and other essential parameters in fruits, vegetables, and processed food. The technology is also instrumental in clinical diagnostics, particularly in cancer detection, where it aids in the spectral analysis of tissue samples to distinguish between healthy and cancerous cells.
- The data analysis derived from NIR spectroscopy is harmonious and immersive, emphasizing the importance of maintaining high-quality standards and striking a balance between efficiency and accuracy. Recent research in this field continues to expand the application scope of NIR spectroscopy, offering promising solutions for light scattering analysis and other advanced techniques.
What are the market trends shaping the Near-Infrared (NIR) Spectroscopy Industry?
- The evolution of miniature near-infrared (NIR) spectrometers is an emerging market trend, as these compact devices offer significant advantages in various industries, including agriculture, food processing, and pharmaceuticals. These advanced instruments enable precise and non-destructive analysis of samples, making them indispensable tools for quality control, research, and development.
- The market is experiencing significant growth due to the increasing demand for real-time monitoring and analysis in various industries. Miniature NIR spectrometers are gaining popularity as companies continue to advance miniaturization techniques, enabling compact instruments with integrated optical systems, image sensors, and circuits. These instruments offer the advantage of field analysis and in-line applications, where they can be installed in pipes or plumbing tees without compromising performance. Microelectromechanical systems (MEMS) are another driving factor for the growth of NIR spectroscopy. MEMS technology allows for the development of small, portable devices for on-site analysis in industries such as medical imaging, soil analysis, ash content measurement, moisture content assessment, sugar content analysis, pharmaceutical analysis, drug content evaluation, fertilizer optimization, food authenticity testing, product authentication, and chemical analysis.
- The VIAVI Solutions MicroNIR spectrometer is a prime example of a versatile NIR spectrometer, offering flexibility in installation and scalability for various NIRS applications. The compact size and advanced features make it an essential tool for industries seeking efficient and accurate analysis in real-time.
What challenges does the Near-Infrared (NIR) Spectroscopy Industry face during its growth?
- The high cost of Near Infrared Spectroscopy (NIRS) devices represents a significant challenge that impedes the growth of the industry. This financial hurdle limits the widespread adoption of NIRS technology, which could otherwise contribute substantially to advancements in various sectors, including healthcare, agriculture, and food processing.
- Near-Infrared Spectroscopy (NIRS) is a valuable analytical tool in various industries, including food, agriculture, pharmaceuticals, and material science. NIRS devices utilize fiber optics to transmit and receive light in the near-infrared region, enabling molecular analysis of the sample. This technique is widely used for protein content determination, fiber content assessment, disease diagnosis, process control, and material characterization. The technology's ability to penetrate the surface and provide detailed spectral information makes it an essential tool for pest detection and quality control. Advanced NIRS devices incorporate sophisticated components, such as polarization interferometers and gray filters, to ensure high resolution and wavelength accuracy.
- These features increase the cost of the devices. Additionally, the integration of NIRS technology with electronic devices like tablets and smartphones enhances its functionality and convenience. Functional Near-Infrared Spectroscopy (fNIRS) is another application of NIRS, primarily used in brain-computer interfaces (BCI) for monitoring brain activity. FNIRS systems, which can cost between USD 100,000 and USD 400,000, are complex in design due to their specialized hardware. NIRS technology offers significant benefits for various industries, from food and agriculture to pharmaceuticals and material science. Despite the high costs associated with advanced NIRS devices, their ability to provide detailed, accurate, and non-destructive analysis makes them an indispensable tool for process control, quality assurance, and research applications.
Exclusive Customer Landscape
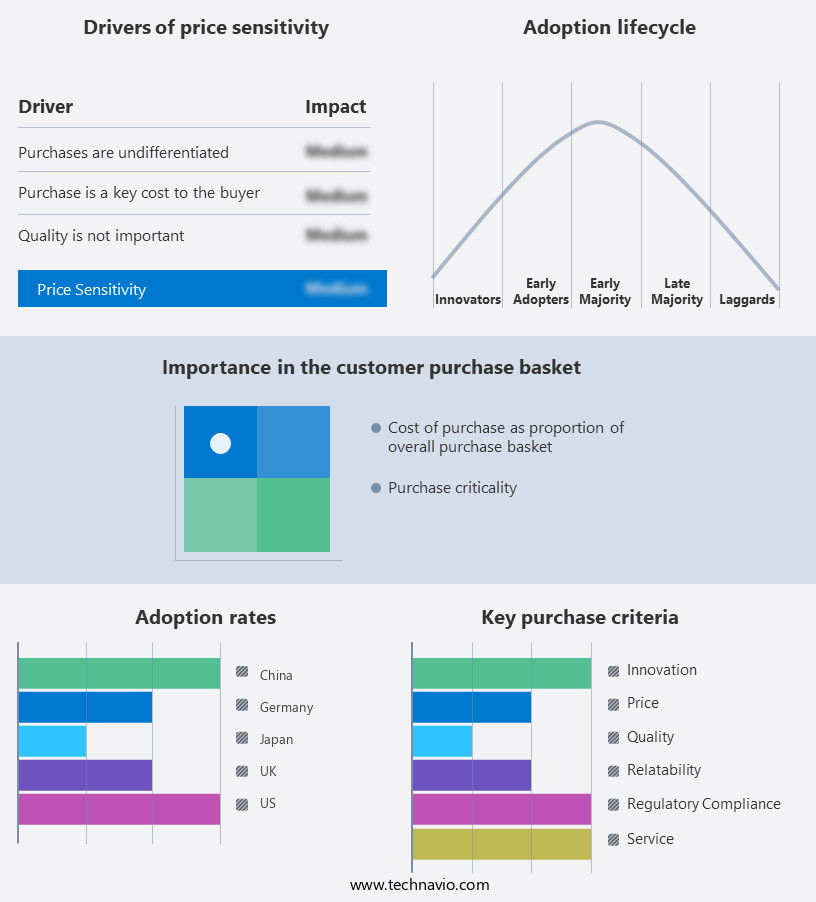
The near-infrared (NIR) spectroscopy market forecasting report includes the adoption lifecycle of the market, covering from the innovator's stage to the laggard's stage. It focuses on adoption rates in different regions based on penetration. Furthermore, the near-infrared (NIR) spectroscopy market report also includes key purchase criteria and drivers of price sensitivity to help companies evaluate and develop their market growth analysis strategies.
Customer Landscape
Key Companies & Market Insights
Companies are implementing various strategies, such as strategic alliances, near-infrared (nir) spectroscopy market forecast, partnerships, mergers and acquisitions, geographical expansion, and product/service launches, to enhance their presence in the industry.
ABB Ltd. - The company specializes in infrared spectroscopy solutions, providing advanced analysis through techniques such as FT-IR and FT-NIR.
The industry research and growth report includes detailed analyses of the competitive landscape of the market and information about key companies, including:
- ABB Ltd.
- Agilent Technologies Inc.
- Avantes BV
- B and W Tek
- Brimrose Corp. of America
- Bruker Corp.
- BUCHI Labortechnik AG
- FOSS
- Hamamatsu Photonics KK
- Lumex Instruments
- Metrohm AG
- Ocean Insight
- Perkin Elmer Inc.
- Polytec GmbH
- Sartorius AG
- Shimadzu Corp.
- Thermo Fisher Scientific Inc.
- Viavi Solutions Inc.
- Zeltex LLC
- ZEUTEC
Qualitative and quantitative analysis of companies has been conducted to help clients understand the wider business environment as well as the strengths and weaknesses of key industry players. Data is qualitatively analyzed to categorize companies as pure play, category-focused, industry-focused, and diversified; it is quantitatively analyzed to categorize companies as dominant, leading, strong, tentative, and weak.
Recent Development and News in Near-Infrared (NIR) Spectroscopy Market
- In February 2024, Thermo Fisher Scientific, a leading life sciences solutions provider, announced the launch of its new NIR spectroscopy system, the Thermo Scientific NIRSystems 6500, designed for food and beverage analysis. This innovative system offers enhanced sensitivity and accuracy, enabling faster and more efficient quality control and research applications (Thermo Fisher Scientific Press Release).
- In May 2025, Agilent Technologies, a leading technology company, entered into a strategic partnership with Ball Corporation, a global packaging solutions provider, to integrate NIR spectroscopy technology into Ball's aluminum beverage cans. This collaboration aims to provide real-time quality control and improve supply chain efficiency for beverage manufacturers (Agilent Technologies Press Release).
- In August 2024, Bruker Corporation, a prominent analytical instrumentation company, completed the acquisition of OptelGevity, a leading provider of inspection systems for pharmaceutical and medical device industries. The acquisition significantly expanded Bruker's portfolio in the NIR spectroscopy market, enabling it to offer advanced solutions for quality control and regulatory compliance (Bruker Corporation Press Release).
Research Analyst Overview
The market is witnessing significant growth due to the increasing adoption of sensor technology in various industries. Optical sensors, a key component of NIR spectroscopy, enable condition monitoring in real-time, driving the demand for predictive maintenance and online monitoring. Process validation and automation are essential in industries like pharmaceutical manufacturing and biopharmaceutical analysis, where NIR spectroscopy plays a pivotal role in ensuring regulatory compliance and quality assurance. Spectroscopic imaging and data visualization are revolutionizing precision agriculture, enabling farmers to optimize crop yield and reduce waste. In the realm of environmental monitoring, NIR spectroscopy is used for water and air quality analysis, ensuring regulatory compliance and public safety.
Biopharmaceutical analysis and drug development benefit from NIR spectroscopy's ability to identify spectral signatures, facilitating the discovery of new biomarkers and improving the efficiency of manufacturing processes. Machine learning and deep learning algorithms are being integrated into NIR spectroscopy systems to enhance data mining capabilities, providing valuable insights for process optimization and real-time release testing. Food processing industries are adopting NIR spectroscopy for food labeling and quality control, ensuring accurate and consistent product specifications. Remote sensing applications of NIR spectroscopy are expanding, providing valuable data for industries like food processing, environmental monitoring, and industrial process control.
In summary, the NIR spectroscopy market is experiencing dynamic growth, driven by advancements in sensor technology, process automation, and data analysis techniques. Applications in industries like pharmaceuticals, agriculture, food processing, and environmental monitoring continue to expand, making NIR spectroscopy an indispensable tool for businesses seeking to optimize processes, ensure regulatory compliance, and improve product quality.
Dive into Technavio's robust research methodology, blending expert interviews, extensive data synthesis, and validated models for unparalleled Near-Infrared (NIR) Spectroscopy Market insights. See full methodology.
|
Market Scope |
|
|
Report Coverage |
Details |
|
Page number |
218 |
|
Base year |
2024 |
|
Historic period |
2019-2023 |
|
Forecast period |
2025-2029 |
|
Growth momentum & CAGR |
Accelerate at a CAGR of 14.7% |
|
Market growth 2025-2029 |
USD 862 million |
|
Market structure |
Fragmented |
|
YoY growth 2024-2025(%) |
12.5 |
|
Key countries |
US, Canada, Germany, China, UK, France, Japan, India, Italy, and South Korea |
|
Competitive landscape |
Leading Companies, Market Positioning of Companies, Competitive Strategies, and Industry Risks |
What are the Key Data Covered in this Near-Infrared (NIR) Spectroscopy Market Research and Growth Report?
- CAGR of the Near-Infrared (NIR) Spectroscopy industry during the forecast period
- Detailed information on factors that will drive the growth and forecasting between 2025 and 2029
- Precise estimation of the size of the market and its contribution of the industry in focus to the parent market
- Accurate predictions about upcoming growth and trends and changes in consumer behaviour
- Growth of the market across North America, Europe, Asia, and Rest of World (ROW)
- Thorough analysis of the market's competitive landscape and detailed information about companies
- Comprehensive analysis of factors that will challenge the near-infrared (nir) spectroscopy market growth of industry companies
We can help! Our analysts can customize this near-infrared (nir) spectroscopy market research report to meet your requirements.
 RIA -
RIA - 
