Network Emulator Market Size 2025-2029
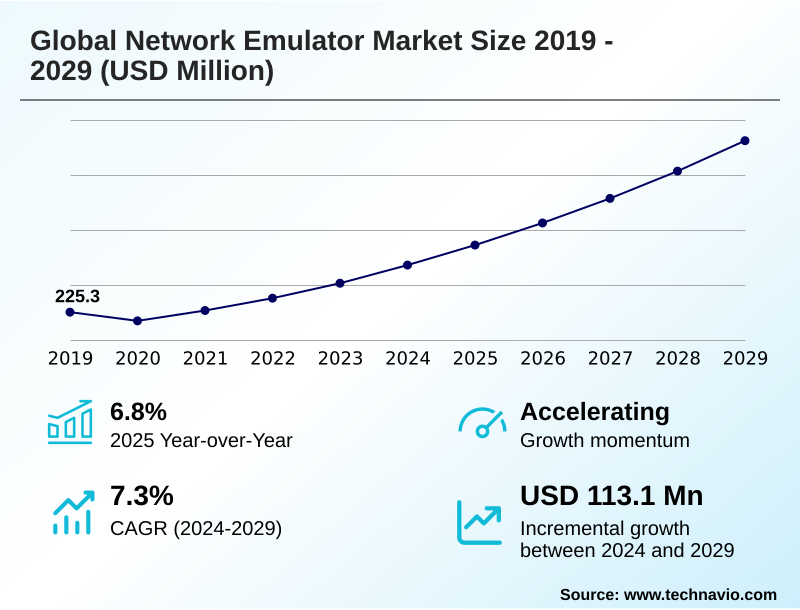
The network emulator market size is valued to increase by USD 113.1 million, at a CAGR of 7.3% from 2024 to 2029. Proliferation of 5G, 5G advanced, and impending transition to 6G will drive the network emulator market.
Major Market Trends & Insights
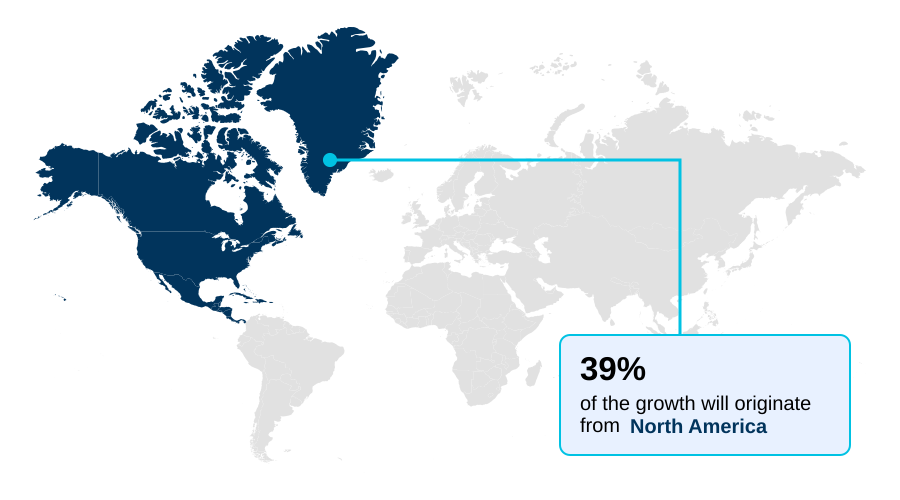
- North America dominated the market and accounted for a 38.9% growth during the forecast period.
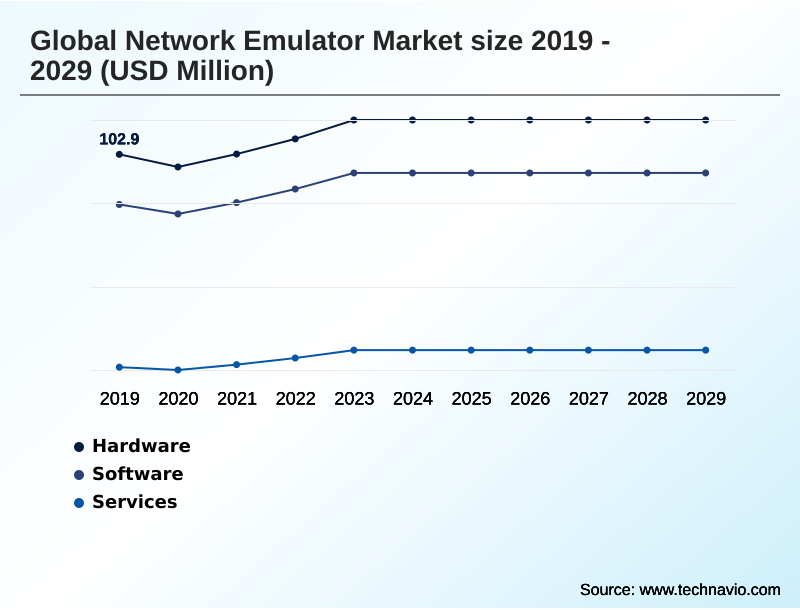
- By Component - Hardware segment was valued at USD 113.8 million in 2023
- By Deployment - On premises and Cloud segment accounted for the largest market revenue share in 2023
Market Size & Forecast
- Market Opportunities: USD 155.9 million
- Market Future Opportunities: USD 113.1 million
- CAGR from 2024 to 2029 : 7.3%
Market Summary
- The network emulator market is experiencing pronounced expansion, driven by the increasing complexity of digital infrastructures. The rollout of 5G necessitates ultra-reliable low-latency communications and network slicing capabilities, which demand rigorous validation. This complexity is compounded by the enterprise shift to hybrid and multi-cloud architectures, where ensuring consistent application performance across varied network paths is paramount.
- A key trend is the move toward software-defined emulation and Emulation-as-a-Service, which integrates seamlessly into continuous integration/continuous delivery pipelines, enabling developers to perform network performance validation earlier in the lifecycle.
- For example, a global logistics firm can simulate WAN optimization testing and cellular IoT connectivity across continents, using container-based virtualization to verify data integrity verification and congestion control analysis for its tracking platform without deploying physical hardware.
- While this shift democratizes access, the inherent complexity of high-fidelity emulation and the need for specialized skills remain significant considerations for organizations aiming to de-risk technology deployments and ensure operational resilience through effective pre-deployment testing and security posture hardening.
What will be the Size of the Network Emulator Market during the forecast period?
Get Key Insights on Market Forecast (PDF) Get Free Sample
How is the Network Emulator Market Segmented?
The network emulator industry research report provides comprehensive data (region-wise segment analysis), with forecasts and estimates in "USD million" for the period 2025-2029, as well as historical data from 2019-2023 for the following segments.
- Component
- Hardware
- Software
- Services
- Deployment
- On premises
- Cloud
- Application
- SD WAN testing
- 5G networking
- Cloud service providers
- IoT and IIoT
- Others
- Geography
- North America
- US
- Canada
- Mexico
- Europe
- Germany
- UK
- France
- APAC
- China
- Japan
- India
- Middle East and Africa
- Saudi Arabia
- UAE
- South Africa
- South America
- Brazil
- Argentina
- Colombia
- Rest of World (ROW)
- North America
By Component Insights
The hardware segment is estimated to witness significant growth during the forecast period.
The hardware segment provides purpose-built appliances for high-fidelity emulation, which is essential for rigorous network performance validation.
These systems are critical for pre-deployment testing of technologies requiring precise timing and physical layer accuracy, such as high-speed Ethernet fabrics in data centers and vehicle-to-everything communication systems.
Applications in industrial automation and satellite communications rely on hardware-in-the-loop simulations to ensure data integrity verification and end-to-end service verification. For instance, validating time-sensitive networking for remote patient monitoring requires hardware that can guarantee precision time protocol synchronization.
This level of accuracy allows organizations to reduce development cycles, with some achieving a 40% faster time-to-market for complex systems through advanced radio frequency testing before live deployment.
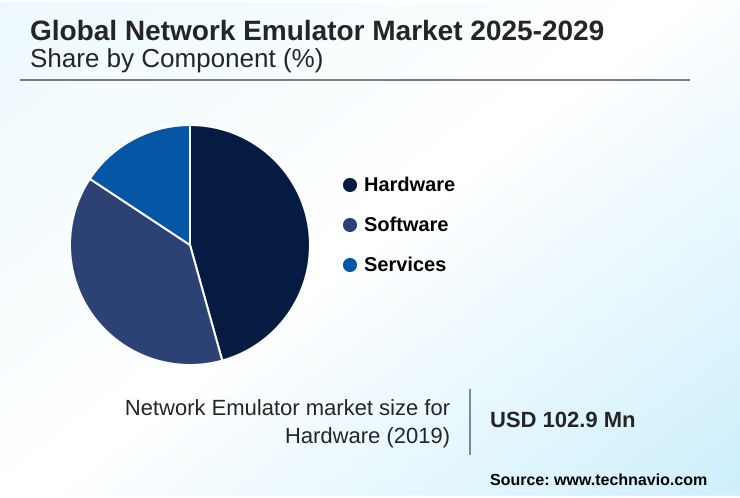
The Hardware segment was valued at USD 113.8 million in 2023 and showed a gradual increase during the forecast period.
Regional Analysis
North America is estimated to contribute 38.9% to the growth of the global market during the forecast period.Technavio’s analysts have elaborately explained the regional trends and drivers that shape the market during the forecast period.
See How Network Emulator Market Demand is Rising in North America Get Free Sample
North America leads the global network emulator market, accounting for over 38% of the opportunity, driven by aggressive 5G core network testing and initiatives targeting ultra-reliable low-latency communications.
Meanwhile, APAC is the fastest-growing region, with its focus on smart factory initiatives and the adoption of massive MIMO and network slicing creating significant demand.
In Europe, the push for Open RAN architectures presents interoperability challenges that require advanced SD-WAN performance benchmarking and network resilience testing. South America is leveraging fixed wireless access to bridge connectivity gaps, prioritizing QoE assessment.
Across these regions, the use of a digital twin for networks to model complex environments, such as 5G non-terrestrial network deployments, is becoming critical. Organizations utilizing these advanced validation techniques report an 18% improvement in service deployment efficiency.
Market Dynamics
Our researchers analyzed the data with 2024 as the base year, along with the key drivers, trends, and challenges. A holistic analysis of drivers will help companies refine their marketing strategies to gain a competitive advantage.
- The network emulator market is evolving to address highly complex, interconnected testing scenarios demanded by next-generation technologies. Validating modern infrastructure now involves emulating 5G network slicing performance while simultaneously testing IoT device scalability under latency and evaluating SD-WAN dynamic path selection algorithms.
- For cloud-centric enterprises, simulating WAN conditions for cloud applications is crucial, as is emulating multi-cloud application performance to prevent service degradation. In the data center, validating AI workload performance on 800GE fabrics has become a critical benchmark.
- The push toward disaggregation requires robust Open RAN interoperability testing methods, while the automotive sector relies on V2X communication latency simulation and hardware-in-the-loop for autonomous driving. The scope extends to specialized areas like satellite network Doppler effect emulation and FWA quality of experience testing.
- Security validation has also become integral, with the use of a cyber range for DDoS attack simulation and validating private 5G network security. Moreover, ensuring quality in communication services involves testing VoIP call quality under jitter.
- Compared to traditional validation methods, integrated emulation platforms that support these diverse scenarios, including protocol conformance for 5G RedCap devices and testing the scalability of containerized network functions, can accelerate product-to-market timelines by more than half.
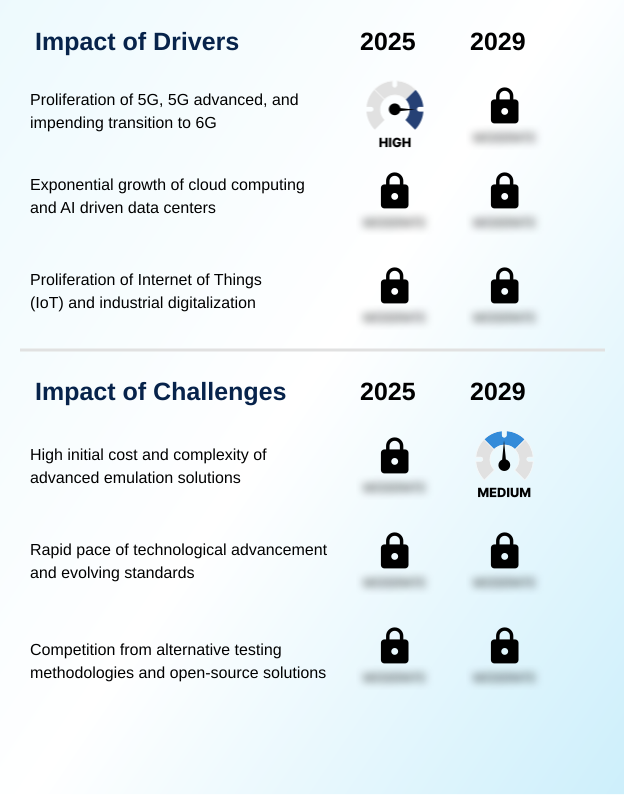
What are the key market drivers leading to the rise in the adoption of Network Emulator Industry?
- The proliferation of 5G, the continuous evolution to 5G-Advanced, and the impending transition to 6G collectively represent a key market driver.
- The exponential growth of cloud computing is a primary market driver, with the adoption of hybrid and multi-cloud architectures demanding sophisticated cloud infrastructure validation.
- The rise of Software-Defined Networking creates intricate network paths requiring robust testing to ensure network fabric performance.
- This is compounded by the surge in AI training workloads, which necessitates extensive AI infrastructure deployment testing to validate the low-latency, high-bandwidth interconnects they depend on.
- Furthermore, the proliferation of IoT devices, from cellular IoT and LoRaWAN to Wi-Fi HaLow, mandates scalable IoT device validation across virtual private cloud environments.
- Simulating these environments helps organizations optimize load balancing simulation and congestion control analysis, with some achieving a 25% reduction in network-related AI model training times.
What are the market trends shaping the Network Emulator Industry?
- The ascendancy of software-defined and cloud-based emulation signifies a pivotal market trend. This evolution toward on-demand services enhances accessibility and integration within agile development workflows.
- A definitive shift toward software-defined emulation and Emulation-as-a-Service is reshaping the market, enabling dynamic test conditions that were previously unachievable. This trend is amplified by the integration of AI to create learning-based digital twins from network telemetry data, moving beyond static network impairment values. This evolution facilitates proactive security posture hardening, as cybersecurity validation becomes a core function.
- Emulation-powered cyber ranges now allow organizations to model complex cyber threat scenarios and refine incident response plans in a controlled environment. Organizations using these advanced methods have seen a 60% improvement in identifying vulnerabilities before production. The ability to simulate MANET simulation scenarios for defense applications further highlights the trend's versatility and importance.
What challenges does the Network Emulator Industry face during its growth?
- The significant initial cost and inherent complexity associated with advanced emulation solutions present a key challenge that affects broader market adoption and industry growth.
- The high cost of high-fidelity solutions remains a significant challenge, as does the rapid pace of technological change that requires constant updates for protocol conformance testing. Competition from open-source tools creates pressure to justify investment in commercial platforms, which offer superior support for network function virtualization and Continuous Integration/Continuous Delivery pipelines.
- Ensuring accurate application performance testing across diverse conditions is complex, often requiring advanced tools for network traffic generation and real-time packet tracking. Validating quality of service prioritization and dynamic path selection in SD-WAN requires sophisticated WAN optimization testing.
- The difficulty in emulating complex scenarios, such as breach and attack simulations or ensuring SIP protocol conformance within container-based virtualization environments using network packet brokers, further complicates validation, with troubleshooting accounting for up to 20% of project timelines.
Exclusive Technavio Analysis on Customer Landscape
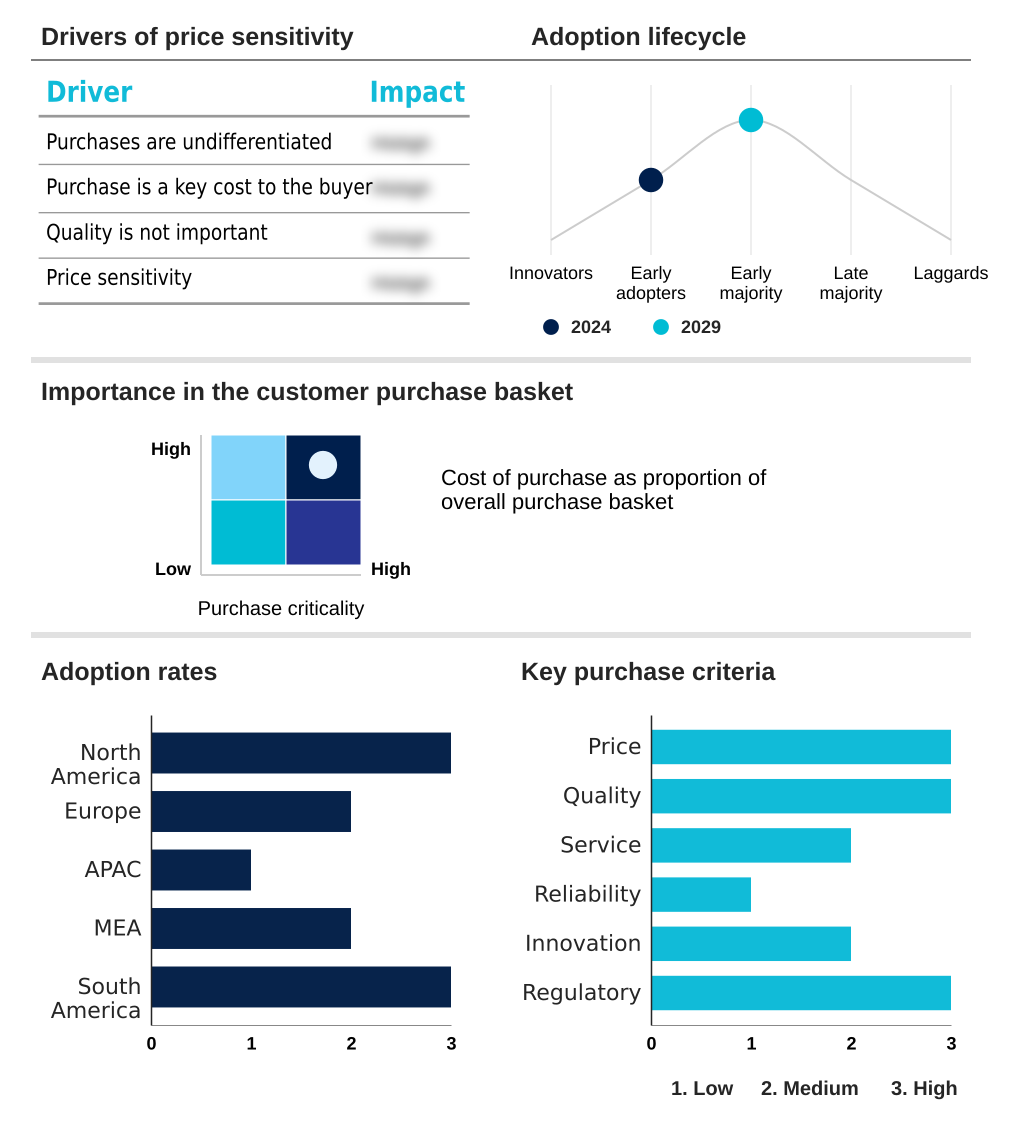
The network emulator market forecasting report includes the adoption lifecycle of the market, covering from the innovator’s stage to the laggard’s stage. It focuses on adoption rates in different regions based on penetration. Furthermore, the network emulator market report also includes key purchase criteria and drivers of price sensitivity to help companies evaluate and develop their market growth analysis strategies.
Customer Landscape of Network Emulator Industry
Competitive Landscape
Companies are implementing various strategies, such as strategic alliances, network emulator market forecast, partnerships, mergers and acquisitions, geographical expansion, and product/service launches, to enhance their presence in the industry.
Anritsu Corp. - Offers testing platforms that validate performance and optimize network reliability, ensuring service quality and robustness in both wired and wireless communication systems.
The industry research and growth report includes detailed analyses of the competitive landscape of the market and information about key companies, including:
- Anritsu Corp.
- Aukua Systems
- Calnex Solutions Ltd.
- Candela Technologies
- Cisco Systems Inc.
- EXFO Inc.
- GigaNet Systems Inc.
- GL Communications Inc.
- Huawei Technologies Co. Ltd.
- InterWorking Labs Inc.
- iTrinegy
- Keysight Technologies Inc.
- Marben Products
- PacketStorm Communications
- Polaris Networks
- Rohde and Schwarz GmbH
- SolarWinds Corp.
- Spirent Communications Plc
- Viavi Solutions Inc.
Qualitative and quantitative analysis of companies has been conducted to help clients understand the wider business environment as well as the strengths and weaknesses of key industry players. Data is qualitatively analyzed to categorize companies as pure play, category-focused, industry-focused, and diversified; it is quantitatively analyzed to categorize companies as dominant, leading, strong, tentative, and weak.
Recent Development and News in Network emulator market
- In October 2024, Keysight Technologies introduced a portable 800GE benchtop system for testing artificial intelligence and data center interconnects, addressing the demand for validating high-speed Ethernet fabrics.
- In December 2024, Spirent Communications announced that a major AI-focused hyperscaler selected its 800G Ethernet testing solutions to ensure optimal performance for AI workloads before deployment.
- In February 2025, Spirent Communications collaborated with the Centre of Excellence in Wireless Technology in India to support the Bharat 6G Vision by enabling 5G core network emulation and accelerating research.
- In April 2025, Spirent Communications introduced the Octobox STA Automation Package, an automated performance testing solution designed to validate client devices on Wi-Fi 6/6E and Wi-Fi 7 networks.
Dive into Technavio’s robust research methodology, blending expert interviews, extensive data synthesis, and validated models for unparalleled Network Emulator Market insights. See full methodology.
| Market Scope | |
|---|---|
| Page number | 302 |
| Base year | 2024 |
| Historic period | 2019-2023 |
| Forecast period | 2025-2029 |
| Growth momentum & CAGR | Accelerate at a CAGR of 7.3% |
| Market growth 2025-2029 | USD 113.1 million |
| Market structure | Fragmented |
| YoY growth 2024-2025(%) | 6.8% |
| Key countries | US, Canada, Mexico, Germany, UK, France, Italy, Spain, The Netherlands, China, Japan, India, South Korea, Australia, Indonesia, Saudi Arabia, UAE, South Africa, Israel, Turkey, Brazil, Argentina and Colombia |
| Competitive landscape | Leading Companies, Market Positioning of Companies, Competitive Strategies, and Industry Risks |
Research Analyst Overview
- The network emulator market's evolution is defined by the convergence of complex technologies, demanding a fundamental shift in validation strategies. The integration of hybrid and multi-cloud architectures with advanced wireless systems, including 5G non-terrestrial network and satellite communications, creates intricate ecosystems.
- Validating performance now requires sophisticated tools capable of simulating everything from massive MIMO and network slicing to precise vehicle-to-everything communication. For board-level consideration, the rise of Emulation-as-a-Service directly impacts budgeting strategy, shifting expenditure from capital to operational models. Firms integrating continuous integration/continuous delivery pipelines with software-defined emulation have reported a 30% reduction in application deployment failures.
- This highlights the move from isolated testing to holistic quality engineering, where emulating dynamic path selection, quality of service prioritization, and SIP protocol conformance becomes standard practice. The need for cybersecurity validation via emulation-powered cyber ranges and breach and attack simulations further underscores the technology’s critical role in modern IT governance.
What are the Key Data Covered in this Network Emulator Market Research and Growth Report?
-
What is the expected growth of the Network Emulator Market between 2025 and 2029?
-
USD 113.1 million, at a CAGR of 7.3%
-
-
What segmentation does the market report cover?
-
The report is segmented by Component (Hardware, Software, and Services), Deployment (On premises and Cloud), Application (SD WAN testing, 5G networking, Cloud service providers, IoT and IIoT, and Others) and Geography (North America, Europe, APAC, Middle East and Africa, South America)
-
-
Which regions are analyzed in the report?
-
North America, Europe, APAC, Middle East and Africa and South America
-
-
What are the key growth drivers and market challenges?
-
Proliferation of 5G, 5G advanced, and impending transition to 6G, High initial cost and complexity of advanced emulation solutions
-
-
Who are the major players in the Network Emulator Market?
-
Anritsu Corp., Aukua Systems, Calnex Solutions Ltd., Candela Technologies, Cisco Systems Inc., EXFO Inc., GigaNet Systems Inc., GL Communications Inc., Huawei Technologies Co. Ltd., InterWorking Labs Inc., iTrinegy, Keysight Technologies Inc., Marben Products, PacketStorm Communications, Polaris Networks, Rohde and Schwarz GmbH, SolarWinds Corp., Spirent Communications Plc and Viavi Solutions Inc.
-
Market Research Insights
- The market is shaped by a strategic push toward proactive validation, where high-fidelity emulation enables organizations to de-risk technology deployments. Adopting pre-deployment testing has proven to reduce post-launch failures by over 30%, directly impacting operational stability. As enterprises navigate interoperability challenges in multi-vendor environments, network performance validation becomes critical for ensuring service level agreements.
- The complexity of IoT device validation and modeling cyber threat scenarios requires scalable and realistic testbeds. Organizations that invest in comprehensive application performance testing methodologies report a 20% improvement in customer satisfaction scores due to enhanced reliability. This focus on verifiable quality and resilience is driving market momentum.
We can help! Our analysts can customize this network emulator market research report to meet your requirements.
 RIA -
RIA - 
