
AI Network Infrastructure Market Size 2026-2030
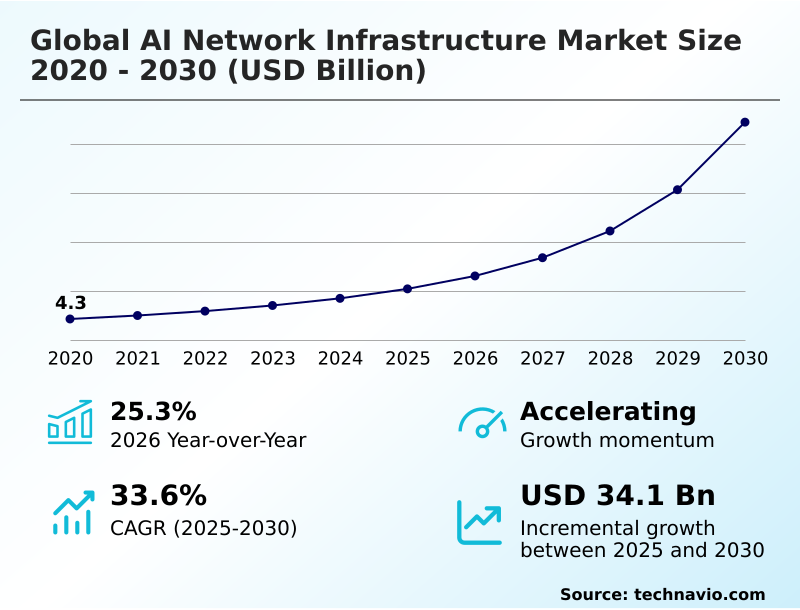
The AI Network Infrastructure Market size was valued at USD 10.46 billion in 2025, growing at a CAGR of 33.6% during the forecast period 2026-2030.
Major Market Trends & Insights
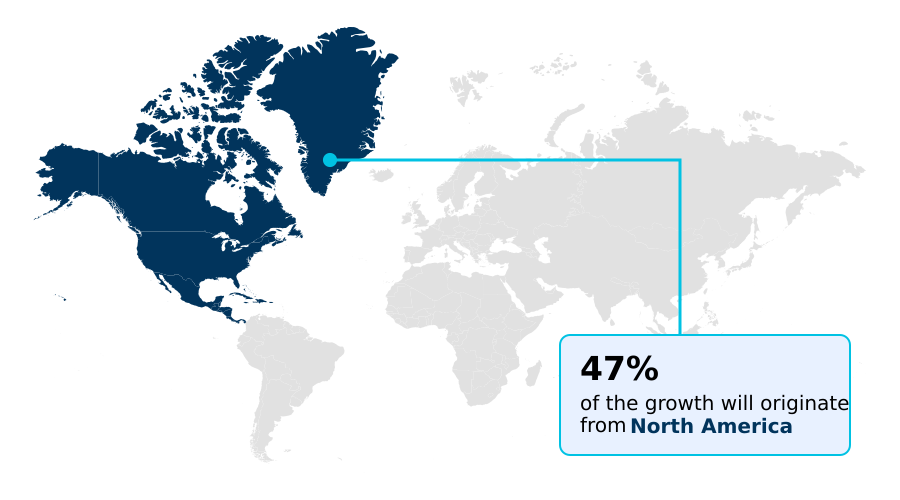
- North America dominated the market and accounted for a 46.8% growth during the forecast period.
- By Component - Hardware segment was valued at USD 5.41 billion in 2024
- By Deployment - Cloud segment accounted for the largest market revenue share in 2024
Market Size & Forecast
- Historic Market Opportunities 2020-2024: USD 40.26 billion
- Market Future Opportunities 2025-2030: USD 34.10 billion
- CAGR from 2025 to 2030 : 33.6%
Market Summary
- The AI network infrastructure market is undergoing an intensive structural reconfiguration, with hardware solutions accounting for over 63% of total market value. Modern high-density GPU clusters now demand over 110 kilowatts of power per rack, a more than sevenfold increase from traditional setups, rendering legacy cooling architectures obsolete.
- For instance, a financial services firm deploying a private AI stack for algorithmic trading requires a low-latency fabric with RDMA capabilities to ensure real-time data processing, a scenario driving investment in advanced interconnects. The primary driver is the proliferation of generative AI and large-scale training clusters, which demand unprecedented bandwidth.
- However, this growth is constrained by the significant challenge of thermal management complexity, where extreme heat dissipation strains power grids and increases operational costs. This dynamic forces enterprises to balance the need for high-performance computing with the practicalities of energy consumption and data center design, making system-level efficiency a critical factor for sustainable scaling.
What will be the Size of the AI Network Infrastructure Market during the forecast period?
Get Key Insights on Market Forecast (PDF) Request Free Sample
How is the AI Network Infrastructure Market Segmented?
The ai network infrastructure industry research report provides comprehensive data (region-wise segment analysis), with forecasts and analysis for the period 2026-2030, as well as historical data from 2020-2024 for the following segments.
- Component
- Hardware
- Software
- Services
- Deployment
- Cloud
- On-premises
- Hybrid
- End-user
- Cloud service providers
- Enterprises
- Government
- Organizations
- Geography
- North America
- US
- Canada
- Mexico
- APAC
- China
- Japan
- South Korea
- Europe
- Germany
- UK
- France
- Middle East and Africa
- Saudi Arabia
- UAE
- Israel
- South America
- Brazil
- Argentina
- Colombia
- Rest of World (ROW)
- North America
How is the AI Network Infrastructure Market Segmented by Component?
The hardware segment is estimated to witness significant growth during the forecast period.
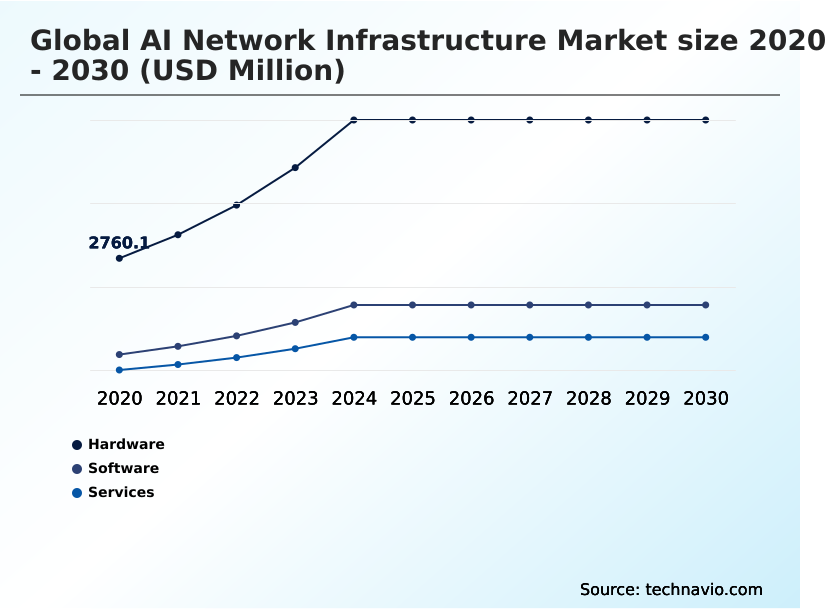
The hardware segment, accounting for over 63% of the total market value, forms the physical backbone of AI network infrastructure, encompassing high-performance switching architectures and advanced optical connectivity solutions.
A rapid transition toward 800G and 1.6T networking speeds is underway to accommodate the massive data throughput required by distributed GPU clusters, with these upgrades delivering up to a 25% improvement in job completion times.
This industrial relevance is driven by hardware innovations in intelligent collective networking and path-based load balancing, which significantly improve network utilization.
The segment is also seeing a surge in demand for data processing units that offload infrastructure tasks, maximizing the computational efficiency of high-bandwidth interconnects and supporting complex AI workloads.
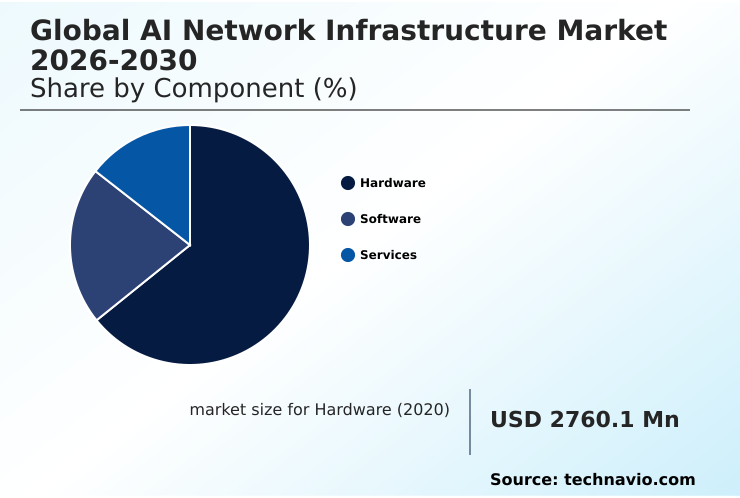
The Hardware segment was valued at USD 5.41 billion in 2024 and showed a gradual increase during the forecast period.
How demand for the AI Network Infrastructure market is rising in the leading region?
North America is estimated to contribute 46.8% to the growth of the global market during the forecast period.Technavio’s analysts have elaborately explained the regional trends and drivers that shape the market during the forecast period.
See How AI Network Infrastructure Market demand is rising in North America Request Free Sample
North America dominates the global AI network infrastructure market, contributing 46.8% of the incremental growth, largely driven by the US, where massive capital expenditure into high-bandwidth interconnects for hyperscale data centers is common.
This region pioneers the use of liquid-cooling systems to manage GPU clusters where thermal densities have increased tenfold.
In contrast, the APAC region, projected to be the fastest-growing with a CAGR of 34.5%, is propelled by sovereign AI infrastructure initiatives in China and India.
These countries are focused on building self-reliant hardware ecosystems and policy-driven edge networking to support domestic digital services.
This strategic divergence creates distinct supply chain dynamics; North America pushes performance with co-packaged optics, while APAC prioritizes scalable manufacturing and localized data control, impacting both technology adoption and operational strategies globally.
What are the key Drivers, Trends, and Challenges in the AI Network Infrastructure Market?
Our researchers analyzed the data with 2025 as the base year, along with the key drivers, trends, and challenges. A holistic analysis of drivers will help companies refine their marketing strategies to gain a competitive advantage.
- As enterprises scale their digital operations, evaluating AI network infrastructure for edge computing becomes critical for enabling real-time decision-making, with localized processing reducing data latency by over 40% in industrial IoT applications.
- The backbone of these advanced systems relies on high-speed interconnects for AI training, where the choice between InfiniBand and Ethernet can impact job completion times for large language models. A crucial consideration is the thermal management for GPU clusters, as inadequate cooling can reduce hardware lifespan by over 25%, directly affecting the total cost of ownership.
- For example, deploying liquid cooling can improve power usage effectiveness by up to 15% compared to traditional air-cooled systems, a significant operational gain. Furthermore, ensuring robust cybersecurity for AI data pipelines is non-negotiable, as data poisoning attacks can compromise model integrity. Integrating zero-trust principles at the network layer is essential for mitigating such risks.
- The unified fabric orchestration benefits, such as simplified management and reduced operational overhead, are compelling for IT teams managing complex, converged environments. This holistic approach, which balances performance, efficiency, and security, is fundamental to building a resilient AI-ready enterprise.
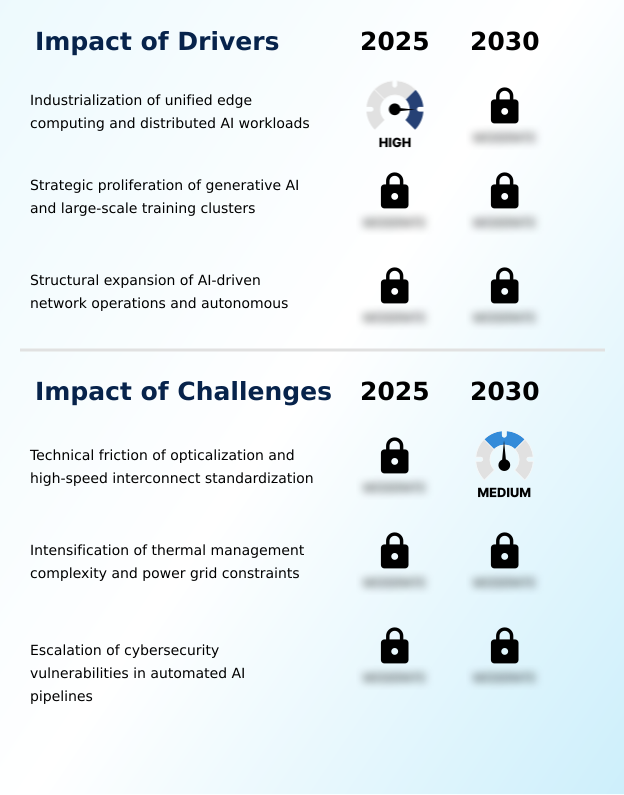
What are the key market drivers leading to the rise in the adoption of AI Network Infrastructure Industry?
- The industrialization of unified edge computing, alongside the strategic expansion of distributed AI workloads, is a primary driver propelling market growth.
- The industrialization of generative AI is a core market driver, fueling massive investments in large-scale training clusters where hardware accounts for over 63% of the total market value.
- This requires high-bandwidth, low-latency fabrics with RDMA capabilities to synchronize thousands of GPUs, preventing data bottlenecks that can stall complex model training.
- Another significant driver is the expansion of unified edge computing, which enables AI inference to be processed locally, reducing latency by over 50% for real-time applications in retail and manufacturing. This decentralized approach enhances data privacy and operational agility.
- Simultaneously, the strategic evolution of AIOps and autonomous management tools is enhancing network reliability, with predictive platforms identifying potential hardware failures days in advance, thereby improving system uptime and security for both enterprise and sovereign-AI deployments.
What are the market trends shaping the AI Network Infrastructure Industry?
- The institutionalization of 1.6-terabit ethernet signifies a major market trend. This is coupled with the increasing integration of silicon photonics to meet rising bandwidth demands.
- A primary trend in the AI network infrastructure market is the adoption of 1.6-terabit Ethernet, with optical module shipments projected to increase eightfold to support the intense bandwidth demands of next-generation GPU clusters.
- This transition to high-speed interconnects, including the use of silicon photonics and co-packaged optics, is critical for reducing data transfer latency in large-scale training by up to 40%. Concurrently, the growth of unified fabric orchestration is simplifying data center management by converging Ethernet and InfiniBand into a single, automated network.
- This allows for the use of open-source protocols like SONiC, increasing operational flexibility. Additionally, the expansion of sovereign AI infrastructure and policy-driven edge networking is becoming standard as nations enforce data residency mandates, requiring localized data processing and control.
What challenges does the AI Network Infrastructure Industry face during its growth?
- A key market challenge stems from the technical friction associated with opticalization and the ongoing need for high-speed interconnect standardization to ensure interoperability.
- A significant challenge confronting the AI network infrastructure market is the management of extreme thermal dissipation, as AI server racks now require over 110 kilowatts, a sevenfold increase that renders traditional air-cooling ineffective. This thermal management complexity strains regional power grid constraints and can delay new data center deployments.
- Another critical issue is the intensification of cybersecurity vulnerabilities; adversarial attacks such as data poisoning can compromise model integrity, while the use of commercial devices for edge AI creates new entry points for side-channel attacks.
- Furthermore, the technical friction in transitioning to optical interconnects, including a lack of high-speed interconnect standardization, leads to hardware interoperability issues that can degrade workload performance by 10-15%, thereby increasing integration costs and hindering market growth.
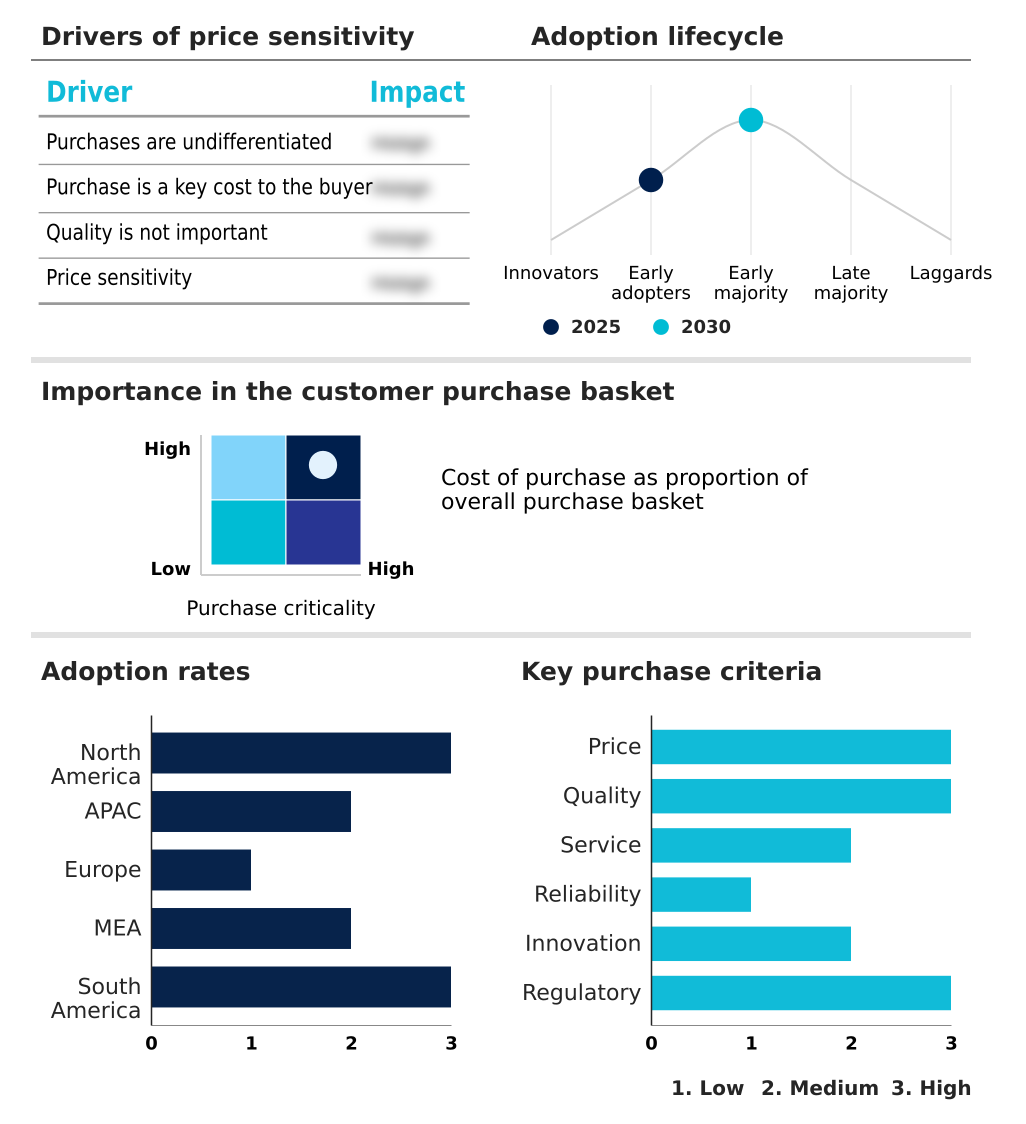
Exclusive Technavio Analysis on Customer Landscape
The ai network infrastructure market forecasting report includes the adoption lifecycle of the market, covering from the innovator’s stage to the laggard’s stage. It focuses on adoption rates in different regions based on penetration. Furthermore, the ai network infrastructure market report also includes key purchase criteria and drivers of price sensitivity to help companies evaluate and develop their market growth analysis strategies.
Customer Landscape of AI Network Infrastructure Industry
Competitive Landscape
Companies are implementing various strategies, such as strategic alliances, ai network infrastructure market forecast, partnerships, mergers and acquisitions, geographical expansion, and product/service launches, to enhance their presence in the industry.
Advanced Micro Devices Inc. - Offerings center on specialized hardware and software, including high-performance processors and cloud infrastructure, engineered to support scalable, enterprise-grade AI workloads and data center optimization.
The industry research and growth report includes detailed analyses of the competitive landscape of the market and information about key companies, including:
- Advanced Micro Devices Inc.
- Alibaba Cloud
- Amazon Web Services Inc.
- Arm Ltd.
- Baidu Inc.
- Cisco Systems Inc.
- Dell Technologies Inc.
- Fujitsu Ltd.
- Google LLC
- Hewlett Packard Enterprise Co.
- Huawei Technologies Co. Ltd.
- IBM Corp.
- Intel Corp.
- Microsoft Corp.
- NEC Corp.
- NVIDIA Corp.
- Samsung Electronics Co. Ltd.
- SK hynix Co. Ltd.
- Tencent Holdings Ltd.
Qualitative and quantitative analysis of companies has been conducted to help clients understand the wider business environment as well as the strengths and weaknesses of key industry players. Data is qualitatively analyzed to categorize companies as pure play, category-focused, industry-focused, and diversified; it is quantitatively analyzed to categorize companies as dominant, leading, strong, tentative, and weak.
Market Intelligence Radar: High-Impact Developments & Growth Signals
- In the Application Software industry, the increasing adoption of cloud-native and subscription-based delivery models, which now account for over 70% of new enterprise software deployments, is creating a need for more elastic and scalable AI network infrastructure to support distributed AI workloads and on-demand compute resources.
- The growing integration of enterprise IoT platforms and real-time data analytics tools is driving demand for policy-driven edge networking and unified edge computing, requiring infrastructure that can handle low-latency data processing for the 30 billion connected devices projected to be in use.
- The proliferation of robotic process automation (RPA) and business process management (BPM) software, which can improve operational efficiency by up to 40%, is intensifying the need for autonomous management tools within network infrastructure to ensure high availability for automated, business-critical workflows.
- Heightened data security concerns and the adoption of enterprise-wide security frameworks are fueling demand for AI network infrastructure with embedded zero-trust architectures and robust protection against cybersecurity vulnerabilities to safeguard sensitive data used in AI models.
Dive into Technavio’s robust research methodology, blending expert interviews, extensive data synthesis, and validated models for unparalleled AI Network Infrastructure Market insights. See full methodology.
| Market Scope | |
|---|---|
| Page number | 305 |
| Base year | 2025 |
| Historic period | 2020-2024 |
| Forecast period | 2026-2030 |
| Growth momentum & CAGR | Accelerate at a CAGR of 33.6% |
| Market growth 2026-2030 | USD 34098.5 million |
| Market structure | Fragmented |
| YoY growth 2025-2026(%) | 25.3% |
| Key countries | US, Canada, Mexico, China, Japan, South Korea, India, Australia, Indonesia, Germany, UK, France, The Netherlands, Spain, Italy, Saudi Arabia, UAE, Israel, South Africa, Turkey, Brazil, Argentina and Colombia |
| Competitive landscape | Leading Companies, Market Positioning of Companies, Competitive Strategies, and Industry Risks |
Research Analyst Overview
- The AI network infrastructure ecosystem functions as a deeply integrated value chain, where hardware solutions represent over 63% of the market. It begins with upstream suppliers providing essential silicon and optical components, which are then utilized by manufacturers to create advanced switching architectures and high-bandwidth interconnects.
- These products are deployed by end-users, primarily cloud service providers and large enterprises, who are building out large-scale training clusters. These end-users, in turn, drive demand for infrastructure that can handle AI workloads generating traffic volumes more than ten times greater than traditional applications.
- Standardization bodies and open-source communities like the Ultra Ethernet Consortium influence the entire ecosystem by defining protocols such as RDMA and SONiC, which ensure interoperability and guide the development of next-generation, energy-efficient GPU clusters.
What are the Key Data Covered in this AI Network Infrastructure Market Research and Growth Report?
-
What is the expected growth of the AI Network Infrastructure Market between 2026 and 2030?
-
The AI Network Infrastructure Market is expected to grow by USD 34.10 billion during 2026-2030, registering a CAGR of 33.6%. Year-over-year growth in 2026 is estimated at 25.3%%. This acceleration is shaped by industrialization of unified edge computing and distributed ai workloads, which is intensifying demand across multiple end-use verticals covered in the report.
-
-
What segmentation does the market report cover?
-
The report is segmented by Component (Hardware, Software, and Services), Deployment (Cloud, On-premises, and Hybrid), End-user (Cloud service providers, Enterprises, Government, and Organizations) and Geography (North America, APAC, Europe, Middle East and Africa, South America). Among these, the Hardware segment is estimated to witness significant growth during the forecast period, driven by rising adoption across key application areas. Each segment includes detailed qualitative and quantitative analysis, along with historical data from 2020-2024 and forecasts through 2030 with year-over-year growth rates.
-
-
Which regions are analyzed in the report?
-
The report covers North America, APAC, Europe, Middle East and Africa and South America. North America is estimated to contribute 46.8% to market growth during the forecast period. Country-level analysis includes US, Canada, Mexico, China, Japan, South Korea, India, Australia, Indonesia, Germany, UK, France, The Netherlands, Spain, Italy, Saudi Arabia, UAE, Israel, South Africa, Turkey, Brazil, Argentina and Colombia, with dedicated market size tables and year-over-year growth for each.
-
-
What are the key growth drivers and market challenges?
-
The primary driver is industrialization of unified edge computing and distributed ai workloads, which is accelerating investment and industry demand. The main challenge is technical friction of opticalization and high-speed interconnect standardization, creating operational barriers for key market participants. The report quantifies the impact of each driver and challenge across 2026 and 2030 with comparative analysis.
-
-
Who are the major players in the AI Network Infrastructure Market?
-
Key vendors include Advanced Micro Devices Inc., Alibaba Cloud, Amazon Web Services Inc., Arm Ltd., Baidu Inc., Cisco Systems Inc., Dell Technologies Inc., Fujitsu Ltd., Google LLC, Hewlett Packard Enterprise Co., Huawei Technologies Co. Ltd., IBM Corp., Intel Corp., Microsoft Corp., NEC Corp., NVIDIA Corp., Samsung Electronics Co. Ltd., SK hynix Co. Ltd. and Tencent Holdings Ltd.. The report provides qualitative and quantitative analysis categorizing companies as dominant, leading, strong, tentative, and weak based on their market positioning. Company profiles include business segment analysis, SWOT assessment, key offerings, and recent strategic developments.
-
Market Research Insights
- The competitive landscape for AI network infrastructure is shaped by intense rivalry, with global cloud infrastructure spending rising by 29% as hyperscalers accelerate investments. Key vendors such as NVIDIA, Cisco, and Hewlett Packard Enterprise are focusing on delivering turnkey AI Factory solutions that integrate high-performance silicon with cloud-native software.
- For instance, recent collaborations aim to provide pre-validated infrastructure packages that can compress deployment timelines from months to just weeks. This development directly addresses enterprise demand for simplified, scalable private AI clouds. However, the market faces a significant challenge from supply chain constraints for advanced semiconductors and optical components.
- In response, leading firms are adapting by developing more modular, interoperable systems and strengthening partnerships to ensure a stable supply of critical hardware for large-scale training clusters.
We can help! Our analysts can customize this ai network infrastructure market research report to meet your requirements.
 RIA -
RIA - 
