Network Security Appliance Market Analysis North America, APAC, Europe, Middle East and Africa, South America - US, UK, China, Germany, Japan - Size and Forecast 2024-2028

Network Security Appliance Market Analysis North America, APAC, Europe, Middle East and Africa, South America - US, UK, China, Germany, Japan - Size and Forecast 2024-2028

Published: Oct 2024 162 Pages SKU: IRTNTR71782

Market Overview at a Glance

$7.95 B
Market Opportunity
8.2%
CAGR
7.4
YoY growth 2023-2024(%)

Network Security Appliance Market Size 2024-2028

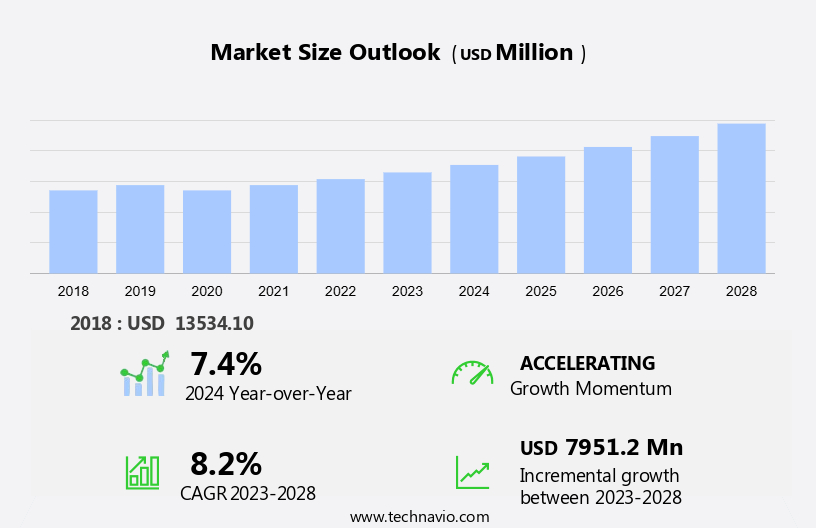
The network security appliance market size is forecast to increase by USD 7.95 billion, at a CAGR of 8.2% between 2023 and 2028. The network security appliance market is experiencing significant growth due to the increasing demand for advanced security solutions. With the rise in cyber threats and data breaches, organizations in various sectors such as healthcare, energy and utilities are investing in intrusion prevention systems and web security to safeguard their network infrastructure. Professional and managed services are also gaining popularity as organizations seek expert assistance in implementing and managing these security solutions. However, the implementation process can pose challenges, including potential failures, which underscores the importance of selecting reliable security companies. Intrusions and cyberattacks continue to be major concerns, necessitating the adoption of comprehensive security measures. Key trends in the market include the integration of advanced technologies such as artificial intelligence and machine learning to enhance threat detection and response capabilities.

Network Security Appliance Market Size

 Request Free Sample

Network security appliances play a crucial role in safeguarding network infrastructure against cyber threats, ensuring data confidentiality, integrity, and availability for various industrial verticals. With the increasing prevalence of cybercrimes, network security has become an essential aspect of IT infrastructure management. Cybersecurity threats, such as intrusions, data breaches, DDoS attacks, ransomware, malware, phishing, and others, pose significant risks to businesses. These threats can lead to financial losses, reputational damage, and regulatory non-compliance. Network security appliances offer advanced security solutions to mitigate these risks and provide visibility analytics for effective security management. Industrial verticals, including telecommunications, healthcare, finance, and retail, rely on strong network security technologies to protect their critical IT infrastructures. Network security appliances provide access controls and intrusion detection systems to prevent unauthorized access and detect potential intrusions. Security management software integrated with network security appliances offers advanced features, such as real-time threat detection, automated response, and reporting capabilities.

Further, these features enable organizations to respond quickly and effectively to cyber threats, reducing the impact of potential data breaches. Network security appliances also offer protection against various types of cyber threats, including phishing attacks, denial of service attacks, and advanced persistent threats. By implementing network security appliances, organizations can strengthen their cybersecurity posture and minimize the risk of cyberattacks. In conclusion, network security appliances are essential for network infrastructure protection in industrial verticals. They offer advanced security solutions to mitigate various cyber threats, provide visibility analytics for effective security management, and enable organizations to respond quickly and effectively to potential security breaches. By investing in network security appliances, organizations can safeguard their critical IT infrastructures and protect against data confidentiality, integrity, and availability risks.

Market Segmentation

The market research report provides comprehensive data (region-wise segment analysis), with forecasts and estimates in "USD billion" for the period 2024-2028, as well as historical data from 2018 - 2022 for the following segments.

  • End-user
    • Telecom and manufacturing
    • Government
    • BFSI
    • Healthcare
    • Others
  • Geography
    • North America
      • US
    • APAC
      • China
      • Japan
    • Europe
      • Germany
      • UK
    • Middle East and Africa
    • South America

By End-user Insights

The telecom and manufacturing segment is estimated to witness significant growth during the forecast period. Telecommunication companies generate vast amounts of data, necessitating the use of network security appliances for effective data management. These appliances, including firewalls and Unified Threat Management (UTM) systems, are crucial for large enterprises and small-medium enterprises (SMEs) in the telecommunications sector. Network security appliances enable data protection and implement cybersecurity measures against cyber threats. Network Management tools integrated into these appliances provide insights into network performance and facilitate risk management tasks. Data protection is a significant concern for telecommunication companies, and network security appliances play a vital role in safeguarding sensitive information.

Network Security Appliance Market Size

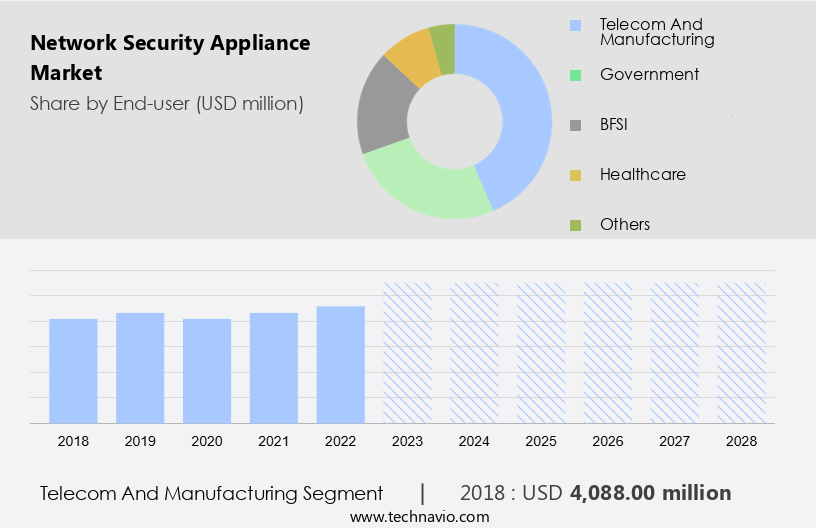
Get a glance at the market share of various segments Download the PDF Sample

The telecom and manufacturing segment was valued at USD 4.09 billion in 2018. The global network security appliance market is expanding, with telecommunication companies being potential buyers due to the need for advanced security solutions. Statistical analysis tools integrated into these appliances help telecommunications companies identify user characteristics and potential targets for cross-selling. Currently, the telecommunications sector utilizes both legacy and advanced analytics to gain insights from their data. Network security appliances with data mining and predictive analytics capabilities are essential for telecommunications companies to improve sales, reduce operational costs, and enhance fraud detection models. In conclusion, network security appliances are indispensable for telecommunication companies to manage their data, protect their networks, and gain valuable insights for business growth. The market is poised for growth, offering advanced solutions to cater to the evolving needs of the telecom sector.

Regional Analysis

Network Security Appliance Market Share by Geography

For more insights on the market share of various regions Download PDF Sample now!

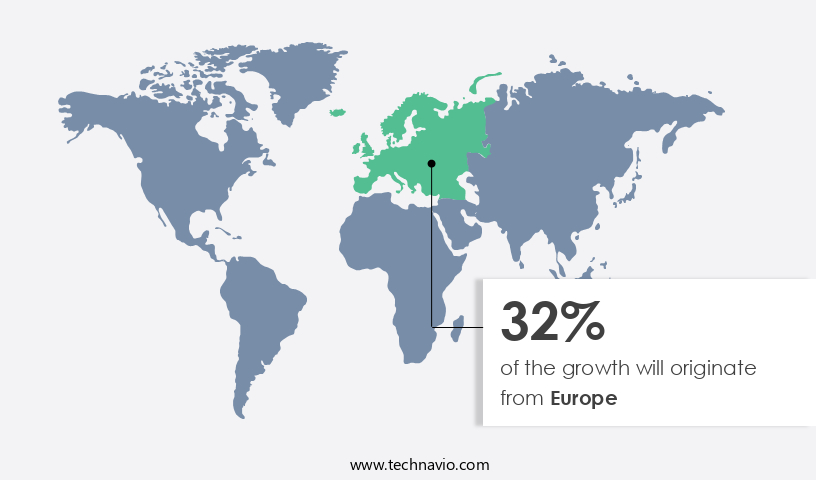
Europe is estimated to contribute 32% to the growth of the global market during the forecast period. Technavio's analysts have elaborately explained the regional trends and drivers that shape the market during the forecast period. Another region offering significant growth opportunities to companies is North America. The North American market is projected to expand significantly over the coming years due to the escalating need for advanced cybersecurity solutions. With the widespread adoption of bring-your-own-device (BYOD) policies and the increasing use of IoT devices, enterprises in the region are becoming more vulnerable to cyber threats, such as ransomware attacks and advanced persistent threats (APTs). In fact, according to recent reports, cybercriminals have targeted major companies like AMD, resulting in substantial data breaches. To mitigate these risks, regulatory bodies and organizations are imposing stringent data security and consumer privacy regulations. As a result, the demand for network security appliances, including firewalls, antivirus software, VPNs, and intrusion prevention systems, is on the rise. Furthermore, the integration of technologies like network automation, SASE, and generative AI into network security appliances is expected to enhance their capabilities and provide better protection against sophisticated cyber threats. In summary, the growing instances of cyberattacks and data breaches, coupled with the increasing adoption of advanced technologies, are driving the growth of the network security appliance market in North America. Organizations are investing heavily in cybersecurity solutions to safeguard their digital assets and maintain regulatory compliance.

Our researchers analyzed the data with 2023 as the base year, along with the key drivers, trends, and challenges. A holistic analysis of drivers will help companies refine their marketing strategies to gain a competitive advantage.

Key Market Driver

The rising demand for enhanced security in network infrastructure is notably driving market growth. In today's business landscape, the escalating number and sophistication of cyber threats necessitate advanced cybersecurity solutions to safeguard critical data and networks. The proliferation of smart devices and Internet of Things (IoT) integration has introduced intricacies, disrupting normal business operations. This challenge is exacerbated by the limited IT expertise and skills of administrators, making it essential for organizations to invest in adequate training or outsource their security responsibilities to network security service providers. Complex cybersecurity solutions, such as deep packet scanning engines and next-generation firewalls, offer strong protection but require a high level of technical proficiency to interpret their outputs effectively.

Consequently, many companies are opting to collaborate with experienced network security service providers, enabling them to leverage skilled professionals focused on security issues and delivering superior protection quality. To mitigate the need for extensive in-house training or recruitment, businesses are partnering with network security service providers. These providers not only possess the necessary expertise but are dedicated to addressing security concerns, ensuring a higher level of protection for their clients. Complex cybersecurity solutions, such as deep packet scanning engines and next-generation firewalls, offer enhanced security features but necessitate a significant level of technical knowledge to interpret their outputs. As a result, companies are turning to network security service providers to capitalize on their skilled professionals' expertise and focus on security issues, ultimately delivering superior protection. Thus, such factors are driving the growth of the market during the forecast period.

Significant Market Trends

The rising incidence of cyberattacks is the key trend in the market. Cybersecurity has become a top priority for businesses in the digital age, as the increasing use of IoT technologies and the growing number of cyber threats pose significant risks to data and financial security. According to recent studies, the number of cyberattacks has been on the rise, with many going undetected for extended periods. This trend is particularly concerning for industries such as healthcare and energy and utilities, which handle sensitive data and critical infrastructure. In response, companies are investing heavily in cybersecurity solutions, including intrusion prevention systems and web security, to protect against cyber threats.

Additionally, professional and managed services are becoming increasingly popular as organizations seek expert guidance and ongoing support to maintain their cybersecurity defenses. Despite these efforts, data breaches and intrusions continue to occur, highlighting the need for advanced and effective security solutions. Companies must stay vigilant and adapt to the evolving cyber landscape to safeguard their assets and mitigate risk. Thus, such trends will shape the growth of the market during the forecast period.

Major Market Challenge

The chances of failure during implementation is the major challenge that affects the growth of the market. Network security appliances play a crucial role in safeguarding network infrastructure protection for businesses and industrial verticals against cybersecurity threats and security breaches. However, the implementation process of these appliances can pose challenges, acting as a growth inhibitor in the market. Prospective clients may prefer traditional security solutions due to concerns over potential failures during implementation. The implementation phase involves intricate processes such as project management, vulnerability management, compliance, content management, event monitoring, access management, and managing connected devices. These tasks require meticulous planning and flawless execution to ensure optimal performance. During the planning phase, decisions must be made regarding the selection of required devices, their placement within the client's architecture, and proper configuration. Cybercrimes continue to pose a significant threat, necessitating the need for strong security measures.

However, visibility analytics and management software are essential components of network security appliances, providing valuable insights to prevent and mitigate cyberattacks. As the IT infrastructure landscape evolves, the importance of network security appliances in securing critical data and maintaining regulatory compliance cannot be overstated. Intrusion detection systems are integral to network security appliances, offering real-time threat detection and response capabilities. By continuously monitoring network traffic, these systems can help prevent unauthorized access and data breaches. The market is expected to grow significantly due to the increasing prevalence of cyberattacks and the need for advanced security solutions. Hence, the above factors will impede the growth of the market during the forecast period.

Exclusive Customer Landscape

The market forecasting report includes the adoption lifecycle of the market, covering from the innovator's stage to the laggard's stage. It focuses on adoption rates in different regions based on penetration. Furthermore, the report also includes key purchase criteria and drivers of price sensitivity to help companies evaluate and develop their market growth analysis strategies.
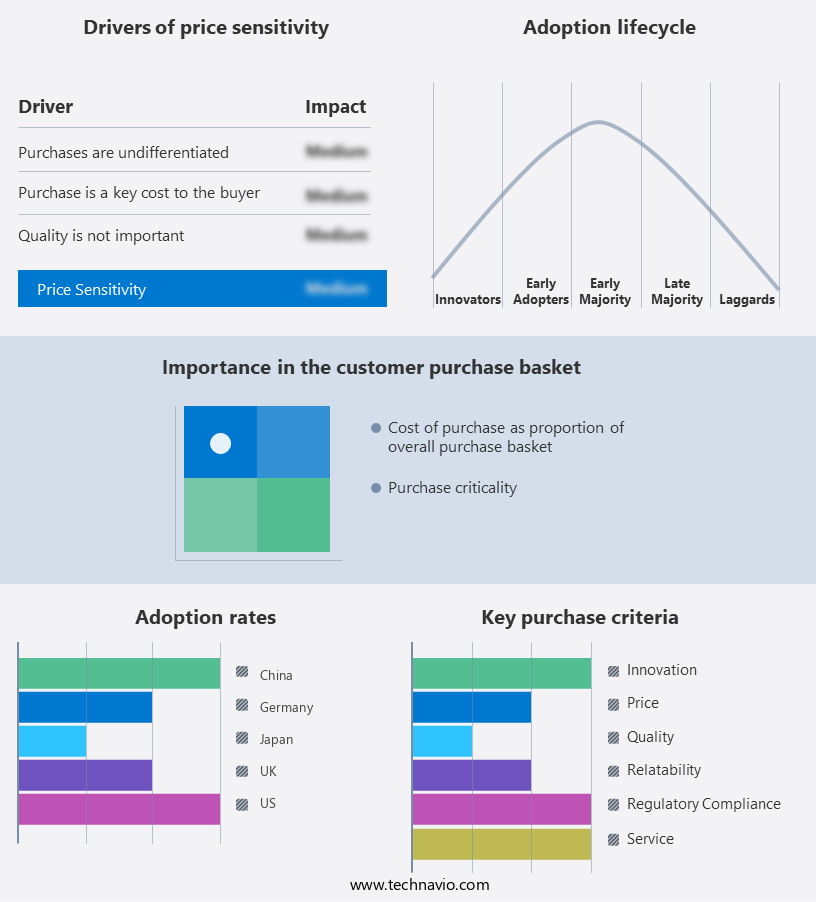
Network Security Appliance Market Share by Geography

 Customer Landscape

Key Companies & Market Insights

Companies are implementing various strategies, such as strategic alliances, partnerships, mergers and acquisitions, geographical expansion, and product/service launches, to enhance their presence in the market.

Broadcom Inc. - The company offers network security appliances such as Symantec Secure Web Gateway.

The market research and growth report also includes detailed analyses of the competitive landscape of the market and information about key companies, including:

  • Barracuda Networks Inc.
  • Broadcom Inc.
  • Check Point Software Technologies Ltd.
  • Cisco Systems Inc.
  • Elliott Investment Management LP
  • F5 Inc.
  • Fortinet Inc.
  • GFI USA Inc.
  • Hanwha Corp.
  • Hewlett Packard Enterprise Co.
  • Honeywell International Inc.
  • Intel Corp.
  • International Business Machines Corp.
  • Juniper Networks Inc.
  • McAfee LLC
  • NetScout Systems Inc.
  • Palo Alto Networks Inc.
  • Qualys Inc.
  • Siemens AG
  • Sophos Ltd.

Qualitative and quantitative analysis of companies has been conducted to help clients understand the wider business environment as well as the strengths and weaknesses of key market players. Data is qualitatively analyzed to categorize companies as pure play, category-focused, industry-focused, and diversified; it is quantitatively analyzed to categorize companies as dominant, leading, strong, tentative, and weak.

Network infrastructure protection is a critical aspect of cybersecurity for businesses and organizations in various industrial verticals. With the increasing number of cybercrimes and data breaches, the demand for advanced security solutions is on the rise. Security management is essential to mitigate intrusions, cyber threats, ransomware, malware, phishing, and other malicious activities. Network security appliances, including intrusion detection systems (IDS) and intrusion prevention systems (IPS), provide visibility analytics and access controls to secure IT infrastructures. IDS and IPS solutions help detect and prevent unauthorized access, while web security solutions protect against phishing attacks and malware. Professional and managed services offer additional support for large enterprises and small-medium enterprises (SMEs) in implementing and managing cybersecurity measures.

In conclusion, industrial verticals such as healthcare, energy and utilities, and telecommunication are prime targets for cybercriminals, making network security technologies a priority. Firewalls, unified threat management, network management, data protection, and zero-trust security solutions are essential network security technologies. Data confidentiality, integrity, and availability are critical components of cybersecurity measures. Cloud deployment and on-premise deployment options cater to different business needs. Network automation, SASE, and advanced persistent threats (APTs) are emerging trends in network security. Generative AI and network security solutions offer enhanced threat detection and response capabilities. Network attacks such as denial of service (DoS) and phishing attacks continue to pose significant risks, making cybersecurity solutions a necessity for businesses.

Market Scope

Report Coverage

Details

Page number

162

Base year

2023

Historic period

2018 - 2022

Forecast period

2024-2028

Growth momentum & CAGR

Accelerate at a CAGR of 8.2%

Market growth 2024-2028

USD 7.95 billion

Market structure

Fragmented

YoY growth 2023-2024(%)

7.4

Regional analysis

North America, APAC, Europe, Middle East and Africa, and South America

Performing market contribution

Europe at 32%

Key countries

US, UK, China, Germany, and Japan

Competitive landscape

Leading Companies, Market Positioning of Companies, Competitive Strategies, and Industry Risks

Key companies profiled

Barracuda Networks Inc., Broadcom Inc., Check Point Software Technologies Ltd., Cisco Systems Inc., Elliott Investment Management LP, F5 Inc., Fortinet Inc., GFI USA Inc., Hanwha Corp., Hewlett Packard Enterprise Co., Honeywell International Inc., Intel Corp., International Business Machines Corp., Juniper Networks Inc., McAfee LLC, NetScout Systems Inc., Palo Alto Networks Inc., Qualys Inc., Siemens AG, and Sophos Ltd.

Market dynamics

Parent market analysis, Market growth inducers and obstacles, Fast-growing and slow-growing segment analysis, COVID-19 impact and recovery analysis and future consumer dynamics, Market condition analysis for the market forecast period.

Customization purview

If our market report has not included the data that you are looking for, you can reach out to our analysts and get segments customized.

Download PDF Sample

What are the Key Data Covered in this Market Research Report?

  • CAGR of the market during the forecast period
  • Detailed information on factors that will drive the market growth and forecasting between 2024 and 2028
  • Precise estimation of the size of the market  and its contribution of the market in focus to the parent market
  • Accurate predictions about upcoming market growth and trends and changes in consumer behaviour
  • Growth of the market across North America, APAC, Europe, Middle East and Africa, and South America
  • Thorough analysis of the market's competitive landscape and detailed information about companies
  • Comprehensive analysis of factors that will challenge the growth of market companies

We can help! Our analysts can customize this market research report to meet your requirements. Get in touch

1 Executive Summary

  • 1.1 Market overview
    • Executive Summary - Chart on Market Overview
    • Executive Summary - Data Table on Market Overview
    • Executive Summary - Chart on Global Market Characteristics
    • Executive Summary - Chart on Market by Geography
    • Executive Summary - Chart on Market Segmentation by End-user
    • Executive Summary - Chart on Incremental Growth
    • Executive Summary - Data Table on Incremental Growth
    • Executive Summary - Chart on Company Market Positioning

2 Market Landscape

  • 2.1 Market ecosystem
    • Parent Market
    • Data Table on - Parent Market
  • 2.2 Market characteristics
    • Market characteristics analysis
  • 2.3 Value chain analysis
    • Value Chain Analysis

3 Market Sizing

  • 3.1 Market definition
    • Offerings of companies included in the market definition
  • 3.2 Market segment analysis
    • Market segments
  • 3.3 Market size 2023
    • 3.4 Market outlook: Forecast for 2023-2028
      • Chart on Global - Market size and forecast 2023-2028 ($ million)
      • Data Table on Global - Market size and forecast 2023-2028 ($ million)
      • Chart on Global Market: Year-over-year growth 2023-2028 (%)
      • Data Table on Global Market: Year-over-year growth 2023-2028 (%)

    4 Historic Market Size

    • 4.1 Global Network Security Appliance Market 2018 - 2022
      • Historic Market Size - Data Table on Global Network Security Appliance Market 2018 - 2022 ($ million)
    • 4.2 End-user segment analysis 2018 - 2022
      • Historic Market Size - End-user Segment 2018 - 2022 ($ million)
    • 4.3 Geography segment analysis 2018 - 2022
      • Historic Market Size - Geography Segment 2018 - 2022 ($ million)
    • 4.4 Country segment analysis 2018 - 2022
      • Historic Market Size - Country Segment 2018 - 2022 ($ million)

    5 Five Forces Analysis

    • 5.1 Five forces summary
      • Five forces analysis - Comparison between 2023 and 2028
    • 5.2 Bargaining power of buyers
      • Bargaining power of buyers - Impact of key factors 2023 and 2028
    • 5.3 Bargaining power of suppliers
      • Bargaining power of suppliers - Impact of key factors in 2023 and 2028
    • 5.4 Threat of new entrants
      • Threat of new entrants - Impact of key factors in 2023 and 2028
    • 5.5 Threat of substitutes
      • Threat of substitutes - Impact of key factors in 2023 and 2028
    • 5.6 Threat of rivalry
      • Threat of rivalry - Impact of key factors in 2023 and 2028
    • 5.7 Market condition
      • Chart on Market condition - Five forces 2023 and 2028

    6 Market Segmentation by End-user

    • 6.1 Market segments
      • Chart on End-user - Market share 2023-2028 (%)
      • Data Table on End-user - Market share 2023-2028 (%)
    • 6.2 Comparison by End-user
      • Chart on Comparison by End-user
      • Data Table on Comparison by End-user
    • 6.3 Telecom and manufacturing - Market size and forecast 2023-2028
      • Chart on Telecom and manufacturing - Market size and forecast 2023-2028 ($ million)
      • Data Table on Telecom and manufacturing - Market size and forecast 2023-2028 ($ million)
      • Chart on Telecom and manufacturing - Year-over-year growth 2023-2028 (%)
      • Data Table on Telecom and manufacturing - Year-over-year growth 2023-2028 (%)
    • 6.4 Government - Market size and forecast 2023-2028
      • Chart on Government - Market size and forecast 2023-2028 ($ million)
      • Data Table on Government - Market size and forecast 2023-2028 ($ million)
      • Chart on Government - Year-over-year growth 2023-2028 (%)
      • Data Table on Government - Year-over-year growth 2023-2028 (%)
    • 6.5 BFSI - Market size and forecast 2023-2028
      • Chart on BFSI - Market size and forecast 2023-2028 ($ million)
      • Data Table on BFSI - Market size and forecast 2023-2028 ($ million)
      • Chart on BFSI - Year-over-year growth 2023-2028 (%)
      • Data Table on BFSI - Year-over-year growth 2023-2028 (%)
    • 6.6 Healthcare - Market size and forecast 2023-2028
      • Chart on Healthcare - Market size and forecast 2023-2028 ($ million)
      • Data Table on Healthcare - Market size and forecast 2023-2028 ($ million)
      • Chart on Healthcare - Year-over-year growth 2023-2028 (%)
      • Data Table on Healthcare - Year-over-year growth 2023-2028 (%)
    • 6.7 Others - Market size and forecast 2023-2028
      • Chart on Others - Market size and forecast 2023-2028 ($ million)
      • Data Table on Others - Market size and forecast 2023-2028 ($ million)
      • Chart on Others - Year-over-year growth 2023-2028 (%)
      • Data Table on Others - Year-over-year growth 2023-2028 (%)
    • 6.8 Market opportunity by End-user
      • Market opportunity by End-user ($ million)
      • Data Table on Market opportunity by End-user ($ million)

    7 Customer Landscape

    • 7.1 Customer landscape overview
      • Analysis of price sensitivity, lifecycle, customer purchase basket, adoption rates, and purchase criteria

    8 Geographic Landscape

    • 8.1 Geographic segmentation
      • Chart on Market share by geography 2023-2028 (%)
      • Data Table on Market share by geography 2023-2028 (%)
    • 8.2 Geographic comparison
      • Chart on Geographic comparison
      • Data Table on Geographic comparison
    • 8.3 North America - Market size and forecast 2023-2028
      • Chart on North America - Market size and forecast 2023-2028 ($ million)
      • Data Table on North America - Market size and forecast 2023-2028 ($ million)
      • Chart on North America - Year-over-year growth 2023-2028 (%)
      • Data Table on North America - Year-over-year growth 2023-2028 (%)
    • 8.4 APAC - Market size and forecast 2023-2028
      • Chart on APAC - Market size and forecast 2023-2028 ($ million)
      • Data Table on APAC - Market size and forecast 2023-2028 ($ million)
      • Chart on APAC - Year-over-year growth 2023-2028 (%)
      • Data Table on APAC - Year-over-year growth 2023-2028 (%)
    • 8.5 Europe - Market size and forecast 2023-2028
      • Chart on Europe - Market size and forecast 2023-2028 ($ million)
      • Data Table on Europe - Market size and forecast 2023-2028 ($ million)
      • Chart on Europe - Year-over-year growth 2023-2028 (%)
      • Data Table on Europe - Year-over-year growth 2023-2028 (%)
    • 8.6 Middle East and Africa - Market size and forecast 2023-2028
      • Chart on Middle East and Africa - Market size and forecast 2023-2028 ($ million)
      • Data Table on Middle East and Africa - Market size and forecast 2023-2028 ($ million)
      • Chart on Middle East and Africa - Year-over-year growth 2023-2028 (%)
      • Data Table on Middle East and Africa - Year-over-year growth 2023-2028 (%)
    • 8.7 South America - Market size and forecast 2023-2028
      • Chart on South America - Market size and forecast 2023-2028 ($ million)
      • Data Table on South America - Market size and forecast 2023-2028 ($ million)
      • Chart on South America - Year-over-year growth 2023-2028 (%)
      • Data Table on South America - Year-over-year growth 2023-2028 (%)
    • 8.8 US - Market size and forecast 2023-2028
      • Chart on US - Market size and forecast 2023-2028 ($ million)
      • Data Table on US - Market size and forecast 2023-2028 ($ million)
      • Chart on US - Year-over-year growth 2023-2028 (%)
      • Data Table on US - Year-over-year growth 2023-2028 (%)
    • 8.9 UK - Market size and forecast 2023-2028
      • Chart on UK - Market size and forecast 2023-2028 ($ million)
      • Data Table on UK - Market size and forecast 2023-2028 ($ million)
      • Chart on UK - Year-over-year growth 2023-2028 (%)
      • Data Table on UK - Year-over-year growth 2023-2028 (%)
    • 8.10 China - Market size and forecast 2023-2028
      • Chart on China - Market size and forecast 2023-2028 ($ million)
      • Data Table on China - Market size and forecast 2023-2028 ($ million)
      • Chart on China - Year-over-year growth 2023-2028 (%)
      • Data Table on China - Year-over-year growth 2023-2028 (%)
    • 8.11 Germany - Market size and forecast 2023-2028
      • Chart on Germany - Market size and forecast 2023-2028 ($ million)
      • Data Table on Germany - Market size and forecast 2023-2028 ($ million)
      • Chart on Germany - Year-over-year growth 2023-2028 (%)
      • Data Table on Germany - Year-over-year growth 2023-2028 (%)
    • 8.12 Japan - Market size and forecast 2023-2028
      • Chart on Japan - Market size and forecast 2023-2028 ($ million)
      • Data Table on Japan - Market size and forecast 2023-2028 ($ million)
      • Chart on Japan - Year-over-year growth 2023-2028 (%)
      • Data Table on Japan - Year-over-year growth 2023-2028 (%)
    • 8.13 Market opportunity by geography
      • Market opportunity by geography ($ million)
      • Data Tables on Market opportunity by geography ($ million)

    9 Drivers, Challenges, and Opportunity/Restraints

    • 9.1 Market drivers
      • 9.2 Market challenges
        • 9.3 Impact of drivers and challenges
          • Impact of drivers and challenges in 2023 and 2028
        • 9.4 Market opportunities/restraints

          10 Competitive Landscape

          • 10.1 Overview
            • 10.2 Competitive Landscape
              • Overview on criticality of inputs and factors of differentiation
            • 10.3 Landscape disruption
              • Overview on factors of disruption
            • 10.4 Industry risks
              • Impact of key risks on business

            11 Competitive Analysis

            • 11.1 Companies profiled
              • Companies covered
            • 11.2 Market positioning of companies
              • Matrix on companies position and classification
            • 11.3 Broadcom Inc.
              • Broadcom Inc. - Overview
              • Broadcom Inc. - Business segments
              • Broadcom Inc. - Key news
              • Broadcom Inc. - Key offerings
              • Broadcom Inc. - Segment focus
            • 11.4 Check Point Software Technologies Ltd.
              • Check Point Software Technologies Ltd. - Overview
              • Check Point Software Technologies Ltd. - Product / Service
              • Check Point Software Technologies Ltd. - Key news
              • Check Point Software Technologies Ltd. - Key offerings
            • 11.5 Cisco Systems Inc.
              • Cisco Systems Inc. - Overview
              • Cisco Systems Inc. - Business segments
              • Cisco Systems Inc. - Key news
              • Cisco Systems Inc. - Key offerings
              • Cisco Systems Inc. - Segment focus
            • 11.6 Fortinet Inc.
              • Fortinet Inc. - Overview
              • Fortinet Inc. - Product / Service
              • Fortinet Inc. - Key news
              • Fortinet Inc. - Key offerings
            • 11.7 Hanwha Corp.
              • Hanwha Corp. - Overview
              • Hanwha Corp. - Product / Service
              • Hanwha Corp. - Key news
              • Hanwha Corp. - Key offerings
            • 11.8 Hewlett Packard Enterprise Co.
              • Hewlett Packard Enterprise Co. - Overview
              • Hewlett Packard Enterprise Co. - Business segments
              • Hewlett Packard Enterprise Co. - Key news
              • Hewlett Packard Enterprise Co. - Key offerings
              • Hewlett Packard Enterprise Co. - Segment focus
            • 11.9 Juniper Networks Inc.
              • Juniper Networks Inc. - Overview
              • Juniper Networks Inc. - Product / Service
              • Juniper Networks Inc. - Key news
              • Juniper Networks Inc. - Key offerings
            • 11.10 McAfee LLC
              • McAfee LLC - Overview
              • McAfee LLC - Product / Service
              • McAfee LLC - Key offerings
            • 11.11 Palo Alto Networks Inc.
              • Palo Alto Networks Inc. - Overview
              • Palo Alto Networks Inc. - Product / Service
              • Palo Alto Networks Inc. - Key news
              • Palo Alto Networks Inc. - Key offerings
            • 11.12 Siemens AG
              • Siemens AG - Overview
              • Siemens AG - Business segments
              • Siemens AG - Key news
              • Siemens AG - Key offerings
              • Siemens AG - Segment focus

            12 Appendix

            • 12.1 Scope of the report
              • 12.2 Inclusions and exclusions checklist
                • Inclusions checklist
                • Exclusions checklist
              • 12.3 Currency conversion rates for US$
                • Currency conversion rates for US$
              • 12.4 Research methodology
                • Research methodology
              • 12.5 Data procurement
                • Information sources
              • 12.6 Data validation
                • Data validation
              • 12.7 Validation techniques employed for market sizing
                • Validation techniques employed for market sizing
              • 12.8 Data synthesis
                • Data synthesis
              • 12.9 360 degree market analysis
                • 360 degree market analysis
              • 12.10 List of abbreviations
                • List of abbreviations

              Research Methodology

              Technavio presents a detailed picture of the market by way of study, synthesis, and summation of data from multiple sources. The analysts have presented the various facets of the market with a particular focus on identifying the key industry influencers. The data thus presented is comprehensive, reliable, and the result of extensive research, both primary and secondary.

              INFORMATION SOURCES

              Primary sources

              • Manufacturers and suppliers
              • Channel partners
              • Industry experts
              • Strategic decision makers

              Secondary sources

              • Industry journals and periodicals
              • Government data
              • Financial reports of key industry players
              • Historical data
              • Press releases

              DATA ANALYSIS

              Data Synthesis

              • Collation of data
              • Estimation of key figures
              • Analysis of derived insights

              Data Validation

              • Triangulation with data models
              • Reference against proprietary databases
              • Corroboration with industry experts

              REPORT WRITING

              Qualitative

              • Market drivers
              • Market challenges
              • Market trends
              • Five forces analysis

              Quantitative

              • Market size and forecast
              • Market segmentation
              • Geographical insights
              • Competitive landscape

              Interested in this report?

              Get your sample now to see our research methodology and insights!

              Download Now

              Frequently Asked Questions

              Network Security Appliance market growth will increase by $ 7951.2 mn during 2024-2028 .

              The Network Security Appliance market is expected to grow at a CAGR of 8.2% during 2024-2028 .

              Network Security Appliance market is segmented by End-user( Telecom and manufacturing, Government, BFSI, Healthcare, Others) Geographic( North America, APAC, Europe, MEA, South America)

              Barracuda Networks Inc., Broadcom Inc., Check Point Software Technologies Ltd., Cisco Systems Inc., Elliott Investment Management LP, F5 Inc., Fortinet Inc., GFI USA Inc., Hanwha Corp., Hewlett Packard Enterprise Co., Honeywell International Inc., Intel Corp., International Business Machines Corp., Juniper Networks Inc., McAfee LLC, NetScout Systems Inc., Palo Alto Networks Inc., Qualys Inc., Siemens AG, Sophos Ltd. are a few of the key vendors in the Network Security Appliance market.

              Europe will register the highest growth rate of 32% among the other regions. Therefore, the Network Security Appliance market in Europe is expected to garner significant business opportunities for the vendors during the forecast period.

              US, UK, China, Germany, Japan

              • Rising demand for enhanced security in network infrastructureThe increasing frequency and complexity of cyberattacks are compelling companies to improve the quality of data protection. Also is the driving factor this market.
              • the rising use of smart and connected devices has resulted in integration complexities is the driving factor this market.
              • which is hampering the organizations day-to-day business processes. This issue gets aggravated due to the low skill levels and IT expertise of administrators. For instance is the driving factor this market.
              • solutions such as deep packet scanning engines and next-generation firewalls have considerably complex outputs. They require a certain amount of technical expertise to understand the output and act accordingly. Thus is the driving factor this market.
              • companies need to train their staff adequately to understand and operate these solutions.However is the driving factor this market.
              • to reduce the investments required to train or recruit staff specifically for this task is the driving factor this market.
              • many companies are outsourcing their security responsibilities to network security service providers is the driving factor this market.
              • which not only have skilled staff but are also focused on security issues and are is the driving factor this market.
              • thus is the driving factor this market.
              • able to provide a better quality of protection. Cybersecurity attacks across the globe have become a major cause of concern. The use of outdated technologies has led to an increase in the number of such attacks. For instance is the driving factor this market.
              • in July 2021 is the driving factor this market.
              • Check Point Softwares mid-year security report revealed a 29% increase in cyberattacks against organizations globally. Therefore is the driving factor this market.
              • network security appliances are used to safeguard the confidential data of organizations. Such data is prone to attacks from malicious software and unauthorized external access is the driving factor this market.
              • further increasing the need for security solutions.Several organizations have taken drastic steps to maintain the secrecy of their data is the driving factor this market.
              • which allows vendors to launch various services for security purposes. For instance is the driving factor this market.
              • in June 2021 is the driving factor this market.
              • Check Point Software Technologies Ltd. expanded the capabilities of its unified cloud-native security platform to deliver application-first workload protection with checkpoints for cloud guard and workload protection. This fully automated cloud workload security solution empowers security teams with tools to automate security across applications is the driving factor this market.
              • Application Programming Interfaces (APIs) is the driving factor this market.
              • and microservices from development to runtime via a single interface. The increasing demand for cloud-based storage is another major reason for the growth of the global network security appliance market.Cloud-based storage requires managed network security solutions is the driving factor this market.
              • both physical and logical security is the driving factor this market.
              • which further enhances the demand for network security tools. For instance is the driving factor this market.
              • International Business Machines Corp. provides security information and event management services to promote a more proactive security posture with insights from cyber threat intelligence since 2011 to present. With the increasing number of data breaches and hacking incidents is the driving factor this market.
              • organizations should take precautions to protect their data. Thus is the driving factor this market.
              • network security appliances protect data against hacking and other internal or external threats. Therefore is the driving factor this market.
              • to support Big Data communication is the driving factor this market.
              • network security appliances are becoming a standard product to enhance the security of the entire enterprise is the driving factor this market.
              • Internet service providers (ISPs) is the driving factor this market.
              • and telecom network architecture. is the driving factor this market.

              The Network Security Appliance market vendors should focus on grabbing business opportunities from the Telecom and manufacturing segment as it accounted for the largest market share in the base year.