
Telecom Services Market Size 2026-2030
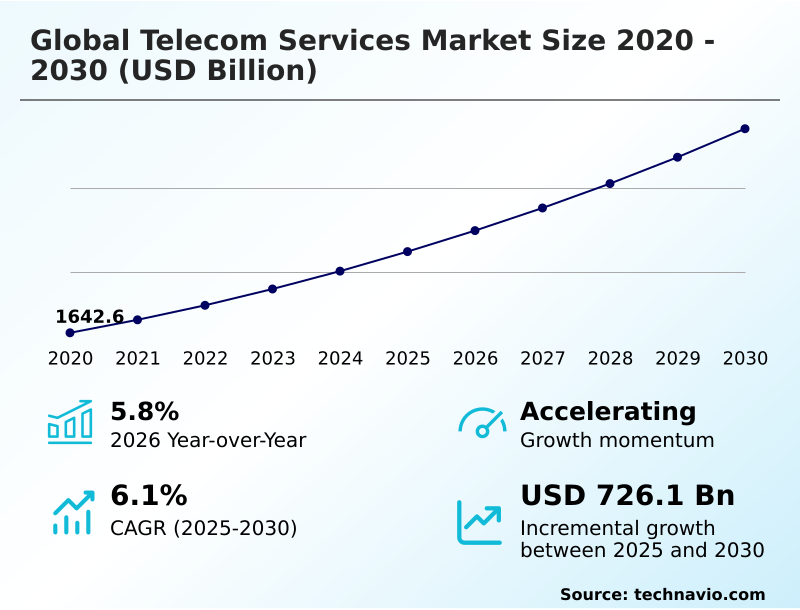
The telecom services market size is valued to increase by USD 726.1 billion, at a CAGR of 6.1% from 2025 to 2030. Proliferation of 5G-advanced and infrastructure modernization will drive the telecom services market.
Major Market Trends & Insights
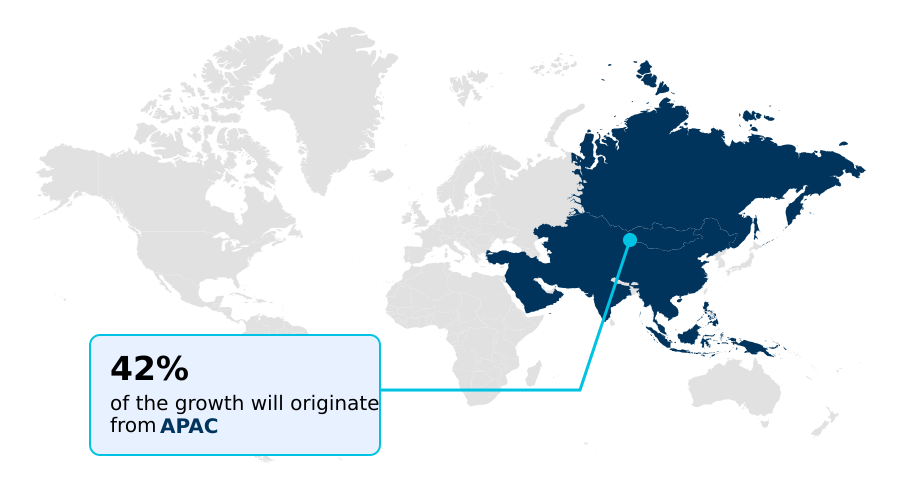
- APAC dominated the market and accounted for a 42.3% growth during the forecast period.
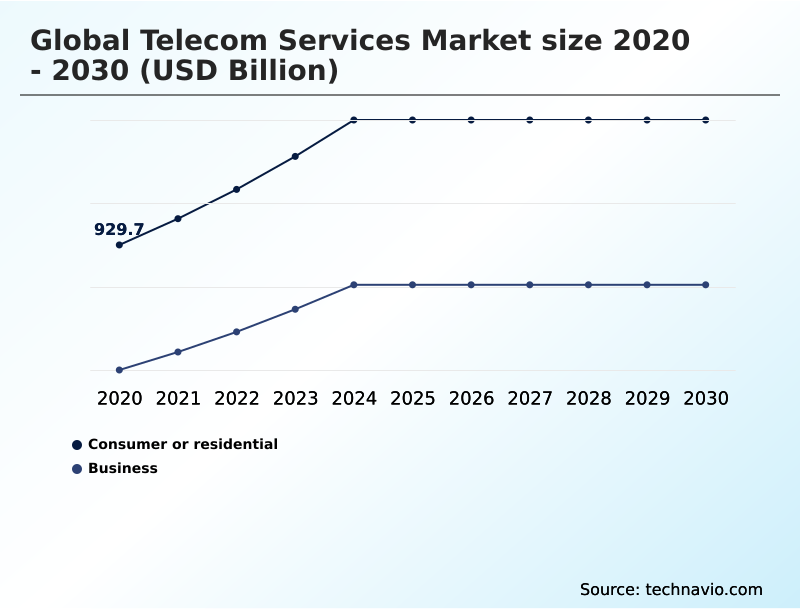
- By End-user - Consumer or residential segment was valued at USD 1146.3 billion in 2024
- By Type - Wireless segment accounted for the largest market revenue share in 2024
Market Size & Forecast
- Market Opportunities: USD 1205.8 billion
- Market Future Opportunities: USD 726.1 billion
- CAGR from 2025 to 2030 : 6.1%
Market Summary
- The Telecom Services Market is undergoing a fundamental transformation, moving from a provider of basic connectivity to an enabler of intelligent digital ecosystems. This shift is driven by the maturation of technologies like 5G standalone architecture and the increasing deployment of fiber-to-the-home (ftth) networks, which provide the necessary bandwidth for data-intensive applications.
- A key trend is the transition toward ai-native autonomous networks, where machine learning algorithms manage network resources, predict faults, and optimize performance in real time. For instance, a logistics company can leverage network slicing to secure a dedicated, ultra-reliable low-latency communication (urllc) channel for its autonomous vehicle fleet, ensuring uninterrupted operation and data transmission.
- This level of service customization is becoming a critical differentiator. However, this evolution is not without challenges. The high capital expenditure required for infrastructure upgrades, coupled with the complexities of digital sovereignty compliance and cybersecurity threats, places significant pressure on operators.
- The need to monetize massive investments through innovative 5g monetization models, such as network-as-a-service (naas), is shaping the competitive landscape.
What will be the Size of the Telecom Services Market during the forecast period?
Get Key Insights on Market Forecast (PDF) Get Free Sample
How is the Telecom Services Market Segmented?
The telecom services industry research report provides comprehensive data (region-wise segment analysis), with forecasts and estimates in "USD billion" for the period 2026-2030, as well as historical data from 2020-2024 for the following segments.
- End-user
- Consumer or residential
- Business
- Type
- Wireless
- Wireline
- Service type
- Mobile data services
- Mobile voice services
- Fixed internet access services
- Pay TV services
- Others
- Geography
- APAC
- India
- China
- Japan
- North America
- US
- Canada
- Mexico
- Europe
- Germany
- UK
- France
- South America
- Brazil
- Argentina
- Colombia
- Middle East and Africa
- Saudi Arabia
- UAE
- South Africa
- Rest of World (ROW)
- APAC
By End-user Insights
The consumer or residential segment is estimated to witness significant growth during the forecast period.
The consumer and residential segment is evolving beyond basic connectivity, driven by advanced architectures like network function virtualization (nfv) and edge computing infrastructure.
Households now function as micro-ecosystems, demanding seamless nfv orchestration and management for a multitude of connected devices, from smart home systems to entertainment platforms.
Service providers are leveraging federated edge computing to deliver low-latency experiences for applications such as cloud gaming and augmented reality, improving responsiveness by over 40%.
This shift necessitates a move toward network-as-a-service (naas) models and programmable network apis, allowing for the dynamic allocation of resources and enabling a new class of personalized, high-value digital services through standardized network api exposure and naas platform integration for enhanced edge computing for real-time analytics.
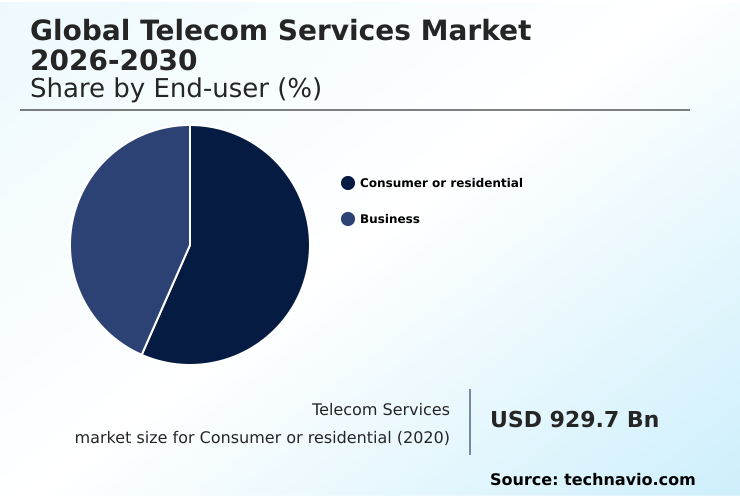
The Consumer or residential segment was valued at USD 1146.3 billion in 2024 and showed a gradual increase during the forecast period.
Regional Analysis
APAC is estimated to contribute 42.3% to the growth of the global market during the forecast period.Technavio’s analysts have elaborately explained the regional trends and drivers that shape the market during the forecast period.
See How Telecom Services Market Demand is Rising in APAC Get Free Sample
Geographic expansion is increasingly focused on achieving ubiquitous coverage through a hybrid approach. While dense urban centers benefit from software-defined networking (sdn) for dynamic bandwidth allocation, remote and underserved regions are being connected via non-terrestrial networks (ntn) and satellite-to-mobile connectivity.
These ntn for remote area coverage initiatives are closing digital divides, with some programs reducing connectivity gaps by up to 90%. The proliferation of massive machine-type communications (mmtc) in smart city deployments is driving demand for robust iot connectivity solutions.
For example, integrated iot device management platforms now support millions of endpoints per square kilometer, a 10x increase from previous generation networks, enabling complex, large-scale applications like city-wide environmental monitoring and autonomous traffic management through direct-to-device satellite communication.
Market Dynamics
Our researchers analyzed the data with 2025 as the base year, along with the key drivers, trends, and challenges. A holistic analysis of drivers will help companies refine their marketing strategies to gain a competitive advantage.
- The future of the global telecom services market 2026-2030 is being shaped by specialized service delivery and intelligent automation. The ability to offer global telecom services market 2026-2030 network slicing for enterprise clients is no longer a novelty but a core requirement, allowing businesses to secure dedicated bandwidth and latency guarantees for critical operations.
- This is directly linked to the rise of global telecom services market 2026-2030 autonomous network management, where AI-driven systems proactively optimize traffic and mitigate faults before they impact service quality. The deployment of global telecom services market 2026-2030 edge computing infrastructure is crucial for reducing latency, a key factor for real-time applications.
- Concurrently, as IoT ecosystems expand, the demand for robust global telecom services market 2026-2030 managed security services for iot has surged to protect billions of vulnerable endpoints from cyber threats. For instance, companies implementing comprehensive security protocols have reported a reduction in breach incidents that is more than double that of their counterparts.
- Ultimately, the industry's profitability hinges on successfully monetizing 5G through programmable APIs, transforming the network into a programmable platform where developers can build and deploy innovative services, creating new revenue streams beyond traditional connectivity.
What are the key market drivers leading to the rise in the adoption of Telecom Services Industry?
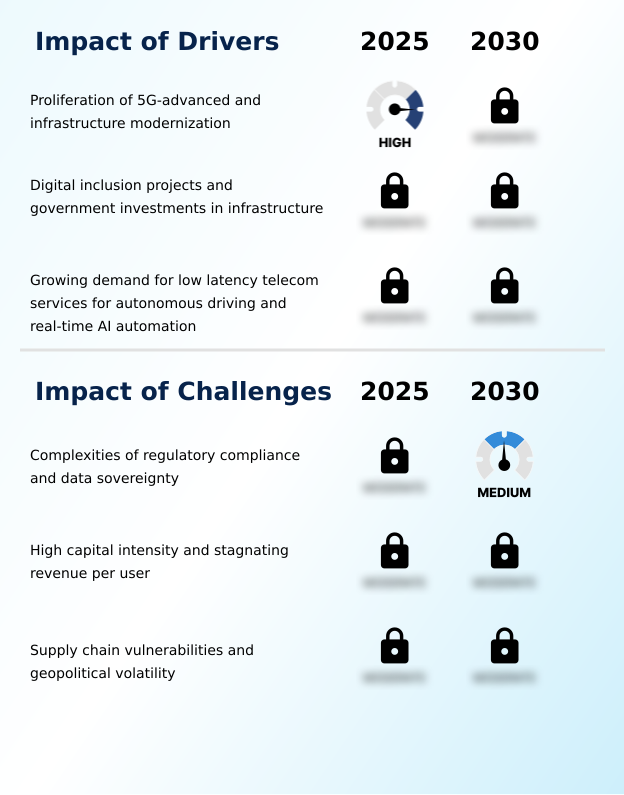
- The proliferation of 5G-Advanced technologies and the comprehensive modernization of network infrastructure are primary drivers of market growth.
- The proliferation of 5g standalone architecture is a primary market driver, unlocking advanced capabilities like network slicing and ultra-reliable low-latency communication (urllc). This infrastructure enables specialized urllc for industrial automation, where latency improvements of up to 90% are being realized.
- The expansion of fiber-to-the-home (ftth) provides essential ftth backhaul capacity planning to support the data-intensive demands of enhanced mobile broadband (embb).
- As a result, operators are exploring new 5g monetization models beyond consumer data, focusing on high-value enterprise network slicing use cases.
- For example, dedicated network slices for immersive media events now deliver a consistent, high-quality experience for thousands of simultaneous users, a task that was previously unachievable on shared networks.
What are the market trends shaping the Telecom Services Industry?
- The industry is undergoing a strategic transition toward AI-native autonomous networks. This shift aims to create self-optimizing systems that enhance operational efficiency and service reliability.
- The strategic pivot to ai-native autonomous networks is reshaping telecom operations, with a focus on creating a zero-touch network environment. This transition leverages a telecom ai agentic solution and generative ai network optimization to manage network complexity. Early deployments using agentic rApp as a service (rApp aaS) have demonstrated a 40% reduction in manual interventions.
- AI-driven contract analysis is streamlining enterprise engagements, while autonomous network maintenance and autonomous network fault detection systems are improving service uptime by over 25%. This shift toward agentic ai for resource optimization allows for dynamic adjustments to network traffic, ensuring quality of service during peak demand and enabling predictive management through generative ai for network traffic prediction.
What challenges does the Telecom Services Industry face during its growth?
- Navigating the complexities of diverse regulatory compliance frameworks and data sovereignty mandates presents a significant challenge to industry growth.
- Navigating complex regulatory landscapes presents a significant market challenge. Adherence to digital sovereignty compliance and data localization regulations requires substantial investment in regional infrastructure, increasing operational costs by an estimated 15-20% for multinational operators. The classification of certain high-risk artificial intelligence systems under new legal frameworks adds another layer of complexity to network management and ai-based fraud detection.
- Furthermore, the industry-wide digital service provider transformation is being carefully managed to ensure robust cybersecurity for telecom networks, with a focus on securing managed security services. Mandates such as telecom commercial communication preference rules require sophisticated technical solutions, while the move toward open radio access network (o-ran) introduces new variables in o-ran component interoperability and security.
Exclusive Technavio Analysis on Customer Landscape
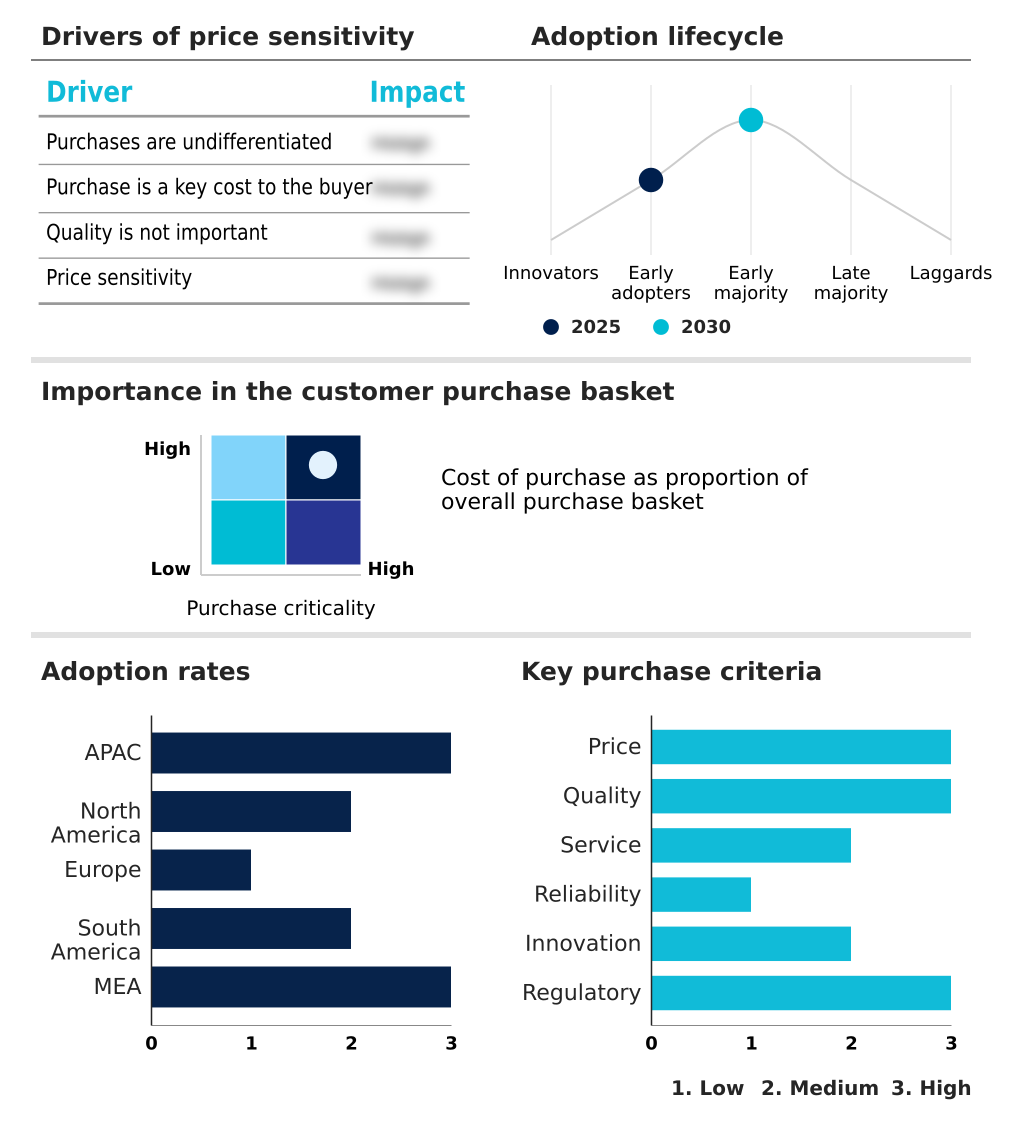
The telecom services market forecasting report includes the adoption lifecycle of the market, covering from the innovator’s stage to the laggard’s stage. It focuses on adoption rates in different regions based on penetration. Furthermore, the telecom services market report also includes key purchase criteria and drivers of price sensitivity to help companies evaluate and develop their market growth analysis strategies.
Customer Landscape of Telecom Services Industry
Competitive Landscape
Companies are implementing various strategies, such as strategic alliances, telecom services market forecast, partnerships, mergers and acquisitions, geographical expansion, and product/service launches, to enhance their presence in the industry.
America Movil SAB de CV - Delivering a comprehensive portfolio of wireless and wireline services, including mobile, broadband, and enterprise communication solutions, built on advanced network infrastructure.
The industry research and growth report includes detailed analyses of the competitive landscape of the market and information about key companies, including:
- America Movil SAB de CV
- AT and T Inc.
- Bharti Airtel Ltd.
- BT Group Plc
- Charter Communications Inc.
- China Telecom Corp. Ltd.
- Comcast Corp.
- Deutsche Telekom AG
- KDDI Corp.
- KT Corp.
- Nippon Telegh and Teleph Corp.
- Orange SA
- Reliance Jio Infocomm Ltd.
- SB Telecom
- Singapore Telecom Ltd.
- SK Telecom Co. Ltd.
- Telefonica SA
- Verizon Communications Inc.
- Vodafone Group Plc
Qualitative and quantitative analysis of companies has been conducted to help clients understand the wider business environment as well as the strengths and weaknesses of key industry players. Data is qualitatively analyzed to categorize companies as pure play, category-focused, industry-focused, and diversified; it is quantitatively analyzed to categorize companies as dominant, leading, strong, tentative, and weak.
Recent Development and News in Telecom services market
- In March, 2025, A major telecom provider announced a telecom AI agentic solution built with NVIDIA AI Enterprise to automate contract management and improve operational efficiency through AI-driven analysis and real-time insights.
- In December, 2024, A leading European operator announced the successful demonstration of a federated edge computing environment, enabling seamless application deployment across multiple national networks for enterprise clients.
- In October, 2024, A major Asian telecom group announced a strategic partnership with a satellite operator to introduce satellite-to-mobile connectivity, aiming to provide 100% geographic coverage by 2028.
- In August, 2024, The Indian government confirmed the nationwide rollout of 5G services, supported by the installation of over 5 million base stations to enhance digital infrastructure.
Dive into Technavio’s robust research methodology, blending expert interviews, extensive data synthesis, and validated models for unparalleled Telecom Services Market insights. See full methodology.
| Market Scope | |
|---|---|
| Page number | 297 |
| Base year | 2025 |
| Historic period | 2020-2024 |
| Forecast period | 2026-2030 |
| Growth momentum & CAGR | Accelerate at a CAGR of 6.1% |
| Market growth 2026-2030 | USD 726.1 billion |
| Market structure | Fragmented |
| YoY growth 2025-2026(%) | 5.8% |
| Key countries | India, China, Japan, South Korea, Australia, Indonesia, US, Canada, Mexico, Germany, UK, France, Italy, Spain, Russia, Brazil, Argentina, Colombia, Saudi Arabia, UAE, South Africa, Turkey and Nigeria |
| Competitive landscape | Leading Companies, Market Positioning of Companies, Competitive Strategies, and Industry Risks |
Research Analyst Overview
- The telecom services market is pivoting from a connectivity provider to an intelligent platform enabler. Core to this shift is the deployment of 5G standalone architecture, which underpins advanced services like network slicing and ultra-reliable low-latency communication (urllc). This is supported by deep fiber-to-the-home (ftth) rollouts.
- A major trend is the move toward ai-native autonomous networks, leveraging technologies like generative AI network optimization and telecom ai agentic solution to create a zero-touch network environment. For boardroom decisions, the adoption of an agentic rApp as a service (raas) is critical, with early adopters reporting a 30% improvement in operational expenditure efficiency.
- The market is also defined by the push for open radio access network (o-ran) to diversify the supply chain and software-defined networking (sdn) for agility. Enhanced mobile broadband (embb) and massive machine-type communications (mmtc) are driving traffic growth, while non-terrestrial networks (ntn) and satellite-to-mobile connectivity are expanding coverage.
- Managing this complexity requires advanced network function virtualization (nfv) and edge computing infrastructure, often delivered through network-as-a-service (naas) models with programmable network apis. This ecosystem is secured by managed security services, while navigating digital sovereignty compliance and telecom commercial communication preference rules, especially regarding high-risk artificial intelligence systems and federated edge computing.
What are the Key Data Covered in this Telecom Services Market Research and Growth Report?
-
What is the expected growth of the Telecom Services Market between 2026 and 2030?
-
USD 726.1 billion, at a CAGR of 6.1%
-
-
What segmentation does the market report cover?
-
The report is segmented by End-user (Consumer or residential, and Business), Type (Wireless, and Wireline), Service Type (Mobile data services, Mobile voice services, Fixed internet access services, Pay TV services, and Others) and Geography (APAC, North America, Europe, South America, Middle East and Africa)
-
-
Which regions are analyzed in the report?
-
APAC, North America, Europe, South America and Middle East and Africa
-
-
What are the key growth drivers and market challenges?
-
Proliferation of 5G-advanced and infrastructure modernization, Complexities of regulatory compliance and data sovereignty
-
-
Who are the major players in the Telecom Services Market?
-
America Movil SAB de CV, AT and T Inc., Bharti Airtel Ltd., BT Group Plc, Charter Communications Inc., China Telecom Corp. Ltd., Comcast Corp., Deutsche Telekom AG, KDDI Corp., KT Corp., Nippon Telegh and Teleph Corp., Orange SA, Reliance Jio Infocomm Ltd., SB Telecom, Singapore Telecom Ltd., SK Telecom Co. Ltd., Telefonica SA, Verizon Communications Inc. and Vodafone Group Plc
-
Market Research Insights
- The market's dynamics are shifting toward intelligent, programmable platforms. The adoption of autonomous network fault detection has reduced network downtime by over 35% in early deployments. Concurrently, the use of agentic AI for resource optimization allows for dynamic reallocation of network capacity, improving efficiency by up to 20% during peak usage.
- This digital service provider transformation is enabling new 5G monetization models that go beyond simple data plans. For instance, enterprise clients are now adopting bespoke network slicing use cases, which provide guaranteed performance for critical applications. This strategic shift is crucial as operators seek to differentiate their offerings and create new value in an increasingly competitive environment.
We can help! Our analysts can customize this telecom services market research report to meet your requirements.
 RIA -
RIA - 
