
Network Switches Market Size 2025-2029
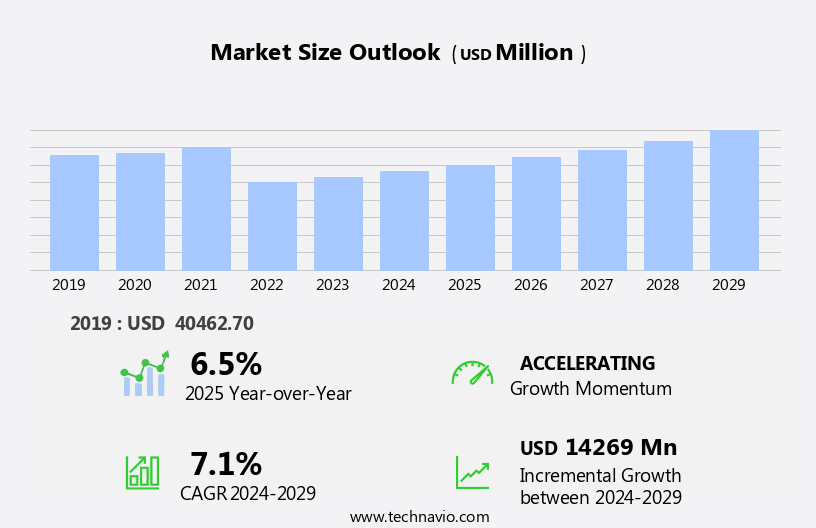
The network switches market size is forecast to increase by USD 14.27 billion at a CAGR of 7.1% between 2024 and 2029.
- The market is experiencing significant growth, driven by the increasing investments in data center construction and the expanding data volumes within enterprises. This trend is fueled by the digital transformation initiatives of businesses, leading to an increased reliance on advanced networking technologies. However, the high operational costs of network switches pose a challenge for market growth. Despite this, opportunities abound for companies that can offer cost-effective, high-performance solutions. Cloud service providers (CSPs), telecommunication companies, financial services, and large enterprises are driving the market's expansion, particularly in the areas of data center networking and cloud computing. The market is also witnessing a shift towards cloud-managed and software-defined networking, enabling greater network agility and efficiency. As businesses continue to generate and process larger volumes of data, the demand for network switches with advanced features, such as high bandwidth, low latency, and security, is expected to increase.
- Companies seeking to capitalize on these opportunities must stay abreast of the latest trends and technologies, while also addressing the cost concerns of their clients. Effective strategic planning and operational efficiency will be key to navigating this dynamic market landscape.
What will be the Size of the Network Switches Market during the forecast period?
- The market in the US is experiencing growth, driven by increasing demand for advanced network infrastructure to support the expanding use of cloud services, IoT devices, and multimedia applications. Network capacity planning, network traffic analysis, and network optimization are key priorities for businesses to ensure seamless connectivity and high network performance. Network segmentation, link aggregation, and switching fabric are essential technologies for enhancing network efficiency and security. Network management protocols, such as RIP and OSPF routing, BGP routing, and DHCP and DNS servers, play a crucial role in network operations.
- Zero-trust security and network performance monitoring are critical components of modern network architectures. Wireless networking, fiber optic, and copper cabling continue to coexist, while edge computing and network monitoring tools facilitate decentralized processing and real-time issue identification. The market size is substantial, with continuous innovation in unicast, multicast, and forwarding table technologies shaping its direction.
How is this Network Switches Industry segmented?
The network switches industry research report provides comprehensive data (region-wise segment analysis), with forecasts and estimates in "USD million" for the period 2025-2029, as well as historical data from 2019-2023 for the following segments.
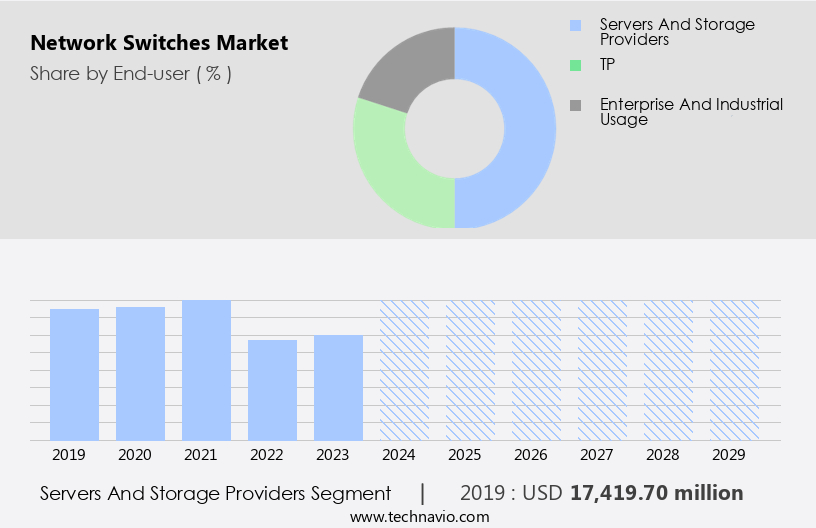
- End-user
- Servers and storage providers
- TP
- Enterprise and industrial usage
- Technology
- 100 GbE
- 10 GbE
- 40 GbE
- 100 MbE and 1 GbE
- Type
- Fixed configuration
- Modular
- Geography
- North America
- US
- Canada
- APAC
- Australia
- China
- India
- Japan
- South Korea
- Europe
- France
- Germany
- UK
- South America
- Middle East and Africa
- North America
By End-user Insights
The servers and storage providers segment is estimated to witness significant growth during the forecast period. The market is driven by the increasing demand for high-speed connectivity and traffic management in data centers. Large enterprises, particularly in the financial services sector, are adopting advanced solutions such as 100 Gigabit switches, cloud-managed switches, and software-defined networking (SDN) for enhancing network performance, energy efficiency, and network security. Machine learning (ML) and artificial intelligence (AI) are also being integrated into network switches for network analytics and automation. Network switches play a crucial role in data center networking by connecting servers and enabling the sharing of resources. The servers and storage providers segment holds the largest market share due to the growing construction of cloud data centers and the transition to higher bandwidth Ethernet switches.
Get a glance at the market report of share of various segments Request Free Sample
The Servers and storage providers segment was valued at USD 17.42 billion in 2019 and showed a gradual increase during the forecast period.
Regional Analysis
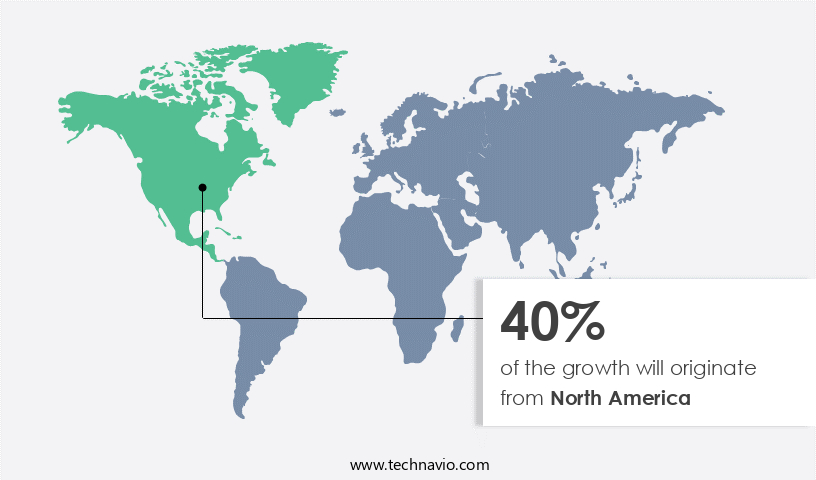
North America is estimated to contribute 40% to the growth of the global market during the forecast period. Technavio's analysts have elaborately explained the regional trends and drivers that shape the market during the forecast period.
For more insights on the market size of various regions, Request Free Sample
The market is experiencing significant growth due to the increasing demand for advanced networking solutions in various sectors. The construction of new data centers and the modernization of existing ones is increasing the need for networking equipment, including 10 Gigabit switches, 100 Gigabit switches, and 40 Gigabit switches. Advancements in technology, such as machine learning (ML), network analytics, network programmability, and software-defined networking (SDN), are enhancing network performance, traffic management, and network security. Overall, the market is expected to continue its growth trajectory due to the increasing demand for reliable, efficient, and secure networking solutions.
Market Dynamics
Our researchers analyzed the data with 2024 as the base year, along with the key drivers, trends, and challenges. A holistic analysis of drivers will help companies refine their marketing strategies to gain a competitive advantage.
What are the key market drivers leading to the rise in the adoption of Network Switches Industry?
- Increasing investments in data center construction is the key driver of the market. Data centers have emerged as essential infrastructure for organizations due to the increasing volume of data generation. The growing trend towards cloud computing is expected to fuel the demand for data centers in the coming years. Several companies are investing in constructing new data centers to meet their expanding data storage requirements. For instance, in April 2025, the U.S. Department of Energy announced plans to evaluate 16 federal sites, including Los Alamos, Sandia, and Oak Ridge National Laboratories, as potential locations for building AI-focused data centers. This investment underscores the significance of data centers in today's digital economy. The market dynamics driving this trend include the exponential growth of data and the shift towards cloud computing. Companies are recognizing the need for reliable and secure data storage solutions to manage their digital assets effectively.
- The construction of new data centers represents a strategic investment in the future of an organization's digital infrastructure. Traffic management, network monitoring, and network segmentation are key considerations for enterprises seeking to optimize network capacity and ensure high availability. Network switches offer various features such as port security, layer 2 and layer 3 switching, network programmability, and PoE support. Energy efficiency, network connectivity, and network analytics are also important factors influencing the market.
What are the market trends shaping the Network Switches Industry?
- Growing data volumes across enterprises is the upcoming market trend. Advanced technologies such as edge computing, artificial intelligence (AI), Internet of Things (IoT), 5G, and machine learning (ML) applications are transforming IT infrastructure across various industries, including manufacturing, retail, logistics, aviation and defense systems, healthcare and life sciences, finance, smart agriculture, and smart infrastructure. The widespread adoption of these technologies has led to an increase in data loads due to expanding customer bases and application bases. To handle these data volumes, higher bandwidth transfers to servers and storage systems are essential. This necessitates the use of more sophisticated network switches. The proliferation of 5G technology, with its faster data transmission rates and ubiquitous Internet access, has significantly boosted numerous industries. As a result, the demand for network switches has grown to manage the increased data traffic efficiently.
- These technologies enable network monitoring, network automation, network segmentation, and network capacity management, among other benefits. Moreover, energy efficiency, port security, and PoE switches are essential features that are gaining popularity in the market. The integration of artificial intelligence (AI) and network analytics is enabling predictive maintenance, fault detection, and network optimization. Network connectivity, high availability, and packet loss mitigation are also critical factors that are influencing the market's growth. Stackable switches, modular switches, and layer 2 and layer 3 switches are some of the popular types of network switches that cater to different networking requirements. Unmanaged switches and managed switches offer flexibility in terms of management and configuration options.
What challenges does the Network Switches Industry face during its growth?
- High operational costs of network switches is a key challenge affecting the industry growth. Network switches play a crucial role in modern networking operations by facilitating the swift transfer of large data volumes with minimal latency. Their applications extend to data-intensive industries such as gaming, video editing, and cryptocurrency mining. However, the high research and development costs associated with network switches contribute to their premium pricing. Factors such as processors, memory, cabling, and connectors add to the overall cost, with prices ranging from USD 100 for small 5-port models to thousands of dollars for larger 24-48 port switches from leading manufacturers. Despite the initial investment, the decreasing cost of technology adoption is making network switches increasingly affordable for businesses.
- The adoption of smart switches and modular and stackable switches is increasing due to their ability to provide advanced network capabilities and scalability. The market is expected to grow significantly due to the increasing demand for high-speed connectivity, advanced network capabilities, and energy efficiency in data centers. The integration of ML and AI, network automation, and SDN are key trends driving the market. Enterprises in various industries, particularly financial services, are investing in network switches to enhance network performance, security, and capacity.
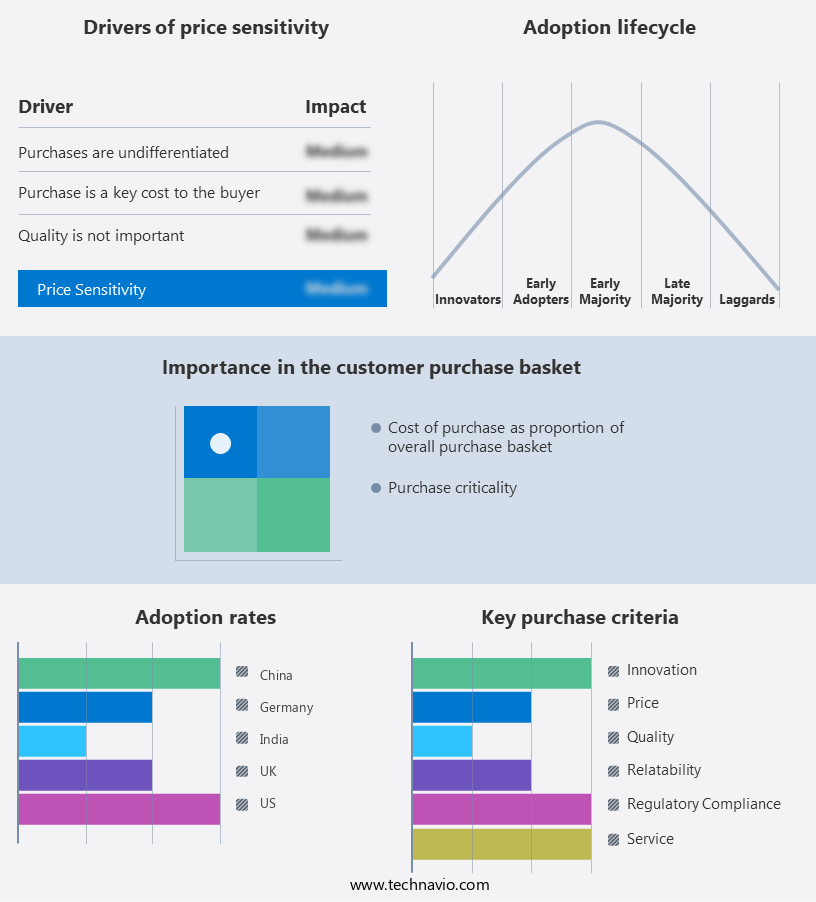
Exclusive Customer Landscape
The network switches market forecasting report includes the adoption lifecycle of the market, covering from the innovator's stage to the laggard's stage. It focuses on adoption rates in different regions based on penetration. Furthermore, the network switches market report also includes key purchase criteria and drivers of price sensitivity to help companies evaluate and develop their market growth analysis strategies.
Customer Landscape
Key Companies & Market Insights
Companies are implementing various strategies, such as strategic alliances, network switches market forecast, partnerships, mergers and acquisitions, geographical expansion, and product/service launches, to enhance their presence in the industry.
ALE International - The company provides a stackable Gigabit Ethernet LAN switch, model 6360 Omni Switch, optimally deployed for workstations, access points, IP telephony, and IoT applications.
The industry research and growth report includes detailed analyses of the competitive landscape of the market and information about key companies, including:
- ALE International
- Allied Telesis Holdings K.K.
- Arista Networks Inc.
- Broadcom Inc.
- Cisco Systems Inc.
- Dell Technologies Inc.
- D Link Corp.
- DrayTek Corp.
- Extreme Networks Inc.
- Fortinet Inc.
- Fujitsu Ltd.
- Hangzhou Hikvision Digital Technology Co. Ltd.
- Hewlett Packard Enterprise Co.
- Huawei Technologies Co. Ltd.
- Juniper Networks Inc.
- NETGEAR Inc.
- Panasonic Holdings Corp.
- PLANET Technology Corp.
- Ruijie Networks Co.
- TP Link Corp. Ltd.
Qualitative and quantitative analysis of companies has been conducted to help clients understand the wider business environment as well as the strengths and weaknesses of key industry players. Data is qualitatively analyzed to categorize companies as pure play, category-focused, industry-focused, and diversified; it is quantitatively analyzed to categorize companies as dominant, leading, strong, tentative, and weak.
Research Analyst Overview
The network switches market is experiencing significant growth as businesses continue to prioritize efficient and reliable data transfer within their networks. With the increasing adoption of cloud computing and the proliferation of connected devices, the demand for high-performance switches is on the rise. One trend gaining traction in the market is the adoption of cloud-managed switches. These switches allow for centralized management of network infrastructure through the cloud, enabling easier configuration, monitoring, and troubleshooting. Machine learning algorithms are also being integrated into network switches to improve traffic management and network analytics, enhancing network performance and security. Network programmability is another key factor driving the growth of the network switch market.
This enables network administrators to automate network configurations and policies, reducing the need for manual intervention and improving network agility. Layer 3 switches are increasingly being used in data center networking to provide advanced routing capabilities and improve network segmentation. Network connectivity and network capacity are critical considerations for large enterprises, particularly in the financial services sector. High availability and redundancy are essential to ensure uninterrupted network performance and prevent packet loss. Energy efficiency is also a significant concern, with many organizations seeking out switches that minimize power consumption and reduce their carbon footprint. Security features are a crucial consideration for network switches, particularly in enterprise networking.
Port security and network segmentation help to prevent unauthorized access and limit the impact of potential security breaches. Network automation and smart switches are also being used to improve network security by enabling faster response times to security threats. The network switch market is diverse, with a range of options available to meet different business needs. Managed switches offer advanced features and centralized management capabilities, while unmanaged switches are cost-effective solutions for smaller networks. Modular and stackable switches provide scalability and high-density connectivity, making them ideal for large enterprise networks. The adoption of artificial intelligence (AI) and software-defined networking (SDN) is set to transform the network switch market in the coming years.
These technologies enable more intelligent and dynamic network management, improving network performance and reducing the need for manual intervention. The network switch market is experiencing significant growth as businesses prioritize efficient and reliable data transfer within their networks. Trends such as cloud-managed switches, machine learning, network programmability, and security features are driving innovation and growth in the market. With a diverse range of options available, organizations can choose the right network switch solution to meet their specific business needs.
|
Market Scope |
|
|
Report Coverage |
Details |
|
Page number |
207 |
|
Base year |
2024 |
|
Historic period |
2019-2023 |
|
Forecast period |
2025-2029 |
|
Growth momentum & CAGR |
Accelerate at a CAGR of 7.1% |
|
Market growth 2025-2029 |
USD 14.27 billion |
|
Market structure |
Fragmented |
|
YoY growth 2024-2025(%) |
6.5 |
|
Key countries |
US, China, Canada, Japan, India, UK, South Korea, Germany, France, and Australia |
|
Competitive landscape |
Leading Companies, Market Positioning of Companies, Competitive Strategies, and Industry Risks |
What are the Key Data Covered in this Network Switches Market Research and Growth Report?
- CAGR of the Network Switches industry during the forecast period
- Detailed information on factors that will drive the growth and forecasting between 2025 and 2029
- Precise estimation of the size of the market and its contribution of the industry in focus to the parent market
- Accurate predictions about upcoming growth and trends and changes in consumer behaviour
- Growth of the market across North America, APAC, Europe, South America, and Middle East and Africa
- Thorough analysis of the market's competitive landscape and detailed information about companies
- Comprehensive analysis of factors that will challenge the network switches market growth of industry companies
We can help! Our analysts can customize this network switches market research report to meet your requirements.
 RIA -
RIA - 
