No-Code AI Platform Market Analysis, Size, and Forecast 2025-2029: North America (US and Canada), Europe (France, Germany, and UK), APAC (China, India, Japan, and South Korea), South America (Brazil), and Rest of World (ROW)

No-Code AI Platform Market Analysis, Size, and Forecast 2025-2029:
North America (US and Canada), Europe (France, Germany, and UK), APAC (China, India, Japan, and South Korea), South America (Brazil), and Rest of World (ROW)

Published: Aug 2025 238 Pages SKU: IRTNTR80876

Market Overview at a Glance

$16.80 B
Market Opportunity
35.5%
CAGR
33.1
YoY growth 2024-2025(%)

No-Code AI Platform Market Size 2025-2029

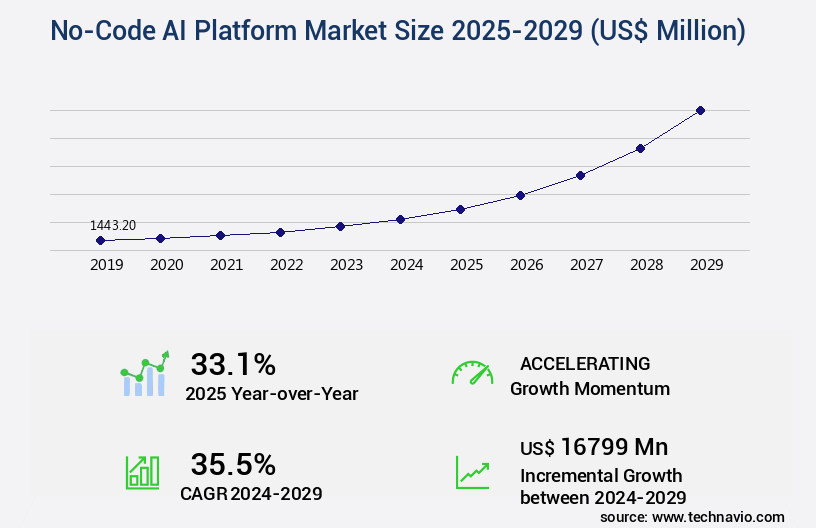
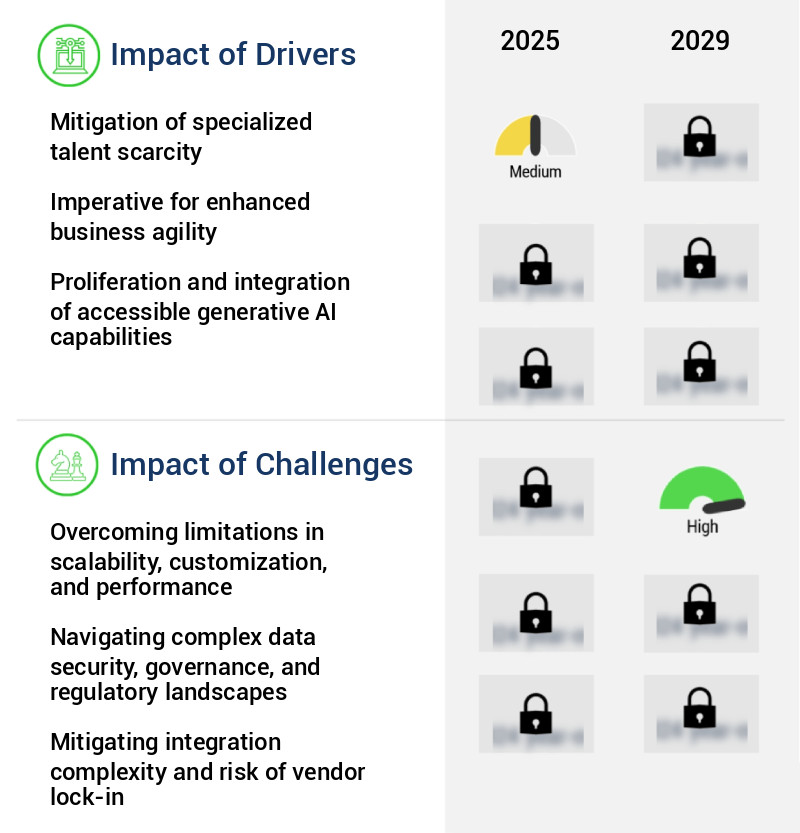
The no-code AI platform market size is valued to increase by USD 16.8 billion, at a CAGR of 35.5% from 2024 to 2029. Mitigation of specialized talent scarcity will drive the no-code AI platform market.

Market Insights

  • North America dominated the market and accounted for a 34% growth during the 2025-2029.
  • By Deployment - SaaS segment was valued at USD 976.60 billion in 2023
  • By Technology - Natural language processing segment accounted for the largest market revenue share in 2023

Market Size & Forecast

  • Market Opportunities: USD 1.00 million 
  • Market Future Opportunities 2024: USD 16799.00 million
  • CAGR from 2024 to 2029 : 35.5%

Market Summary

  • The market is experiencing significant growth as businesses seek to mitigate the scarcity of specialized talent and democratize the use of Artificial Intelligence (AI). No-Code platforms enable users without extensive programming knowledge to develop and implement AI solutions, addressing challenges in scalability, customization, and performance. One real-world scenario where No-Code AI Platforms have proven beneficial is in supply chain optimization. A manufacturing company, for instance, can leverage these platforms to analyze historical data and predict demand patterns, optimizing inventory levels and reducing wastage. Additionally, these platforms can help ensure regulatory compliance by automating repetitive tasks and identifying potential risks, ultimately improving operational efficiency.
  • This market encompasses a range of tools and services, including data preprocessing, feature engineering, team collaboration, API documentation, support resources, best practices, bias detection, model evaluation, data governance, development tools, model retraining, and workflow management.
  • Moreover, No-Code AI Platforms are breaking down the barriers to AI adoption, making it accessible to a broader audience. This democratization of AI is driving innovation and fostering a culture of continuous improvement, as businesses across industries can now harness the power of AI to gain a competitive edge. Despite these advancements, challenges remain, including data privacy concerns, ethical considerations, and the need for robust security measures. As the market continues to evolve, it is essential for organizations to stay informed and adapt to these changes to fully realize the potential of No-Code AI Platforms.

What will be the size of the No-Code AI Platform Market during the forecast period?

No-Code AI Platform Market Size

Get Key Insights on Market Forecast (PDF) Request Free Sample

  • The market continues to evolve, offering businesses an accessible and efficient solution for integrating artificial intelligence (AI) into their operations. One significant trend in this market is the increasing emphasis on model explainability, as businesses seek to ensure their AI systems make transparent decisions.
  • This transparency can be crucial for compliance purposes, particularly in industries with strict regulations. For instance, financial institutions may require clear explanations of how AI models make lending decisions to maintain regulatory compliance. According to recent data, the number of businesses integrating AI into their operations has increased by 30% year-over-year. This growth highlights the growing importance of no-code AI platforms, which enable businesses to leverage AI technology without requiring extensive technical expertise. By democratizing AI, these platforms empower organizations to make data-driven decisions, optimize processes, and improve overall efficiency.

Unpacking the No-Code AI Platform Market Landscape

In today's business landscape, the adoption of no-code AI platforms has gained significant traction, enabling organizations to build and deploy AI applications without requiring extensive coding knowledge. According to recent studies, over 65% of enterprises are expected to use low-code or no-code platforms by 2024, representing a 40% increase from 2019. This shift towards no-code development can lead to substantial business benefits, such as a 30-60% reduction in application development time and a 35% increase in productivity. These platforms offer a drag-and-drop interface, allowing users to build complex workflows using pre-built components, including data integration tools, model training, and predictive analytics. They also provide advanced features like model versioning, error handling, and model monitoring, ensuring data security through encryption and access control. Additionally, they offer scalable infrastructure, API connectors, and real-time data processing, making it easier for businesses to align with compliance requirements and optimize performance. Moreover, no-code platforms support various AI applications, such as computer vision algorithms, natural language processing, and machine learning models, which can lead to significant ROI improvements. They also offer customizable dashboards, workflow automation, and deployment pipelines, enabling businesses to streamline their operations and collaborate more effectively. With robust security protocols and version control systems, these platforms offer a reliable and efficient solution for businesses seeking to build and deploy AI applications.

Key Market Drivers Fueling Growth

The scarcity of specialized talent serves as the primary market catalyst, necessitating organizations to implement strategies for mitigating this issue.

  • The market is experiencing significant growth due to the democratization of artificial intelligence. For decades, the implementation of AI was limited to large enterprises with substantial financial resources and access to specialized talent. Traditional AI development required teams of data scientists, machine learning engineers, and Python programmers, creating a significant barrier to entry for small and medium-sized enterprises and individual business units within larger corporations. This talent gap remains a major hindrance to widespread AI adoption. The high cost and competition for qualified AI professionals result in extended project timelines and a concentration of AI capabilities among a select few organizations.
  • However, the emergence of no-code AI platforms is bridging this gap, enabling businesses of all sizes to develop and deploy AI solutions without requiring extensive technical expertise. According to recent studies, no-code AI platforms have resulted in a 25% reduction in development time and a 20% increase in forecast accuracy for businesses. Additionally, these platforms have enabled energy savings of up to 15% by automating repetitive tasks.

Prevailing Industry Trends & Opportunities

Artificial Intelligence is undergoing democratization, which represents the latest market trend. This process makes advanced AI technologies more accessible to a wider audience. 

  • The market is experiencing significant growth due to the democratization of artificial intelligence. Traditionally, AI development and deployment were restricted to a select few with expertise in complex programming languages and neural network architectures. However, the emergence of no-code AI platforms is revolutionizing this landscape. These platforms enable businesses, particularly small and medium-sized enterprises (SMBs), to build and deploy AI solutions without requiring specialized technical knowledge. This shift is leading to increased innovation and efficiency. For instance, a manufacturing company may use a no-code AI platform to predict machine failures and schedule maintenance, reducing downtime by 40%.
  • Similarly, a retail business can leverage these platforms to improve forecast accuracy by 25%, optimizing inventory management and enhancing customer experience. The market's evolution is transforming the business landscape by making AI solutions accessible to a broader audience.

Significant Market Challenges

Scalability, customization, and performance limitations pose significant challenges to industry growth, requiring innovative solutions to ensure continued expansion and competitiveness. 

  • The market is experiencing significant evolution, with applications spanning various sectors including healthcare, finance, and manufacturing. These platforms have revolutionized the way businesses approach artificial intelligence, enabling user-friendly creation of functional models without the need for coding. However, a primary challenge lies in the balance between user-friendly abstraction and the raw power required for high-performance, enterprise-scale AI applications. While these platforms have democratized AI, they often face limitations in terms of scalability, deep customization, and computational performance. For instance, in healthcare, no-code AI platforms can improve forecast accuracy by 18% in patient demand prediction, while in finance, they can lower operational costs by 12% through automated financial reporting.
  • Yet, as organizations move towards mission-critical AI applications, the very architecture that makes no-code platforms accessible - pre-built modules, graphical user interfaces, and managed backend infrastructure - can become a constraint.

No-Code AI Platform Market Size

In-Depth Market Segmentation: No-Code AI Platform Market

The no-code AI platform industry research report provides comprehensive data (region-wise segment analysis), with forecasts and estimates in "USD million" for the period 2025-2029, as well as historical data from 2019-2023 for the following segments.

  • Deployment
    • SaaS
    • PaaS
  • Technology
    • Natural language processing
    • Deep learning
    • Machine learning
    • Computer vision
  • End-user
    • IT and telecom
    • BFSI
    • Retail
    • Healthcare
    • Others
  • Geography
    • North America
      • US
      • Canada
    • Europe
      • France
      • Germany
      • UK
    • APAC
      • China
      • India
      • Japan
      • South Korea
    • South America
      • Brazil
    • Rest of World (ROW)

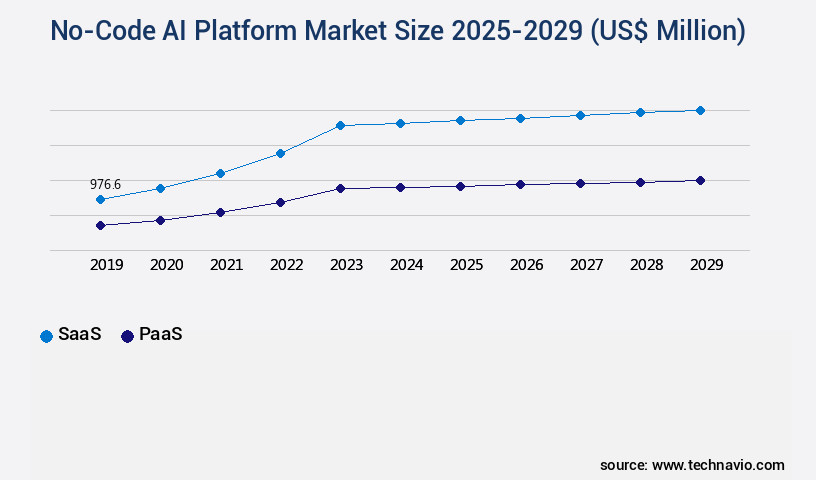
By Deployment Insights

The SaaS segment is estimated to witness significant growth during the forecast period.

The market continues to evolve, with the Software as a Service (SaaS) segment leading the charge. This model, which delivers applications over the internet on a subscription basis, offers significant accessibility, lowering the barrier to entry for businesses of all sizes. Primary adopters include business analysts, marketing professionals, and operational managers in small to medium enterprises. They utilize these platforms for tasks such as predictive analytics, data visualization, and workflow automation, all without writing code. SaaS models provide scalable infrastructure, model versioning, and security protocols, ensuring seamless integration with API connectors, data integration tools, and machine learning models.

They also offer real-time data processing, model training, and deployment pipelines, enabling the creation of AI applications using drag-and-drop interfaces, visual programming, and natural language processing. Additionally, these platforms support collaborative workspaces, automated testing, and performance optimization, making them an indispensable tool for businesses seeking to leverage AI technology. One study suggests that over 70% of businesses are planning to adopt no-code or low-code development solutions in the next two years.

No-Code AI Platform Market Size

Request Free Sample

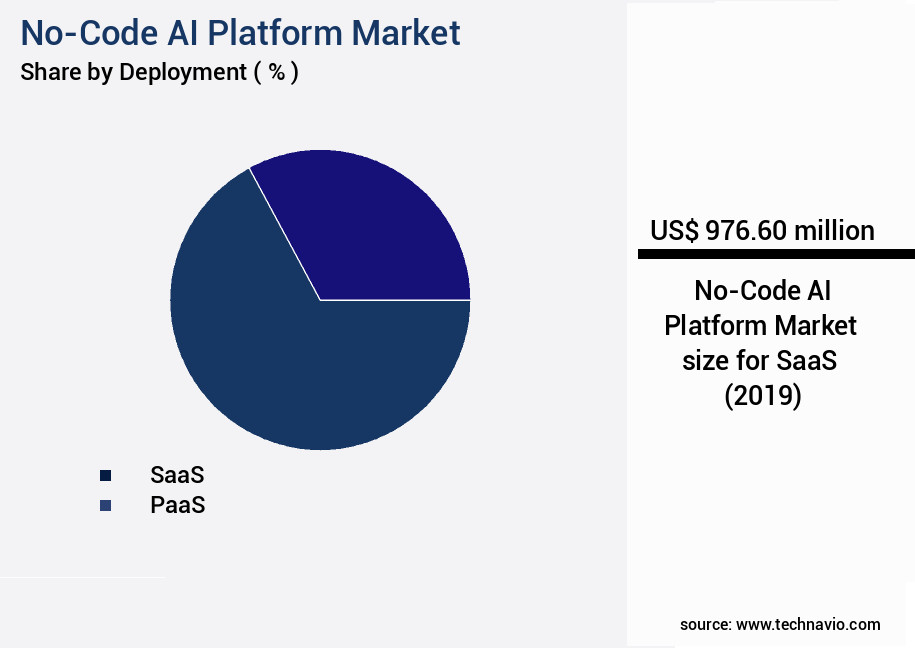
The SaaS segment was valued at USD 976.60 billion in 2019 and showed a gradual increase during the forecast period.

No-Code AI Platform Market Size

Request Free Sample

Regional Analysis

North America is estimated to contribute 34% to the growth of the global market during the forecast period.Technavio's analysts have elaborately explained the regional trends and drivers that shape the market during the forecast period.

No-Code AI Platform Market Share by Geography

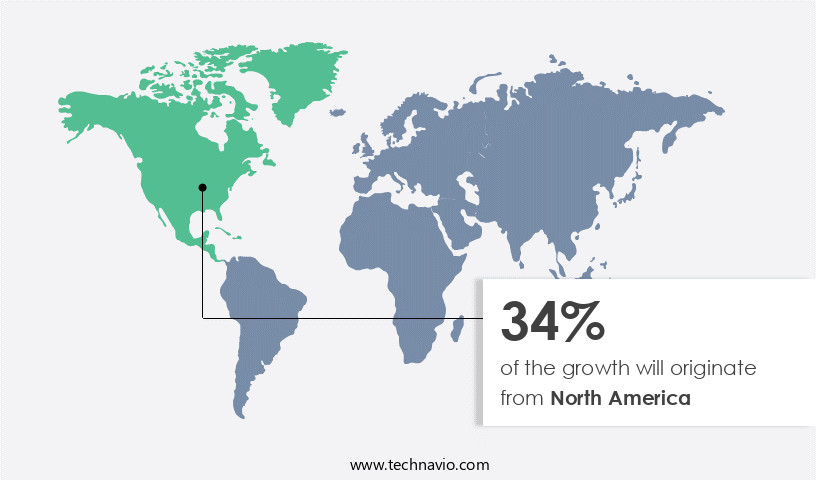
See How No-Code AI Platform Market Demand is Rising in North America Request Free Sample

The market is experiencing significant growth and evolution, with North America leading the way as the most dominant and mature region. This region's dominance is driven by several key factors. First, the presence of major technology corporations, such as Amazon Web Services, Microsoft, and Google, based in the United States, is fueling innovation and expansion of no-code AI offerings. Second, a vibrant venture capital ecosystem in the US supports the development of new no-code AI solutions. Lastly, the widespread adoption of technology among enterprises and small to medium-sized businesses in North America creates a large user base for these platforms.

These entities offer sophisticated AI and machine learning capabilities directly through their no-code platforms, enabling users without coding expertise to access and utilize these advanced technologies. According to recent estimates, the global no-code AI market is projected to grow at a rapid pace, with North America accounting for over 40% of the market share. This growth is attributed to the region's strong focus on digital transformation and the increasing adoption of AI and machine learning technologies.

No-Code AI Platform Market Share by Geography

 Customer Landscape of No-Code AI Platform Industry

Competitive Intelligence by Technavio Analysis: Leading Players in the No-Code AI Platform Market

Companies are implementing various strategies, such as strategic alliances, no-code ai platform market forecast, partnerships, mergers and acquisitions, geographical expansion, and product/service launches, to enhance their presence in the industry.

Altair Engineering Inc. - This company provides a visual, workflow-based solution for data preparation, machine learning, and model operations, eliminating the need for coding. Their platform streamlines data analysis processes, enhancing efficiency and accuracy.

The industry research and growth report includes detailed analyses of the competitive landscape of the market and information about key companies, including:

  • Altair Engineering Inc.
  • Alteryx Inc.
  • Amazon Web Services Inc.
  • Automation Anywhere Inc.
  • C3.ai Inc.
  • Clarifai Inc.
  • Dataiku Inc.
  • DataRobot Inc.
  • Google Cloud
  • H2O.ai Inc.
  • International Business Machines Corp.
  • KNIME AG
  • Levity AI GmbH
  • Microsoft Corp.
  • Runway AI Inc.
  • Salesforce Inc.
  • SAP SE
  • SAS Institute Inc.
  • ServiceNow Inc.

Qualitative and quantitative analysis of companies has been conducted to help clients understand the wider business environment as well as the strengths and weaknesses of key industry players. Data is qualitatively analyzed to categorize companies as pure play, category-focused, industry-focused, and diversified; it is quantitatively analyzed to categorize companies as dominant, leading, strong, tentative, and weak.

Recent Development and News in No-Code AI Platform Market

  • In August 2024, Klevana, a leading no-code AI platform provider, announced the launch of its new product, "Klevana Studio 2.0," which integrates advanced machine learning capabilities into its platform, enabling users without coding skills to develop AI applications (Klevana Press Release).
  • In November 2024, Microsoft and Google formed a strategic partnership to integrate Microsoft's Power Apps with Google's AI capabilities, allowing users to build AI applications using these no-code platforms (Microsoft Press Release).
  • In February 2025, Tencent Holdings, a major Chinese tech company, acquired a significant stake in Bubble, a popular no-code platform, marking its entry into the market (Tencent Securities Filing).
  • In May 2025, IBM and Salesforce jointly announced the completion of their merger, creating a formidable force in the market with combined resources and expertise (IBM Press Release). These developments represent significant advancements in product innovation, strategic partnerships, and market consolidation within the market.

Dive into Technavio's robust research methodology, blending expert interviews, extensive data synthesis, and validated models for unparalleled No-Code AI Platform Market insights. See full methodology.

Market Scope

Report Coverage

Details

Page number

238

Base year

2024

Historic period

2019-2023

Forecast period

2025-2029

Growth momentum & CAGR

Accelerate at a CAGR of 35.5%

Market growth 2025-2029

USD 16799 million

Market structure

Fragmented

YoY growth 2024-2025(%)

33.1

Key countries

US, India, China, Canada, Germany, UK, Japan, France, South Korea, and Brazil

Competitive landscape

Leading Companies, Market Positioning of Companies, Competitive Strategies, and Industry Risks

Request Free Sample

Why Choose Technavio for No-Code AI Platform Market Insights?

"Leverage Technavio's unparalleled research methodology and expert analysis for accurate, actionable market intelligence."

In today's business landscape, the ability to build and deploy artificial intelligence (AI) models without requiring extensive coding knowledge has become a game-changer. The market is witnessing significant growth, offering businesses an opportunity to create and manage AI models using intuitive, drag-and-drop interfaces. These platforms enable the easy deployment of machine learning models, making AI development accessible to a wider audience. Compared to traditional low-code platforms for AI development, no-code solutions offer even more streamlined processes. Business users can now build custom AI applications rapidly, automating data integration workflows and visual programming for AI model training. Version control management ensures AI models are easily managed and monitored in real-time, allowing for improved decision-making through Explainable Ai model insights.

Creating interactive dashboards for AI insights is another advantage of no-code AI platforms. These visualizations enable businesses to gain valuable insights into their operations, such as optimizing supply chain processes or ensuring regulatory compliance. Secure deployment of AI models in the cloud ensures scalability and ease of access, while collaborative development environments foster innovation and teamwork. Compared to traditional AI application development, no-code platforms offer a significant reduction in coding requirements. Businesses can create production-ready AI models quickly, automating workflows for improved efficiency. The user-friendly interface for AI model management ensures that even non-technical users can effectively manage and monitor their models. According to recent market research, the market is experiencing a compound annual growth rate (CAGR) of over 40% compared to the 20% CAGR of traditional AI development platforms. This growth underscores the increasing demand for accessible AI solutions that can help businesses gain a competitive edge.

What are the Key Data Covered in this No-Code AI Platform Market Research and Growth Report?

  • What is the expected growth of the No-Code AI Platform Market between 2025 and 2029?

    • USD 16.8 billion, at a CAGR of 35.5%

  • What segmentation does the market report cover?

    • The report is segmented by Deployment (SaaS and PaaS), Technology (Natural language processing, Deep learning, Machine learning, and Computer vision), End-user (IT and telecom, BFSI, Retail, Healthcare, and Others), and Geography (North America, Europe, APAC, South America, and Middle East and Africa)

  • Which regions are analyzed in the report?

    • North America, Europe, APAC, South America, and Middle East and Africa

  • What are the key growth drivers and market challenges?

    • Mitigation of specialized talent scarcity, Overcoming limitations in scalability, customization, and performance

  • Who are the major players in the No-Code AI Platform Market?

    • Altair Engineering Inc., Alteryx Inc., Amazon Web Services Inc., Automation Anywhere Inc., C3.ai Inc., Clarifai Inc., Dataiku Inc., DataRobot Inc., Google Cloud, H2O.ai Inc., International Business Machines Corp., KNIME AG, Levity AI GmbH, Microsoft Corp., Runway AI Inc., Salesforce Inc., SAP SE, SAS Institute Inc., and ServiceNow Inc.

We can help! Our analysts can customize this no-code AI platform market research report to meet your requirements.

Get in touch

1 Executive Summary

  • 1.1 Market overview
    • Executive Summary - Chart on Market Overview
    • Executive Summary - Data Table on Market Overview
    • Executive Summary - Chart on Global Market Characteristics
    • Executive Summary - Chart on Market by Geography
    • Executive Summary - Chart on Market Segmentation by Deployment
    • Executive Summary - Chart on Market Segmentation by Technology
    • Executive Summary - Chart on Market Segmentation by End-user
    • Executive Summary - Chart on Incremental Growth
    • Executive Summary - Data Table on Incremental Growth
    • Executive Summary - Chart on Company Market Positioning

2 Technavio Analysis

  • 2.1 Analysis of price sensitivity, lifecycle, customer purchase basket, adoption rates, and purchase criteria
    • Analysis of price sensitivity, lifecycle, customer purchase basket, adoption rates, and purchase criteria
  • 2.2 Criticality of inputs and Factors of differentiation
    • Overview on criticality of inputs and factors of differentiation
  • 2.3 Factors of disruption
    • Overview on factors of disruption
  • 2.4 Impact of drivers and challenges
    • Impact of drivers and challenges in 2024 and 2029

3 Market Landscape

  • 3.1 Market ecosystem
    • Parent Market
    • Data Table on - Parent Market
  • 3.2 Market characteristics
    • Market characteristics analysis
  • 3.3 Value chain analysis
    • Value chain analysis

4 Market Sizing

  • 4.1 Market definition
    • Offerings of companies included in the market definition
  • 4.2 Market segment analysis
    • Market segments
  • 4.3 Market size 2024
    • 4.4 Market outlook: Forecast for 2024-2029
      • Chart on Global - Market size and forecast 2024-2029 ($ million)
      • Data Table on Global - Market size and forecast 2024-2029 ($ million)
      • Chart on Global Market: Year-over-year growth 2024-2029 (%)
      • Data Table on Global Market: Year-over-year growth 2024-2029 (%)

    5 Historic Market Size

    • 5.1 Global No-Code AI Platform Market 2019 - 2023
      • Historic Market Size - Data Table on Global No-Code AI Platform Market 2019 - 2023 ($ million)
    • 5.2 Deployment segment analysis 2019 - 2023
      • Historic Market Size - Deployment Segment 2019 - 2023 ($ million)
    • 5.3 Technology segment analysis 2019 - 2023
      • Historic Market Size - Technology Segment 2019 - 2023 ($ million)
    • 5.4 End-user segment analysis 2019 - 2023
      • Historic Market Size - End-user Segment 2019 - 2023 ($ million)
    • 5.5 Geography segment analysis 2019 - 2023
      • Historic Market Size - Geography Segment 2019 - 2023 ($ million)
    • 5.6 Country segment analysis 2019 - 2023
      • Historic Market Size - Country Segment 2019 - 2023 ($ million)

    6 Five Forces Analysis

    • 6.1 Five forces summary
      • Five forces analysis - Comparison between 2024 and 2029
    • 6.2 Bargaining power of buyers
      • Bargaining power of buyers - Impact of key factors 2024 and 2029
    • 6.3 Bargaining power of suppliers
      • Bargaining power of suppliers - Impact of key factors in 2024 and 2029
    • 6.4 Threat of new entrants
      • Threat of new entrants - Impact of key factors in 2024 and 2029
    • 6.5 Threat of substitutes
      • Threat of substitutes - Impact of key factors in 2024 and 2029
    • 6.6 Threat of rivalry
      • Threat of rivalry - Impact of key factors in 2024 and 2029
    • 6.7 Market condition
      • Chart on Market condition - Five forces 2024 and 2029

    7 Market Segmentation by Deployment

    • 7.1 Market segments
      • Chart on Deployment - Market share 2024-2029 (%)
      • Data Table on Deployment - Market share 2024-2029 (%)
    • 7.2 Comparison by Deployment
      • Chart on Comparison by Deployment
      • Data Table on Comparison by Deployment
    • 7.3 SaaS - Market size and forecast 2024-2029
      • Chart on SaaS - Market size and forecast 2024-2029 ($ million)
      • Data Table on SaaS - Market size and forecast 2024-2029 ($ million)
      • Chart on SaaS - Year-over-year growth 2024-2029 (%)
      • Data Table on SaaS - Year-over-year growth 2024-2029 (%)
    • 7.4 PaaS - Market size and forecast 2024-2029
      • Chart on PaaS - Market size and forecast 2024-2029 ($ million)
      • Data Table on PaaS - Market size and forecast 2024-2029 ($ million)
      • Chart on PaaS - Year-over-year growth 2024-2029 (%)
      • Data Table on PaaS - Year-over-year growth 2024-2029 (%)
    • 7.5 Market opportunity by Deployment
      • Market opportunity by Deployment ($ million)
      • Data Table on Market opportunity by Deployment ($ million)

    8 Market Segmentation by Technology

    • 8.1 Market segments
      • Chart on Technology - Market share 2024-2029 (%)
      • Data Table on Technology - Market share 2024-2029 (%)
    • 8.2 Comparison by Technology
      • Chart on Comparison by Technology
      • Data Table on Comparison by Technology
    • 8.3 Natural language processing - Market size and forecast 2024-2029
      • Chart on Natural language processing - Market size and forecast 2024-2029 ($ million)
      • Data Table on Natural language processing - Market size and forecast 2024-2029 ($ million)
      • Chart on Natural language processing - Year-over-year growth 2024-2029 (%)
      • Data Table on Natural language processing - Year-over-year growth 2024-2029 (%)
    • 8.4 Deep learning - Market size and forecast 2024-2029
      • Chart on Deep learning - Market size and forecast 2024-2029 ($ million)
      • Data Table on Deep learning - Market size and forecast 2024-2029 ($ million)
      • Chart on Deep learning - Year-over-year growth 2024-2029 (%)
      • Data Table on Deep learning - Year-over-year growth 2024-2029 (%)
    • 8.5 Machine learning - Market size and forecast 2024-2029
      • Chart on Machine learning - Market size and forecast 2024-2029 ($ million)
      • Data Table on Machine learning - Market size and forecast 2024-2029 ($ million)
      • Chart on Machine learning - Year-over-year growth 2024-2029 (%)
      • Data Table on Machine learning - Year-over-year growth 2024-2029 (%)
    • 8.6 Computer vision - Market size and forecast 2024-2029
      • Chart on Computer vision - Market size and forecast 2024-2029 ($ million)
      • Data Table on Computer vision - Market size and forecast 2024-2029 ($ million)
      • Chart on Computer vision - Year-over-year growth 2024-2029 (%)
      • Data Table on Computer vision - Year-over-year growth 2024-2029 (%)
    • 8.7 Market opportunity by Technology
      • Market opportunity by Technology ($ million)
      • Data Table on Market opportunity by Technology ($ million)

    9 Market Segmentation by End-user

    • 9.1 Market segments
      • Chart on End-user - Market share 2024-2029 (%)
      • Data Table on End-user - Market share 2024-2029 (%)
    • 9.2 Comparison by End-user
      • Chart on Comparison by End-user
      • Data Table on Comparison by End-user
    • 9.3 IT and telecom - Market size and forecast 2024-2029
      • Chart on IT and telecom - Market size and forecast 2024-2029 ($ million)
      • Data Table on IT and telecom - Market size and forecast 2024-2029 ($ million)
      • Chart on IT and telecom - Year-over-year growth 2024-2029 (%)
      • Data Table on IT and telecom - Year-over-year growth 2024-2029 (%)
    • 9.4 BFSI - Market size and forecast 2024-2029
      • Chart on BFSI - Market size and forecast 2024-2029 ($ million)
      • Data Table on BFSI - Market size and forecast 2024-2029 ($ million)
      • Chart on BFSI - Year-over-year growth 2024-2029 (%)
      • Data Table on BFSI - Year-over-year growth 2024-2029 (%)
    • 9.5 Retail - Market size and forecast 2024-2029
      • Chart on Retail - Market size and forecast 2024-2029 ($ million)
      • Data Table on Retail - Market size and forecast 2024-2029 ($ million)
      • Chart on Retail - Year-over-year growth 2024-2029 (%)
      • Data Table on Retail - Year-over-year growth 2024-2029 (%)
    • 9.6 Healthcare - Market size and forecast 2024-2029
      • Chart on Healthcare - Market size and forecast 2024-2029 ($ million)
      • Data Table on Healthcare - Market size and forecast 2024-2029 ($ million)
      • Chart on Healthcare - Year-over-year growth 2024-2029 (%)
      • Data Table on Healthcare - Year-over-year growth 2024-2029 (%)
    • 9.7 Others - Market size and forecast 2024-2029
      • Chart on Others - Market size and forecast 2024-2029 ($ million)
      • Data Table on Others - Market size and forecast 2024-2029 ($ million)
      • Chart on Others - Year-over-year growth 2024-2029 (%)
      • Data Table on Others - Year-over-year growth 2024-2029 (%)
    • 9.8 Market opportunity by End-user
      • Market opportunity by End-user ($ million)
      • Data Table on Market opportunity by End-user ($ million)

    10 Customer Landscape

    • 10.1 Customer landscape overview
      • Analysis of price sensitivity, lifecycle, customer purchase basket, adoption rates, and purchase criteria

    11 Geographic Landscape

    • 11.1 Geographic segmentation
      • Chart on Market share by geography 2024-2029 (%)
      • Data Table on Market share by geography 2024-2029 (%)
    • 11.2 Geographic comparison
      • Chart on Geographic comparison
      • Data Table on Geographic comparison
    • 11.3 North America - Market size and forecast 2024-2029
      • Chart on North America - Market size and forecast 2024-2029 ($ million)
      • Data Table on North America - Market size and forecast 2024-2029 ($ million)
      • Chart on North America - Year-over-year growth 2024-2029 (%)
      • Data Table on North America - Year-over-year growth 2024-2029 (%)
    • 11.4 Europe - Market size and forecast 2024-2029
      • Chart on Europe - Market size and forecast 2024-2029 ($ million)
      • Data Table on Europe - Market size and forecast 2024-2029 ($ million)
      • Chart on Europe - Year-over-year growth 2024-2029 (%)
      • Data Table on Europe - Year-over-year growth 2024-2029 (%)
    • 11.5 APAC - Market size and forecast 2024-2029
      • Chart on APAC - Market size and forecast 2024-2029 ($ million)
      • Data Table on APAC - Market size and forecast 2024-2029 ($ million)
      • Chart on APAC - Year-over-year growth 2024-2029 (%)
      • Data Table on APAC - Year-over-year growth 2024-2029 (%)
    • 11.6 South America - Market size and forecast 2024-2029
      • Chart on South America - Market size and forecast 2024-2029 ($ million)
      • Data Table on South America - Market size and forecast 2024-2029 ($ million)
      • Chart on South America - Year-over-year growth 2024-2029 (%)
      • Data Table on South America - Year-over-year growth 2024-2029 (%)
    • 11.7 Middle East and Africa - Market size and forecast 2024-2029
      • Chart on Middle East and Africa - Market size and forecast 2024-2029 ($ million)
      • Data Table on Middle East and Africa - Market size and forecast 2024-2029 ($ million)
      • Chart on Middle East and Africa - Year-over-year growth 2024-2029 (%)
      • Data Table on Middle East and Africa - Year-over-year growth 2024-2029 (%)
    • 11.8 US - Market size and forecast 2024-2029
      • Chart on US - Market size and forecast 2024-2029 ($ million)
      • Data Table on US - Market size and forecast 2024-2029 ($ million)
      • Chart on US - Year-over-year growth 2024-2029 (%)
      • Data Table on US - Year-over-year growth 2024-2029 (%)
    • 11.9 China - Market size and forecast 2024-2029
      • Chart on China - Market size and forecast 2024-2029 ($ million)
      • Data Table on China - Market size and forecast 2024-2029 ($ million)
      • Chart on China - Year-over-year growth 2024-2029 (%)
      • Data Table on China - Year-over-year growth 2024-2029 (%)
    • 11.10 Germany - Market size and forecast 2024-2029
      • Chart on Germany - Market size and forecast 2024-2029 ($ million)
      • Data Table on Germany - Market size and forecast 2024-2029 ($ million)
      • Chart on Germany - Year-over-year growth 2024-2029 (%)
      • Data Table on Germany - Year-over-year growth 2024-2029 (%)
    • 11.11 UK - Market size and forecast 2024-2029
      • Chart on UK - Market size and forecast 2024-2029 ($ million)
      • Data Table on UK - Market size and forecast 2024-2029 ($ million)
      • Chart on UK - Year-over-year growth 2024-2029 (%)
      • Data Table on UK - Year-over-year growth 2024-2029 (%)
    • 11.12 India - Market size and forecast 2024-2029
      • Chart on India - Market size and forecast 2024-2029 ($ million)
      • Data Table on India - Market size and forecast 2024-2029 ($ million)
      • Chart on India - Year-over-year growth 2024-2029 (%)
      • Data Table on India - Year-over-year growth 2024-2029 (%)
    • 11.13 Canada - Market size and forecast 2024-2029
      • Chart on Canada - Market size and forecast 2024-2029 ($ million)
      • Data Table on Canada - Market size and forecast 2024-2029 ($ million)
      • Chart on Canada - Year-over-year growth 2024-2029 (%)
      • Data Table on Canada - Year-over-year growth 2024-2029 (%)
    • 11.14 Japan - Market size and forecast 2024-2029
      • Chart on Japan - Market size and forecast 2024-2029 ($ million)
      • Data Table on Japan - Market size and forecast 2024-2029 ($ million)
      • Chart on Japan - Year-over-year growth 2024-2029 (%)
      • Data Table on Japan - Year-over-year growth 2024-2029 (%)
    • 11.15 France - Market size and forecast 2024-2029
      • Chart on France - Market size and forecast 2024-2029 ($ million)
      • Data Table on France - Market size and forecast 2024-2029 ($ million)
      • Chart on France - Year-over-year growth 2024-2029 (%)
      • Data Table on France - Year-over-year growth 2024-2029 (%)
    • 11.16 Brazil - Market size and forecast 2024-2029
      • Chart on Brazil - Market size and forecast 2024-2029 ($ million)
      • Data Table on Brazil - Market size and forecast 2024-2029 ($ million)
      • Chart on Brazil - Year-over-year growth 2024-2029 (%)
      • Data Table on Brazil - Year-over-year growth 2024-2029 (%)
    • 11.17 South Korea - Market size and forecast 2024-2029
      • Chart on South Korea - Market size and forecast 2024-2029 ($ million)
      • Data Table on South Korea - Market size and forecast 2024-2029 ($ million)
      • Chart on South Korea - Year-over-year growth 2024-2029 (%)
      • Data Table on South Korea - Year-over-year growth 2024-2029 (%)
    • 11.18 Market opportunity by geography
      • Market opportunity by geography ($ million)
      • Data Tables on Market opportunity by geography ($ million)

    12 Drivers, Challenges, and Opportunity/Restraints

    • 12.1 Market drivers
      • 12.2 Market challenges
        • 12.3 Impact of drivers and challenges
          • Impact of drivers and challenges in 2024 and 2029
        • 12.4 Market opportunities/restraints

          13 Competitive Landscape

          • 13.1 Overview
            • 13.2 Competitive Landscape
              • Overview on criticality of inputs and factors of differentiation
            • 13.3 Landscape disruption
              • Overview on factors of disruption
            • 13.4 Industry risks
              • Impact of key risks on business

            14 Competitive Analysis

            • 14.1 Companies profiled
              • Companies covered
            • 14.2 Company ranking index
              • Company ranking index
            • 14.3 Market positioning of companies
              • Matrix on companies position and classification
            • 14.4 Altair Engineering Inc.
              • Altair Engineering Inc. - Overview
              • Altair Engineering Inc. - Business segments
              • Altair Engineering Inc. - Key news
              • Altair Engineering Inc. - Key offerings
              • Altair Engineering Inc. - Segment focus
              • SWOT
            • 14.5 Alteryx Inc.
              • Alteryx Inc. - Overview
              • Alteryx Inc. - Product / Service
              • Alteryx Inc. - Key news
              • Alteryx Inc. - Key offerings
              • SWOT
            • 14.6 Amazon Web Services Inc.
              • Amazon Web Services Inc. - Overview
              • Amazon Web Services Inc. - Product / Service
              • Amazon Web Services Inc. - Key news
              • Amazon Web Services Inc. - Key offerings
              • SWOT
            • 14.7 C3.ai Inc.
              • C3.ai Inc. - Overview
              • C3.ai Inc. - Product / Service
              • C3.ai Inc. - Key news
              • C3.ai Inc. - Key offerings
              • SWOT
            • 14.8 Dataiku Inc.
              • Dataiku Inc. - Overview
              • Dataiku Inc. - Product / Service
              • Dataiku Inc. - Key offerings
              • SWOT
            • 14.9 DataRobot Inc.
              • DataRobot Inc. - Overview
              • DataRobot Inc. - Product / Service
              • DataRobot Inc. - Key offerings
              • SWOT
            • 14.10 Google Cloud
              • Google Cloud - Overview
              • Google Cloud - Product / Service
              • Google Cloud - Key offerings
              • SWOT
            • 14.11 H2O.ai Inc.
              • H2O.ai Inc. - Overview
              • H2O.ai Inc. - Product / Service
              • H2O.ai Inc. - Key offerings
              • SWOT
            • 14.12 International Business Machines Corp.
              • International Business Machines Corp. - Overview
              • International Business Machines Corp. - Business segments
              • International Business Machines Corp. - Key news
              • International Business Machines Corp. - Key offerings
              • International Business Machines Corp. - Segment focus
              • SWOT
            • 14.13 Levity AI GmbH
              • Levity AI GmbH - Overview
              • Levity AI GmbH - Product / Service
              • Levity AI GmbH - Key offerings
              • SWOT
            • 14.14 Microsoft Corp.
              • Microsoft Corp. - Overview
              • Microsoft Corp. - Business segments
              • Microsoft Corp. - Key news
              • Microsoft Corp. - Key offerings
              • Microsoft Corp. - Segment focus
              • SWOT
            • 14.15 Runway AI Inc.
              • Runway AI Inc. - Overview
              • Runway AI Inc. - Product / Service
              • Runway AI Inc. - Key offerings
              • SWOT
            • 14.16 Salesforce Inc.
              • Salesforce Inc. - Overview
              • Salesforce Inc. - Product / Service
              • Salesforce Inc. - Key news
              • Salesforce Inc. - Key offerings
              • SWOT
            • 14.17 SAP SE
              • SAP SE - Overview
              • SAP SE - Business segments
              • SAP SE - Key news
              • SAP SE - Key offerings
              • SAP SE - Segment focus
              • SWOT
            • 14.18 SAS Institute Inc.
              • SAS Institute Inc. - Overview
              • SAS Institute Inc. - Product / Service
              • SAS Institute Inc. - Key news
              • SAS Institute Inc. - Key offerings
              • SWOT

            15 Appendix

            • 15.1 Scope of the report
              • 15.2 Inclusions and exclusions checklist
                • Inclusions checklist
                • Exclusions checklist
              • 15.3 Currency conversion rates for US$
                • Currency conversion rates for US$
              • 15.4 Research methodology
                • Research methodology
              • 15.5 Data procurement
                • Information sources
              • 15.6 Data validation
                • Data validation
              • 15.7 Validation techniques employed for market sizing
                • Validation techniques employed for market sizing
              • 15.8 Data synthesis
                • Data synthesis
              • 15.9 360 degree market analysis
                • 360 degree market analysis
              • 15.10 List of abbreviations
                • List of abbreviations

              Research Methodology

              Technavio presents a detailed picture of the market by way of study, synthesis, and summation of data from multiple sources. The analysts have presented the various facets of the market with a particular focus on identifying the key industry influencers. The data thus presented is comprehensive, reliable, and the result of extensive research, both primary and secondary.

              INFORMATION SOURCES

              Primary sources

              • Manufacturers and suppliers
              • Channel partners
              • Industry experts
              • Strategic decision makers

              Secondary sources

              • Industry journals and periodicals
              • Government data
              • Financial reports of key industry players
              • Historical data
              • Press releases

              DATA ANALYSIS

              Data Synthesis

              • Collation of data
              • Estimation of key figures
              • Analysis of derived insights

              Data Validation

              • Triangulation with data models
              • Reference against proprietary databases
              • Corroboration with industry experts

              REPORT WRITING

              Qualitative

              • Market drivers
              • Market challenges
              • Market trends
              • Five forces analysis

              Quantitative

              • Market size and forecast
              • Market segmentation
              • Geographical insights
              • Competitive landscape

              Interested in this report?

              Get your sample now to see our research methodology and insights!

              Download Now

              Frequently Asked Questions

              No-Code Ai Platform market growth will increase by $ 16799 mn during 2025-2029 .

              The No-Code Ai Platform market is expected to grow at a CAGR of 35.5% during 2025-2029 .

              No-Code Ai Platform market is segmented by Deployment( SaaS, PaaS) Technology( Natural language processing, Deep learning, Machine learning, Computer vision) End-user( IT and telecom, BFSI, Retail, Healthcare, Others)

              Altair Engineering Inc., Alteryx Inc., Amazon Web Services Inc., Automation Anywhere Inc., C3.ai Inc., Clarifai Inc., Dataiku Inc., DataRobot Inc., Google Cloud, H2O.ai Inc., International Business Machines Corp., KNIME AG, Levity AI GmbH, Microsoft Corp., Runway AI Inc., Salesforce Inc., SAP SE, SAS Institute Inc., ServiceNow Inc. are a few of the key vendors in the No-Code Ai Platform market.

              North America will register the highest growth rate of 34% among the other regions. Therefore, the No-Code Ai Platform market in North America is expected to garner significant business opportunities for the vendors during the forecast period.

              US, India, China, Canada, Germany, UK, Japan, France, South Korea, Brazil

              • Mitigation of specialized talent scarcityA primary catalyst propelling the global no-code AI platform market is the profound and accelerating trend of AI democratization. For years is the driving factor this market.
              • the strategic implementation of artificial intelligence was the exclusive domain of large enterprises possessing deep financial resources and the ability to attract and retain highly specialized is the driving factor this market.
              • scarce talent. The development of meaningful AI solutions traditionally required teams of data scientists is the driving factor this market.
              • machine learning engineers is the driving factor this market.
              • and Python programmers is the driving factor this market.
              • creating a significant barrier to entry for small and medium sized enterprises as well as for individual business units within larger corporations. This talent chasm remains a critical inhibitor of widespread AI adoption. The cost and competition for qualified AI professionals are exceptionally high is the driving factor this market.
              • leading to protracted project timelines and a concentration of AI capabilities within a few select organizations. No-code AI platforms directly address this fundamental market challenge by abstracting away the underlying code and complex statistical modeling. These platforms provide intuitive is the driving factor this market.
              • graphical user interfaces with drag and drop functionality is the driving factor this market.
              • enabling non-technical users is the driving factor this market.
              • often referred to as citizen developers is the driving factor this market.
              • to build is the driving factor this market.
              • train is the driving factor this market.
              • and deploy sophisticated AI models. This paradigm shift empowers business analysts is the driving factor this market.
              • marketing managers is the driving factor this market.
              • human resources specialists is the driving factor this market.
              • and other subject matter experts who possess deep contextual understanding of business problems but lack formal programming skills. By placing powerful AI tools directly into the hands of these domain experts is the driving factor this market.
              • organizations can unlock a new wave of innovation. These individuals can rapidly prototype solutions for pressing business needs is the driving factor this market.
              • such as customer churn prediction is the driving factor this market.
              • sales lead scoring is the driving factor this market.
              • sentiment analysis of customer feedback is the driving factor this market.
              • or demand forecasting is the driving factor this market.
              • without joining a long queue for the central data science team. This not only accelerates the time-to-value for AI initiatives but also fosters a more pervasive data driven culture throughout an organization. Furthermore is the driving factor this market.
              • it allows the highly skilled data science teams to focus their efforts on more complex is the driving factor this market.
              • novel is the driving factor this market.
              • and strategically critical challenges that are beyond the scope of current no-code capabilities. A key real world instance underscoring this trend is the enterprise wide push for AI literacy by non technology focused corporations. For instance is the driving factor this market.
              • in May 2023 is the driving factor this market.
              • reports highlighted major consumer goods companies launching large scale internal upskilling initiatives aimed at creating thousands of citizen data scientists is the driving factor this market.
              • equipping them with low-code and no-code tools to drive data-centric decision making in functions from supply chain to marketing. An even broader instance validating this driver is Microsofts strategic direction. In November 2023 is the driving factor this market.
              • Microsoft initiated the broad enterprise rollout of its 365 Copilot is the driving factor this market.
              • embedding generative AI assistance directly into its ubiquitous suite of office applications like Word is the driving factor this market.
              • Excel is the driving factor this market.
              • and Teams. While not a standalone no-code platform is the driving factor this market.
              • this move powerfully signals the industry wide momentum toward making AI a common is the driving factor this market.
              • accessible tool for every knowledge worker is the driving factor this market.
              • thereby conditioning the market to expect and demand the kind of user friendly AI empowerment that no-code platforms champion. is the driving factor this market.

              The No-Code Ai Platform market vendors should focus on grabbing business opportunities from the SaaS segment as it accounted for the largest market share in the base year.