Non-Mydriatic Handheld Fundus Camera Market Analysis North America, Europe, Asia, Rest of World (ROW) - US, Germany, Japan, China, India, UK, France, Brazil, South Korea, Italy - Size and Forecast 2025-2029

Non-Mydriatic Handheld Fundus Camera Market Analysis North America, Europe, Asia, Rest of World (ROW) - US, Germany, Japan, China, India, UK, France, Brazil, South Korea, Italy - Size and Forecast 2025-2029

Published: Jan 2025 191 Pages SKU: IRTNTR80552

Market Overview at a Glance

$49.63 Mn
Market Opportunity
7.1%
CAGR
6.3
YoY growth 2024-2025(%)

Non-Mydriatic Handheld Fundus Camera Market Size 2025-2029

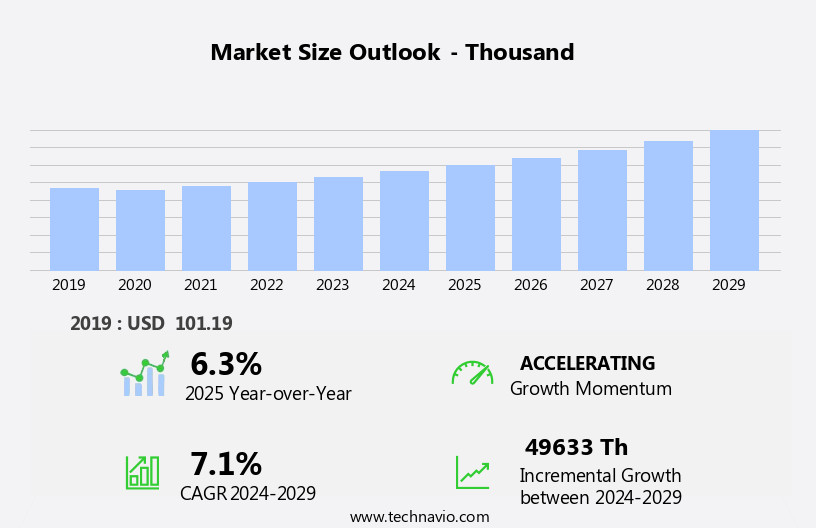
The non-mydriatic handheld fundus camera market size is forecast to increase by USD 49633 thousand, at a CAGR of 7.1% between 2024 and 2029.

  • The market is witnessing significant growth, driven by the rising prevalence of eye disorders and the increasing demand for portable diagnostic devices. The market is marked by the introduction of advanced handheld cameras, such as the Welch Allyn Spot Vital Signs Non-Mydriatic Fundus Camera and the NIDEK NM-102N, which offer high-quality images and ease of use. However, the market faces challenges from alternative technologies, including smartphone retinal imaging and optical coherence tomography (OCT) scans. These alternatives offer affordability and accessibility but may not provide the same level of diagnostic accuracy as dedicated handheld fundus cameras.
  • The competition from these technologies necessitates continuous innovation and improvement in handheld fundus cameras to maintain market share. Additionally, the market's growth is influenced by demographic shifts, aging populations, and increasing healthcare awareness, creating opportunities for companies to expand their offerings and cater to diverse customer needs.

What will be the Size of the Non-Mydriatic Handheld Fundus Camera Market during the forecast period?

Non-Mydriatic Handheld Fundus Camera Market Size

 Request Free Sample

The market continues to evolve, driven by advancements in technology and increasing applications across various sectors of the healthcare industry. Image recognition algorithms and red-free imaging enhance image clarity, enabling earlier detection and diagnosis of retinal conditions such as macular degeneration, diabetic retinopathy, and glaucoma. Data integration and cloud storage facilitate seamless image transfer and remote monitoring, improving patient experience and enabling real-time analysis. Maintenance costs are a significant consideration, with manufacturers focusing on long battery life and ease of use to enhance customer retention. Artificial intelligence (AI) and machine learning are increasingly integrated into handheld cameras, enabling image classification, segmentation, and analysis, while ensuring data security and privacy.

Product development is ongoing, with a focus on software integration, user interface, and autofocus technology to improve image quality and diagnostic accuracy. Regulatory compliance, customer acquisition, and sales and marketing strategies are key areas of focus for market penetration. Pricing strategies and image resolution are also critical factors in the competitive landscape. Handheld cameras are increasingly used as diagnostic tools in eye care, with wide-field imaging and autofluorescence imaging offering additional benefits. The market is expected to continue growing, driven by the need for cost-effective, portable, and efficient retinal imaging solutions.

How is this Non-Mydriatic Handheld Fundus Camera Industry segmented?

The non-mydriatic handheld fundus camera industry research report provides comprehensive data (region-wise segment analysis), with forecasts and estimates in "USD thousand" for the period 2025-2029, as well as historical data from 2019-2023 for the following segments.

  • Distribution Channel
    • Offline
    • Online
  • End-user
    • Hospitals and clinics
    • Ambulatory surgical centers
    • Others
  • Geography
    • North America
      • US
    • Europe
      • France
      • Germany
      • Italy
      • UK
    • APAC
      • China
      • India
      • Japan
      • South Korea
    • South America
      • Brazil
    • Rest of World (ROW)

    By Distribution Channel Insights

    The offline segment is estimated to witness significant growth during the forecast period.

    The market is experiencing significant growth, driven by advancements in image recognition technology and red-free imaging. These innovations enhance image clarity, enabling early detection of eye conditions such as diabetic retinopathy, glaucoma, and macular degeneration. Cloud storage and image transfer facilitate remote monitoring and access to patient records, improving customer retention and clinical workflow efficiency. Artificial intelligence and machine learning are integral to image analysis, enabling automatic classification and segmentation of retinal images. Product development is focused on enhancing user experience through features like autofocus technology, user interface, and ease of use. Sales and marketing efforts are aimed at market penetration through various distribution channels, including offline channels.

    Offline distribution channels, particularly healthcare institutions and hospitals, play a crucial role in the market. These institutions engage directly with manufacturers for procurement, evaluating usability and functionality in clinical settings. Optometrists and ophthalmologists interact with sales representatives to ensure regulatory compliance and data security. Maintenance costs, battery life, and image resolution are essential considerations for healthcare providers. Fluorescein angiography and autofluorescence imaging are valuable research applications, contributing to the market's growth. Technology licensing and software integration are key strategies for market expansion. Customer acquisition and patient management are essential for long-term success. Pricing strategies and image management systems are critical to maintaining a competitive edge.

    Wide-field imaging and ce marking ensure regulatory compliance and improve image quality. FDA approval and clinical trials further validate the diagnostic capabilities of these devices. In summary, the market is dynamic, driven by technological advancements, customer needs, and regulatory requirements. Offline distribution channels, particularly healthcare institutions and hospitals, are key players in the market's growth. Continuous innovation and strategic partnerships will be essential for market penetration and long-term success.

    Non-Mydriatic Handheld Fundus Camera Market Size

    Request Free Sample

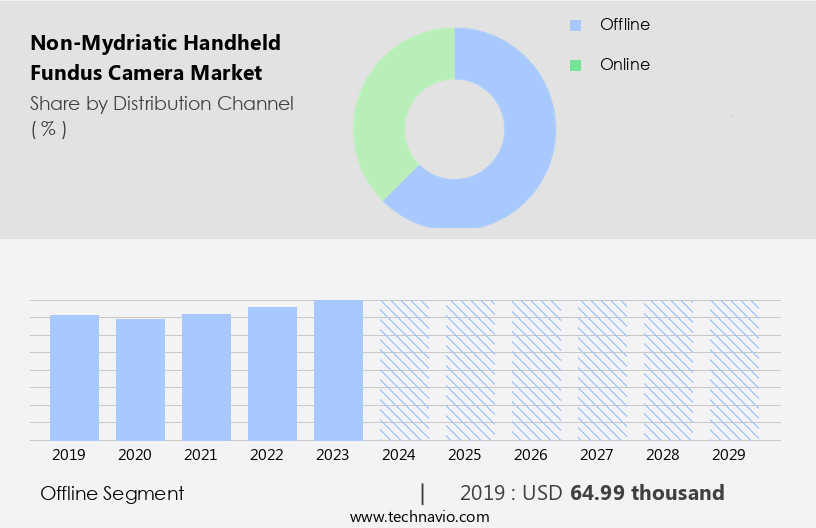
    The Offline segment was valued at USD 64.99 thousand in 2019 and showed a gradual increase during the forecast period.

    Regional Analysis

    North America is estimated to contribute 43% to the growth of the global market during the forecast period.Technavio’s analysts have elaborately explained the regional trends and drivers that shape the market during the forecast period.

    Non-Mydriatic Handheld Fundus Camera Market Share by Geography

     Request Free Sample

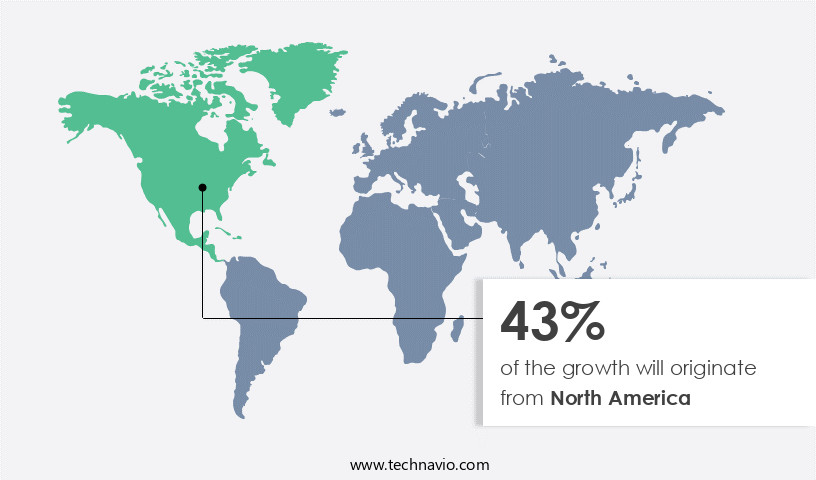
    The market is experiencing significant growth in North America due to the high prevalence of eye disorders such as diabetic retinopathy, macular degeneration, and glaucoma. With these conditions requiring regular monitoring and early detection for effective treatment, the demand for portable, non-dilating retinal imaging solutions is on the rise. In the US, the Centers for Disease Control and Prevention (CDC) projects that the number of individuals with diabetic retinopathy will reach 14.6 million by 2050. This condition, the most common form of diabetic eye disease, necessitates frequent retinal examinations. To address the need for efficient and accurate retinal imaging, technological advancements have been made in the field.

    These include the integration of artificial intelligence (AI) and machine learning algorithms for image recognition and analysis, improving image quality and segmentation. Red-free imaging and autofluorescence imaging are also gaining popularity due to their ability to provide clearer images and enhance diagnostic accuracy. Cloud storage and data integration enable seamless transfer and access to patient records, ensuring efficient clinical workflows and remote monitoring capabilities. Product development is focused on enhancing image resolution, battery life, and user experience. Sales and marketing strategies aim to increase market penetration through technology licensing and distribution channels. Regulatory compliance, data security, and ease of use are essential considerations for both manufacturers and healthcare providers.

    Fluorescein angiography and wide-field imaging are also utilized for research applications and diagnostic purposes. The market is expected to continue its growth trajectory, driven by the increasing demand for cost-effective, portable, and user-friendly retinal imaging solutions.

    Market Dynamics

    Our researchers analyzed the data with 2024 as the base year, along with the key drivers, trends, and challenges. A holistic analysis of drivers will help companies refine their marketing strategies to gain a competitive advantage.

    What are the key market drivers leading to the rise in the adoption of Non-Mydriatic Handheld Fundus Camera Industry?

    • The increasing prevalence of eye disorders serves as the primary market driver. 

    • The market is experiencing significant growth due to the increasing prevalence of eye disorders and the need for early detection and continuous monitoring. According to the World Health Organization (WHO), approximately 2.2 billion people worldwide had suffered from near or distant vision impairment in 2023. Alarmingly, 1 billion of these cases were preventable or undiagnosed. Among the primary causes of distance vision impairment or blindness, age-related macular degeneration (AMD) had affected 8 million people, and glaucoma had impacted 7 million. Early detection and regular monitoring are crucial for effective management and treatment of these conditions.
    • Non-mydriatic imaging technology, which allows for retinal photography without the use of dilating drops, is gaining popularity due to its convenience and patient comfort. This technology is particularly beneficial for diabetic retinopathy screening, as regular monitoring is essential for managing this condition. The market for non-mydriatic handheld fundus cameras is driven by the increasing demand for ophthalmic imaging and the adoption of digital fundus cameras. Wide-field imaging, autofocus technology, and user-friendly interfaces are key features that are enhancing the user experience and driving market growth. Image analysis and research applications are also contributing to the market's growth, as these technologies enable healthcare professionals to make more accurate diagnoses and develop new treatments.
    • Ce marking and high image quality are essential considerations for manufacturers to meet regulatory requirements and meet customer expectations.

    What are the market trends shaping the Non-Mydriatic Handheld Fundus Camera Industry?

    • The introduction of new products is a current market trend. Professionals in various industries are continually innovating and releasing new items to meet consumer demands and stay competitive.

    • The market is experiencing substantial growth due to the introduction of innovative products that enable efficient and accessible retinal imaging solutions. One recent example is the launch of Eyer, a non-mydriatic handheld fundus camera by PHELCOM in Japan. This device, which connects to a smartphone, allows for high-quality retinal examinations in a few minutes. Despite challenges such as Japanese certification processes and language barriers, PHELCOM successfully obtained medical device certification in November 2022, showcasing their dedication to regulatory compliance and market expansion.
    • The Eyer camera addresses the need for efficient and accessible retinal imaging solutions, particularly in regions with stringent regulatory environments. This innovation is a significant step for PHELCOM in their international growth strategy.

    What challenges does the Non-Mydriatic Handheld Fundus Camera Industry face during its growth?

    • The expansion of the industry is significantly influenced by the intensifying competition from advanced technologies, posing a significant challenge that must be addressed by market participants. 

    • The market experiences intense competition from alternative retinal diagnostic tools, such as optical coherence tomography (OCT) and traditional desktop fundus cameras. OCT, in particular, offers high-resolution cross-sectional images of the retina, enabling detailed visualization of retinal layers for accurate diagnosis and monitoring of conditions like macular degeneration, diabetic retinopathy, and glaucoma. This advanced imaging capability, coupled with the comprehensive diagnostic capabilities of OCT, makes it a preferred choice for healthcare providers. As a result, the adoption of non-mydriatic handheld fundus cameras may be limited in certain markets. However, the market continues to evolve with technological advancements, including image recognition, red-free imaging, and artificial intelligence (AI).
    • These technologies enhance image clarity and facilitate data integration, cloud storage, image transfer, and remote monitoring. Product development in these areas aims to provide more accurate and efficient diagnostic solutions, making non-mydriatic handheld fundus cameras a viable alternative to OCT and traditional desktop fundus cameras. Maintenance costs and distribution channels also play a crucial role in the market dynamics. Non-mydriatic handheld fundus cameras offer the advantage of lower maintenance costs and ease of use, making them suitable for remote locations and resource-limited settings. Additionally, strategic partnerships and collaborations with key players in the healthcare industry can expand distribution channels and increase market penetration.
    • In conclusion, the market faces challenges from advanced retinal diagnostic tools but continues to innovate with technological advancements, focusing on image recognition, red-free imaging, AI, data integration, cloud storage, image transfer, and remote monitoring. Lower maintenance costs and strategic partnerships further contribute to the market's growth and expansion.

    Exclusive Customer Landscape

    The non-mydriatic handheld fundus camera market forecasting report includes the adoption lifecycle of the market, covering from the innovator’s stage to the laggard’s stage. It focuses on adoption rates in different regions based on penetration. Furthermore, the non-mydriatic handheld fundus camera market report also includes key purchase criteria and drivers of price sensitivity to help companies evaluate and develop their market growth analysis strategies.

    Non-Mydriatic Handheld Fundus Camera Market Share by Geography

     Customer Landscape

    Key Companies & Market Insights

    Companies are implementing various strategies, such as strategic alliances, non-mydriatic handheld fundus camera market forecast, partnerships, mergers and acquisitions, geographical expansion, and product/service launches, to enhance their presence in the industry.

    Allm Inc. - This company provides a cutting-edge, non-mydriatic handheld fundus camera solution, such as the Eyer device. Weighing light and compact, this portable tool is effortlessly connected to a smartphone, enabling its use in diverse settings, including bedside examinations, home visits, and assessments for the elderly and pediatric populations. Its innovative design ensures ease of use and versatility, making it an indispensable tool for healthcare professionals.

    The industry research and growth report includes detailed analyses of the competitive landscape of the market and information about key companies, including:

    • Allm Inc.
    • Carl Zeiss AG
    • Epipole Ltd.
    • Hongdee Ophthalmic Equipment
    • Kody Medical Electronics Pvt. Ltd.
    • NEW VISION
    • Optitech Eye Care
    • Optomed Oyj
    • PHELCOM
    • Remidio Innovative Solutions Pvt. Ltd.
    • Topcon Corp.
    • Volk Optical

    Qualitative and quantitative analysis of companies has been conducted to help clients understand the wider business environment as well as the strengths and weaknesses of key industry players. Data is qualitatively analyzed to categorize companies as pure play, category-focused, industry-focused, and diversified; it is quantitatively analyzed to categorize companies as dominant, leading, strong, tentative, and weak.

    Recent Development and News in Non-Mydriatic Handheld Fundus Camera Market

    • In March 2023, Canon, a leading player in the market, introduced its new model, the CR-2 Plus. This compact and portable device boasts enhanced image quality and faster image processing, making it an attractive option for healthcare professionals in remote areas or small clinics (Canon Europe Press Release, 2023).
    • In July 2024, Topcon Medical Systems and Google announced a strategic partnership to integrate Topcon's Non-Mydriatic Fundus Cameras with Google Health. This collaboration aims to streamline patient data management and improve access to diagnostic information for healthcare providers (Topcon Medical Systems Press Release, 2024).
    • In October 2024, Optos plc, a leading manufacturer of retinal imaging technology, secured a significant investment of USD50 million from Fidelity Management & Research Company LLC. This funding will support the expansion of Optos' global presence and the development of new technologies (Business Wire, 2024).
    • In January 2025, the European Union granted CE Mark approval to Nidek's Non-Mydriatic Handheld Fundus Camera, the Nidek RS-1. This approval marks the entry of Nidek's handheld device into the European market, expanding its reach and increasing competition within the region (Nidek Co., Ltd. Press Release, 2025).

    Research Analyst Overview

    • The market in healthcare technology is experiencing significant growth due to the increasing demand for remote diagnosis and ocular health monitoring. Automated analysis and image enhancement technologies enable early detection of retinal diseases, including visual field defects and preventive care for eye disease management. The medical device industry is integrating clinical decision support systems to facilitate precise diagnosis and treatment plans. The biopharmaceutical industry leverages fundus photography for drug development, while medical imaging market trends favor digital healthcare and patient engagement.
    • Medical device regulations ensure the accuracy and safety of these devices. Precision medicine and healthcare data analytics contribute to improved image interpretation and patient education on visual acuity and retinal disease management.

    Dive into Technavio’s robust research methodology, blending expert interviews, extensive data synthesis, and validated models for unparalleled Non-Mydriatic Handheld Fundus Camera Market insights. See full methodology.

    Market Scope

    Report Coverage

    Details

    Page number

    191

    Base year

    2024

    Historic period

    2019-2023

    Forecast period

    2025-2029

    Growth momentum & CAGR

    Accelerate at a CAGR of 7.1%

    Market growth 2025-2029

    USD 49633 thousand

    Market structure

    Concentrated

    YoY growth 2024-2025(%)

    6.3

    Key countries

    US, Germany, Japan, China, India, UK, France, Brazil, South Korea, and Italy

    Competitive landscape

    Leading Companies, Market Positioning of Companies, Competitive Strategies, and Industry Risks

    Request Free Sample

    What are the Key Data Covered in this Non-Mydriatic Handheld Fundus Camera Market Research and Growth Report?

    • CAGR of the Non-Mydriatic Handheld Fundus Camera industry during the forecast period
    • Detailed information on factors that will drive the growth and forecasting between 2025 and 2029
    • Precise estimation of the size of the market and its contribution of the industry in focus to the parent market
    • Accurate predictions about upcoming growth and trends and changes in consumer behaviour
    • Growth of the market across North America, Europe, Asia, and Rest of World (ROW)
    • Thorough analysis of the market’s competitive landscape and detailed information about companies
    • Comprehensive analysis of factors that will challenge the non-mydriatic handheld fundus camera market growth of industry companies

    We can help! Our analysts can customize this non-mydriatic handheld fundus camera market research report to meet your requirements.

    Get in touch


    1 Executive Summary

    • 1.1 Market overview
      • Executive Summary - Chart on Market Overview
      • Executive Summary - Data Table on Market Overview
      • Executive Summary - Chart on Global Market Characteristics
      • Executive Summary - Chart on Market by Geography
      • Executive Summary - Chart on Market Segmentation by Distribution Channel
      • Executive Summary - Chart on Market Segmentation by End-user
      • Executive Summary - Chart on Incremental Growth
      • Executive Summary - Data Table on Incremental Growth
      • Executive Summary - Chart on Company Market Positioning

    2 Technavio Analysis

    • 2.1 Analysis of price sensitivity, lifecycle, customer purchase basket, adoption rates, and purchase criteria
      • Analysis of price sensitivity, lifecycle, customer purchase basket, adoption rates, and purchase criteria
    • 2.2 Criticality of inputs and Factors of differentiation
      • Overview on criticality of inputs and factors of differentiation
    • 2.3 Factors of disruption
      • Overview on factors of disruption
    • 2.4 Impact of drivers and challenges
      • Impact of drivers and challenges in 2024 and 2029

    3 Market Landscape

    • 3.1 Market ecosystem
      • Parent Market
      • Data Table on - Parent Market
    • 3.2 Market characteristics
      • Market characteristics analysis
    • 3.3 Value chain analysis
      • Value chain analysis

    4 Market Sizing

    • 4.1 Market definition
      • Offerings of companies included in the market definition
    • 4.2 Market segment analysis
      • Market segments
    • 4.3 Market size 2024
      • 4.4 Market outlook: Forecast for 2024-2029
        • Chart on Global - Market size and forecast 2024-2029 ($ thousand)
        • Data Table on Global - Market size and forecast 2024-2029 ($ thousand)
        • Chart on Global Market: Year-over-year growth 2024-2029 (%)
        • Data Table on Global Market: Year-over-year growth 2024-2029 (%)

      5 Historic Market Size

      • 5.1 Global Non-Mydriatic Handheld Fundus Camera Market 2019 - 2023
        • Historic Market Size - Data Table on Global Non-Mydriatic Handheld Fundus Camera Market 2019 - 2023 ($ thousand)
      • 5.2 Distribution Channel segment analysis 2019 - 2023
        • Historic Market Size - Distribution Channel Segment 2019 - 2023 ($ thousand)
      • 5.3 End-user segment analysis 2019 - 2023
        • Historic Market Size - End-user Segment 2019 - 2023 ($ thousand)
      • 5.4 Geography segment analysis 2019 - 2023
        • Historic Market Size - Geography Segment 2019 - 2023 ($ thousand)
      • 5.5 Country segment analysis 2019 - 2023
        • Historic Market Size - Country Segment 2019 - 2023 ($ thousand)

      6 Qualitative Analysis

      • 6.1 Impact of AI on Global Non-mydriatic Handheld Fundus Camera Market

        7 Five Forces Analysis

        • 7.1 Five forces summary
          • Five forces analysis - Comparison between 2024 and 2029
        • 7.2 Bargaining power of buyers
          • Bargaining power of buyers - Impact of key factors 2024 and 2029
        • 7.3 Bargaining power of suppliers
          • Bargaining power of suppliers - Impact of key factors in 2024 and 2029
        • 7.4 Threat of new entrants
          • Threat of new entrants - Impact of key factors in 2024 and 2029
        • 7.5 Threat of substitutes
          • Threat of substitutes - Impact of key factors in 2024 and 2029
        • 7.6 Threat of rivalry
          • Threat of rivalry - Impact of key factors in 2024 and 2029
        • 7.7 Market condition
          • Chart on Market condition - Five forces 2024 and 2029

        8 Market Segmentation by Distribution Channel

        • 8.1 Market segments
          • Chart on Distribution Channel - Market share 2024-2029 (%)
          • Data Table on Distribution Channel - Market share 2024-2029 (%)
        • 8.2 Comparison by Distribution Channel
          • Chart on Comparison by Distribution Channel
          • Data Table on Comparison by Distribution Channel
        • 8.3 Offline - Market size and forecast 2024-2029
          • Chart on Offline - Market size and forecast 2024-2029 ($ thousand)
          • Data Table on Offline - Market size and forecast 2024-2029 ($ thousand)
          • Chart on Offline - Year-over-year growth 2024-2029 (%)
          • Data Table on Offline - Year-over-year growth 2024-2029 (%)
        • 8.4 Online - Market size and forecast 2024-2029
          • Chart on Online - Market size and forecast 2024-2029 ($ thousand)
          • Data Table on Online - Market size and forecast 2024-2029 ($ thousand)
          • Chart on Online - Year-over-year growth 2024-2029 (%)
          • Data Table on Online - Year-over-year growth 2024-2029 (%)
        • 8.5 Market opportunity by Distribution Channel
          • Market opportunity by Distribution Channel ($ thousand)
          • Data Table on Market opportunity by Distribution Channel ($ thousand)

        9 Market Segmentation by End-user

        • 9.1 Market segments
          • Chart on End-user - Market share 2024-2029 (%)
          • Data Table on End-user - Market share 2024-2029 (%)
        • 9.2 Comparison by End-user
          • Chart on Comparison by End-user
          • Data Table on Comparison by End-user
        • 9.3 Hospitals and clinics - Market size and forecast 2024-2029
          • Chart on Hospitals and clinics - Market size and forecast 2024-2029 ($ thousand)
          • Data Table on Hospitals and clinics - Market size and forecast 2024-2029 ($ thousand)
          • Chart on Hospitals and clinics - Year-over-year growth 2024-2029 (%)
          • Data Table on Hospitals and clinics - Year-over-year growth 2024-2029 (%)
        • 9.4 Ambulatory surgical centers - Market size and forecast 2024-2029
          • Chart on Ambulatory surgical centers - Market size and forecast 2024-2029 ($ thousand)
          • Data Table on Ambulatory surgical centers - Market size and forecast 2024-2029 ($ thousand)
          • Chart on Ambulatory surgical centers - Year-over-year growth 2024-2029 (%)
          • Data Table on Ambulatory surgical centers - Year-over-year growth 2024-2029 (%)
        • 9.5 Others - Market size and forecast 2024-2029
          • Chart on Others - Market size and forecast 2024-2029 ($ thousand)
          • Data Table on Others - Market size and forecast 2024-2029 ($ thousand)
          • Chart on Others - Year-over-year growth 2024-2029 (%)
          • Data Table on Others - Year-over-year growth 2024-2029 (%)
        • 9.6 Market opportunity by End-user
          • Market opportunity by End-user ($ thousand)
          • Data Table on Market opportunity by End-user ($ thousand)

        10 Customer Landscape

        • 10.1 Customer landscape overview
          • Analysis of price sensitivity, lifecycle, customer purchase basket, adoption rates, and purchase criteria

        11 Geographic Landscape

        • 11.1 Geographic segmentation
          • Chart on Market share by geography 2024-2029 (%)
          • Data Table on Market share by geography 2024-2029 (%)
        • 11.2 Geographic comparison
          • Chart on Geographic comparison
          • Data Table on Geographic comparison
        • 11.3 North America - Market size and forecast 2024-2029
          • Chart on North America - Market size and forecast 2024-2029 ($ thousand)
          • Data Table on North America - Market size and forecast 2024-2029 ($ thousand)
          • Chart on North America - Year-over-year growth 2024-2029 (%)
          • Data Table on North America - Year-over-year growth 2024-2029 (%)
        • 11.4 Europe - Market size and forecast 2024-2029
          • Chart on Europe - Market size and forecast 2024-2029 ($ thousand)
          • Data Table on Europe - Market size and forecast 2024-2029 ($ thousand)
          • Chart on Europe - Year-over-year growth 2024-2029 (%)
          • Data Table on Europe - Year-over-year growth 2024-2029 (%)
        • 11.5 Asia - Market size and forecast 2024-2029
          • Chart on Asia - Market size and forecast 2024-2029 ($ thousand)
          • Data Table on Asia - Market size and forecast 2024-2029 ($ thousand)
          • Chart on Asia - Year-over-year growth 2024-2029 (%)
          • Data Table on Asia - Year-over-year growth 2024-2029 (%)
        • 11.6 Rest of World (ROW) - Market size and forecast 2024-2029
          • Chart on Rest of World (ROW) - Market size and forecast 2024-2029 ($ thousand)
          • Data Table on Rest of World (ROW) - Market size and forecast 2024-2029 ($ thousand)
          • Chart on Rest of World (ROW) - Year-over-year growth 2024-2029 (%)
          • Data Table on Rest of World (ROW) - Year-over-year growth 2024-2029 (%)
        • 11.7 US - Market size and forecast 2024-2029
          • Chart on US - Market size and forecast 2024-2029 ($ thousand)
          • Data Table on US - Market size and forecast 2024-2029 ($ thousand)
          • Chart on US - Year-over-year growth 2024-2029 (%)
          • Data Table on US - Year-over-year growth 2024-2029 (%)
        • 11.8 Germany - Market size and forecast 2024-2029
          • Chart on Germany - Market size and forecast 2024-2029 ($ thousand)
          • Data Table on Germany - Market size and forecast 2024-2029 ($ thousand)
          • Chart on Germany - Year-over-year growth 2024-2029 (%)
          • Data Table on Germany - Year-over-year growth 2024-2029 (%)
        • 11.9 Japan - Market size and forecast 2024-2029
          • Chart on Japan - Market size and forecast 2024-2029 ($ thousand)
          • Data Table on Japan - Market size and forecast 2024-2029 ($ thousand)
          • Chart on Japan - Year-over-year growth 2024-2029 (%)
          • Data Table on Japan - Year-over-year growth 2024-2029 (%)
        • 11.10 China - Market size and forecast 2024-2029
          • Chart on China - Market size and forecast 2024-2029 ($ thousand)
          • Data Table on China - Market size and forecast 2024-2029 ($ thousand)
          • Chart on China - Year-over-year growth 2024-2029 (%)
          • Data Table on China - Year-over-year growth 2024-2029 (%)
        • 11.11 India - Market size and forecast 2024-2029
          • Chart on India - Market size and forecast 2024-2029 ($ thousand)
          • Data Table on India - Market size and forecast 2024-2029 ($ thousand)
          • Chart on India - Year-over-year growth 2024-2029 (%)
          • Data Table on India - Year-over-year growth 2024-2029 (%)
        • 11.12 UK - Market size and forecast 2024-2029
          • Chart on UK - Market size and forecast 2024-2029 ($ thousand)
          • Data Table on UK - Market size and forecast 2024-2029 ($ thousand)
          • Chart on UK - Year-over-year growth 2024-2029 (%)
          • Data Table on UK - Year-over-year growth 2024-2029 (%)
        • 11.13 France - Market size and forecast 2024-2029
          • Chart on France - Market size and forecast 2024-2029 ($ thousand)
          • Data Table on France - Market size and forecast 2024-2029 ($ thousand)
          • Chart on France - Year-over-year growth 2024-2029 (%)
          • Data Table on France - Year-over-year growth 2024-2029 (%)
        • 11.14 Brazil - Market size and forecast 2024-2029
          • Chart on Brazil - Market size and forecast 2024-2029 ($ thousand)
          • Data Table on Brazil - Market size and forecast 2024-2029 ($ thousand)
          • Chart on Brazil - Year-over-year growth 2024-2029 (%)
          • Data Table on Brazil - Year-over-year growth 2024-2029 (%)
        • 11.15 South Korea - Market size and forecast 2024-2029
          • Chart on South Korea - Market size and forecast 2024-2029 ($ thousand)
          • Data Table on South Korea - Market size and forecast 2024-2029 ($ thousand)
          • Chart on South Korea - Year-over-year growth 2024-2029 (%)
          • Data Table on South Korea - Year-over-year growth 2024-2029 (%)
        • 11.16 Italy - Market size and forecast 2024-2029
          • Chart on Italy - Market size and forecast 2024-2029 ($ thousand)
          • Data Table on Italy - Market size and forecast 2024-2029 ($ thousand)
          • Chart on Italy - Year-over-year growth 2024-2029 (%)
          • Data Table on Italy - Year-over-year growth 2024-2029 (%)
        • 11.17 Market opportunity by geography
          • Market opportunity by geography ($ thousand)
          • Data Tables on Market opportunity by geography ($ thousand)

        12 Drivers, Challenges, and Opportunity/Restraints

        • 12.1 Market drivers
          • 12.2 Market challenges
            • 12.3 Impact of drivers and challenges
              • Impact of drivers and challenges in 2024 and 2029
            • 12.4 Market opportunities/restraints

              13 Competitive Landscape

              • 13.1 Overview
                • 13.2 Competitive Landscape
                  • Overview on criticality of inputs and factors of differentiation
                • 13.3 Landscape disruption
                  • Overview on factors of disruption
                • 13.4 Industry risks
                  • Impact of key risks on business

                14 Competitive Analysis

                • 14.1 Companies profiled
                  • Companies covered
                • 14.2 Company ranking index
                  • Company ranking index
                • 14.3 Market positioning of companies
                  • Matrix on companies position and classification
                • 14.4 Allm Inc.
                  • Allm Inc. - Overview
                  • Allm Inc. - Product / Service
                  • Allm Inc. - Key offerings
                  • SWOT
                • 14.5 Carl Zeiss AG
                  • Carl Zeiss AG - Overview
                  • Carl Zeiss AG - Product / Service
                  • Carl Zeiss AG - Key news
                  • Carl Zeiss AG - Key offerings
                  • SWOT
                • 14.6 Epipole Ltd.
                  • Epipole Ltd. - Overview
                  • Epipole Ltd. - Product / Service
                  • Epipole Ltd. - Key offerings
                  • SWOT
                • 14.7 Hongdee Ophthalmic Equipment
                  • Hongdee Ophthalmic Equipment - Overview
                  • Hongdee Ophthalmic Equipment - Product / Service
                  • Hongdee Ophthalmic Equipment - Key offerings
                  • SWOT
                • 14.8 Kody Medical Electronics Pvt. Ltd.
                  • Kody Medical Electronics Pvt. Ltd. - Overview
                  • Kody Medical Electronics Pvt. Ltd. - Product / Service
                  • Kody Medical Electronics Pvt. Ltd. - Key offerings
                  • SWOT
                • 14.9 NEW VISION
                  • NEW VISION - Overview
                  • NEW VISION - Product / Service
                  • NEW VISION - Key offerings
                  • SWOT
                • 14.10 Optitech Eye Care
                  • Optitech Eye Care - Overview
                  • Optitech Eye Care - Product / Service
                  • Optitech Eye Care - Key offerings
                  • SWOT
                • 14.11 Optomed Oyj
                  • Optomed Oyj - Overview
                  • Optomed Oyj - Product / Service
                  • Optomed Oyj - Key offerings
                  • SWOT
                • 14.12 PHELCOM
                  • PHELCOM - Overview
                  • PHELCOM - Product / Service
                  • PHELCOM - Key offerings
                  • SWOT
                • 14.13 Remidio Innovative Solutions Pvt. Ltd.
                  • Remidio Innovative Solutions Pvt. Ltd. - Overview
                  • Remidio Innovative Solutions Pvt. Ltd. - Product / Service
                  • Remidio Innovative Solutions Pvt. Ltd. - Key offerings
                  • SWOT
                • 14.14 Topcon Corp.
                  • Topcon Corp. - Overview
                  • Topcon Corp. - Business segments
                  • Topcon Corp. - Key offerings
                  • Topcon Corp. - Segment focus
                  • SWOT
                • 14.15 Volk Optical
                  • Volk Optical - Overview
                  • Volk Optical - Product / Service
                  • Volk Optical - Key offerings
                  • SWOT

                15 Appendix

                • 15.1 Scope of the report
                  • 15.2 Inclusions and exclusions checklist
                    • Inclusions checklist
                    • Exclusions checklist
                  • 15.3 Currency conversion rates for US$
                    • Currency conversion rates for US$
                  • 15.4 Research methodology
                    • Research methodology
                  • 15.5 Data procurement
                    • Information sources
                  • 15.6 Data validation
                    • Data validation
                  • 15.7 Validation techniques employed for market sizing
                    • Validation techniques employed for market sizing
                  • 15.8 Data synthesis
                    • Data synthesis
                  • 15.9 360 degree market analysis
                    • 360 degree market analysis
                  • 15.10 List of abbreviations
                    • List of abbreviations

                  Research Methodology

                  Technavio presents a detailed picture of the market by way of study, synthesis, and summation of data from multiple sources. The analysts have presented the various facets of the market with a particular focus on identifying the key industry influencers. The data thus presented is comprehensive, reliable, and the result of extensive research, both primary and secondary.

                  INFORMATION SOURCES

                  Primary sources

                  • Manufacturers and suppliers
                  • Channel partners
                  • Industry experts
                  • Strategic decision makers

                  Secondary sources

                  • Industry journals and periodicals
                  • Government data
                  • Financial reports of key industry players
                  • Historical data
                  • Press releases

                  DATA ANALYSIS

                  Data Synthesis

                  • Collation of data
                  • Estimation of key figures
                  • Analysis of derived insights

                  Data Validation

                  • Triangulation with data models
                  • Reference against proprietary databases
                  • Corroboration with industry experts

                  REPORT WRITING

                  Qualitative

                  • Market drivers
                  • Market challenges
                  • Market trends
                  • Five forces analysis

                  Quantitative

                  • Market size and forecast
                  • Market segmentation
                  • Geographical insights
                  • Competitive landscape

                  Interested in this report?

                  Get your sample now to see our research methodology and insights!

                  Download Now

                  Frequently Asked Questions

                  Non-Mydriatic Handheld Fundus Camera market growth will increase by $ 49633 thousand during 2025-2029.

                  The Non-Mydriatic Handheld Fundus Camera market is expected to grow at a CAGR of 7.1% during 2025-2029.

                  Non-Mydriatic Handheld Fundus Camera market is segmented by Distribution Channel( Offline, Online) End-user( Hospitals and clinics, Ambulatory surgical centers, Others)

                  Allm Inc., Carl Zeiss AG, Epipole Ltd., Hongdee Ophthalmic Equipment, Kody Medical Electronics Pvt. Ltd., NEW VISION, Optitech Eye Care, Optomed Oyj, PHELCOM, Remidio Innovative Solutions Pvt. Ltd., Topcon Corp., Volk Optical are a few of the key vendors in the Non-Mydriatic Handheld Fundus Camera market.

                  North America will register the highest growth rate of 43% among the other regions. Therefore, the Non-Mydriatic Handheld Fundus Camera market in North America is expected to garner significant business opportunities for the vendors during the forecast period.

                  US, Germany, Japan, China, India, UK, France, Brazil, South Korea, Italy

                  • Rising prevalence of eye disordersThe global non-mydriatic handheld fundus camera market is significantly driven by the rising prevalence of eye disorders. Increasing cases of conditions such as diabetic retinopathy is the driving factor this market.
                  • glaucoma is the driving factor this market.
                  • and age-related macular degeneration (AMD) are fueling the demand for early detection and continuous monitoring is the driving factor this market.
                  • which are crucial for effective management and treatment.As of 2023 is the driving factor this market.
                  • the World Health Organization (WHO) reported that approximately 2.2 billion people worldwide had suffered from near or distant vision impairment. Alarmingly is the driving factor this market.
                  • 1 billion of these cases were either preventable or undiagnosed. Among the primary causes of distance vision impairment or blindness is the driving factor this market.
                  • age-related macular degeneration had affected 8 million people is the driving factor this market.
                  • glaucoma had impacted 7.7 million is the driving factor this market.
                  • and diabetic retinopathy had been responsible for 3.9 million cases. These statistics underscore the urgent need for advanced diagnostic tools that can facilitate early detection and intervention.Non-mydriatic handheld fundus cameras are particularly well-suited to meet this need. These devices allow for quick is the driving factor this market.
                  • non-invasive retinal imaging without the requirement for pupil dilation is the driving factor this market.
                  • making them ideal for routine screenings and monitoring in various healthcare settings. Their portability and ease of use enable healthcare providers to conduct comprehensive eye exams efficiently is the driving factor this market.
                  • even in remote or underserved areas.The increasing prevalence of eye disorders is driving healthcare systems to prioritize early detection and preventive care. Non-mydriatic handheld fundus cameras play a vital role in this shift by providing reliable and accessible diagnostic solutions. These devices support the early identification of retinal changes associated with conditions like diabetic retinopathy is the driving factor this market.
                  • glaucoma is the driving factor this market.
                  • and AMD is the driving factor this market.
                  • allowing for timely intervention and better patient outcomes.In summary is the driving factor this market.
                  • the rising prevalence of eye disorders is a key driver of the global non-mydriatic handheld fundus camera market. The growing need for early detection and continuous monitoring of conditions such as diabetic retinopathy is the driving factor this market.
                  • glaucoma is the driving factor this market.
                  • and AMD is propelling the demand for advanced retinal imaging solutions. As healthcare systems increasingly focus on preventive care is the driving factor this market.
                  • the adoption of non-mydriatic handheld fundus cameras is expected to continue to rise is the driving factor this market.
                  • supporting improved eye health outcomes worldwide. is the driving factor this market.

                  The Non-Mydriatic Handheld Fundus Camera market vendors should focus on grabbing business opportunities from the Offline segment as it accounted for the largest market share in the base year.
                  RIA - Research AI Assistant
                  Ask RIA