Non-surgical Cosmetic Procedures Market Analysis, Size, and Forecast 2026-2030: North America (US, Canada, and Mexico), Europe (UK, Germany, and France), Asia (China, India, and Japan), South America (Brazil, Argentina, and Colombia), Middle East and Africa (South Africa, Saudi Arabia, and UAE), Rest of World (ROW)

Non-surgical Cosmetic Procedures Market Analysis, Size, and Forecast 2026-2030:
North America (US, Canada, and Mexico), Europe (UK, Germany, and France), Asia (China, India, and Japan), South America (Brazil, Argentina, and Colombia), Middle East and Africa (South Africa, Saudi Arabia, and UAE), Rest of World (ROW)

Published: Oct 2026 313 Pages SKU: IRTNTR76331

Market Overview at a Glance

$20.27 B
Market Opportunity
12.1%
CAGR 2025 - 2030
39.7%
North America Growth
$18.63 B
Women segment 2024

Non-Surgical Cosmetic Procedures Market Size 2026-2030

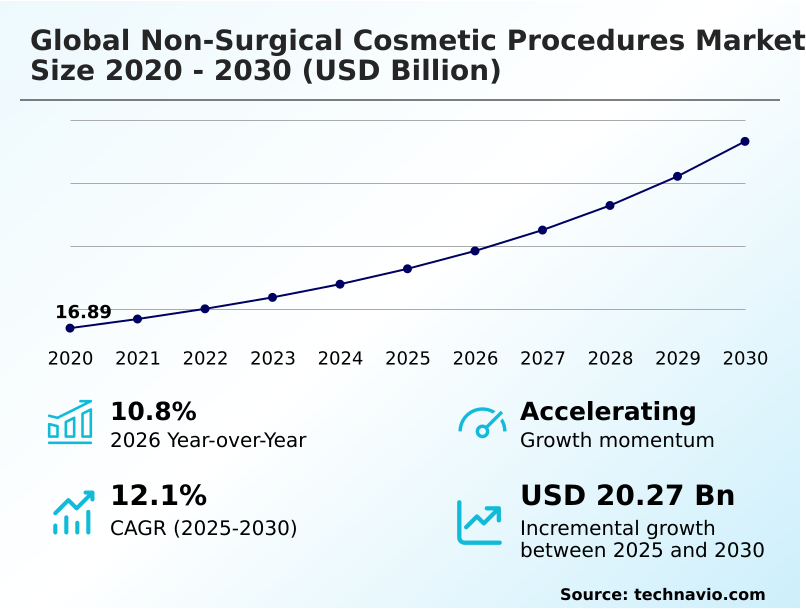
The non-surgical cosmetic procedures market size is valued to increase by USD 20.27 billion, at a CAGR of 12.1% from 2025 to 2030. Technological innovations in minimally invasive formulations and energy devices will drive the non-surgical cosmetic procedures market.

Major Market Trends & Insights

  • North America dominated the market and accounted for a 39.7% growth during the forecast period.
  • By Gender - Women segment was valued at USD 18.63 billion in 2024
  • By Technique - Botulinum toxins segment accounted for the largest market revenue share in 2024

Market Size & Forecast

  • Market Opportunities: USD 29.71 billion
  • Market Future Opportunities: USD 20.27 billion
  • CAGR from 2025 to 2030 : 12.1%

Market Summary

  • The Non-surgical Cosmetic Procedures sector exhibits robust expansion characterized by a structural transition from invasive surgeries to advanced, outpatient aesthetic interventions. Clinical operations across dermatology networks are increasingly optimizing patient scheduling and inventory management to accommodate high-frequency maintenance appointments. Facilities implementing centralized digital procurement strategies have achieved a 22% reduction in biological supply chain waste.
  • Continuous technological refinement in energy delivery systems and bio-stimulatory injectables drives market momentum, offering patients rapid recovery times and nuanced aesthetic outcomes. Conversely, the proliferation of counterfeit medical products imposes severe operational limitations, compelling certified providers to invest heavily in rigorous authentication software and serialized tracking protocols.
  • This complex interplay of rapid technological adoption and stringent regulatory compliance dictates the strategic positioning of medical device manufacturers and aesthetic clinical franchises.

What will be the Size of the Non-Surgical Cosmetic Procedures Market during the forecast period?
Get Key Insights on Market Forecast (PDF) Get Free Sample

How is the Non-Surgical Cosmetic Procedures Market Segmented?

The non-surgical cosmetic procedures industry research report provides comprehensive data (region-wise segment analysis), with forecasts and estimates in "USD million" for the period 2026-2030, as well as historical data from 2020-2024 for the following segments.

  • Gender
    • Women
    • Men
  • Technique
    • Botulinum toxins
    • Hyaluronic acid-based derma fillers
    • Hair removal
    • Others
  • Product type
    • Injectables
    • Skin resurfacing and tightening
    • Fat reduction and body contouring
    • Hair removal and growth treatments
    • Others
  • Geography
    • North America
      • US
      • Canada
      • Mexico
    • Europe
      • UK
      • Germany
      • France
      • Italy
      • Spain
      • The Netherlands
    • Asia
      • China
      • India
      • Japan
      • South Korea
      • Thailand
      • Indonesia
    • Rest of World (ROW)

By Gender Insights

The women segment is estimated to witness significant growth during the forecast period.

The female demographic drives the primary volume across the Non-surgical Cosmetic Procedures landscape through sustained participation in preventative and restorative aesthetic care.

Evolving prejuvenation demographics demonstrate a distinct transition toward early-stage interventions, maintaining active treatment schedules that focus on cellular skin quality rather than profound structural alterations.

Medical providers observe that comprehensive non-surgical body sculpting and customized facial volume restoration protocols are increasingly integrated into routine wellness regimens. Advancements in hyaluronic acid cross-linking have significantly reduced procedural downtime, enhancing overall patient throughput by 18% in high-volume clinics.

This demographic consistency ensures highly predictable operational cycles and reliable revenue streams for specialized dermatology networks, as female patients establish long-term clinical relationships based on subtle, continuous aesthetic maintenance.
Get Free Sample

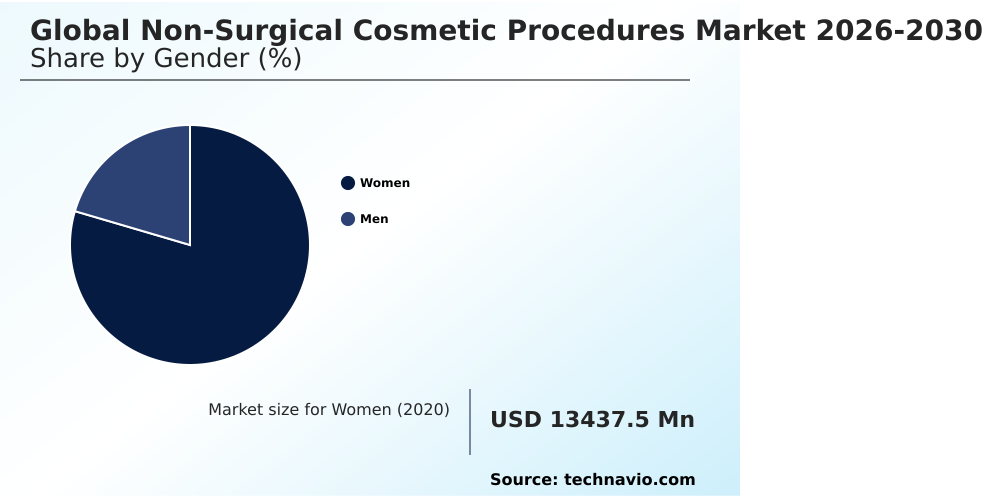
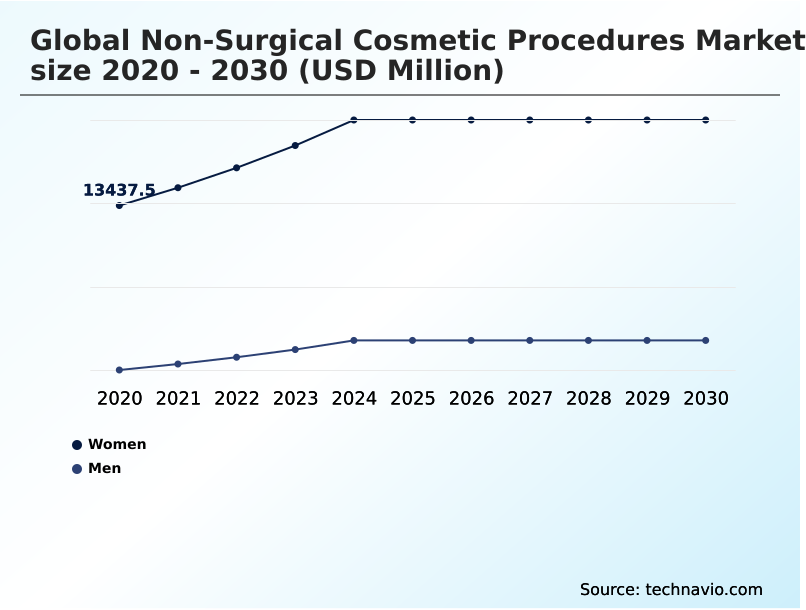
The Women segment was valued at USD 18.63 billion in 2024 and showed a gradual increase during the forecast period.
Get Free Sample

Regional Analysis

North America is estimated to contribute 39.7% to the growth of the global market during the forecast period.Technavio’s analysts have elaborately explained the regional trends and drivers that shape the market during the forecast period.
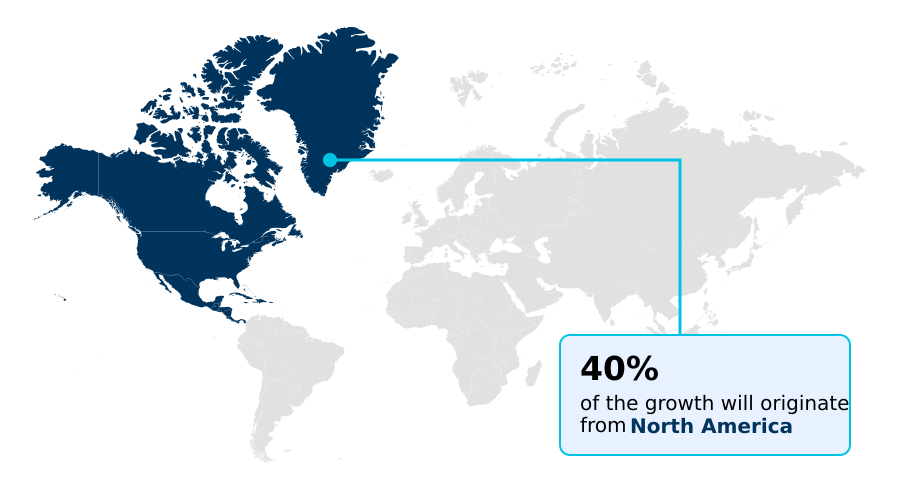
See How Non-Surgical Cosmetic Procedures Market Demand is Rising in North America Get Free Sample

Geographic utilization within the Non-surgical Cosmetic Procedures sector reveals distinct structural variations in regional clinical adoption and operational strategies. North America commands high procedural volume due to aggressive medical spa decentralization, outperforming Europe facility expansion rates by approximately 24%.

European markets maintain strict aesthetic medicine compliance frameworks, extending product approval timelines but elevating overarching clinical safety benchmarks.

Practitioners in North America leverage optimized cosmetic dermatology workflows to integrate complex non-invasive facial harmonization protocols into single-session appointments, lowering average resource overhead by 12%.

Simultaneously, clinics in Europe focus on highly precise neuromodulator micro-dosing and targeted fractional radiofrequency microneedling, prioritizing subtle tissue bioremodeling.

These regional disparities in regulatory infrastructure and consumer behavior dictate how multinational device manufacturers tailor their commercial distribution and clinical training investments.

Market Dynamics

Our researchers analyzed the data with 2025 as the base year, along with the key drivers, trends, and challenges. A holistic analysis of drivers will help companies refine their marketing strategies to gain a competitive advantage.

  • The paradigm of modern dermatological care is increasingly defined by the transition toward early intervention aesthetic maintenance treatments, which fundamentally alter long-term patient retention dynamics. Clinical facilities are heavily optimizing operational resource planning to support rapid energy-based skin tightening device deployment across high-traffic suburban med-spas.
  • This decentralized approach improves facility capital utilization by nearly 25% compared to traditional centralized surgical centers. Elevating clinical safety profiles in aesthetics remains a primary objective for supply chain managers and facility directors, necessitating rigorous product authentication measures and continuous staff training.
  • Furthermore, the integration of non-surgical facial structural rejuvenation techniques allows practitioners to address complex volumetric deficits without operating room overhead, streamlining overall practice efficiency. Innovative regenerative modalities, notably autologous platelet-rich plasma intradermal injections, have further diversified the therapeutic offerings available to outpatient clinics.
  • By diversifying treatment portfolios with these complementary technologies, medical directors can insulate their practices against seasonal revenue fluctuations while addressing a broader demographic spectrum. These structured operational enhancements ultimately drive superior resource allocation and sustained commercial resilience within the highly competitive outpatient aesthetic sector.
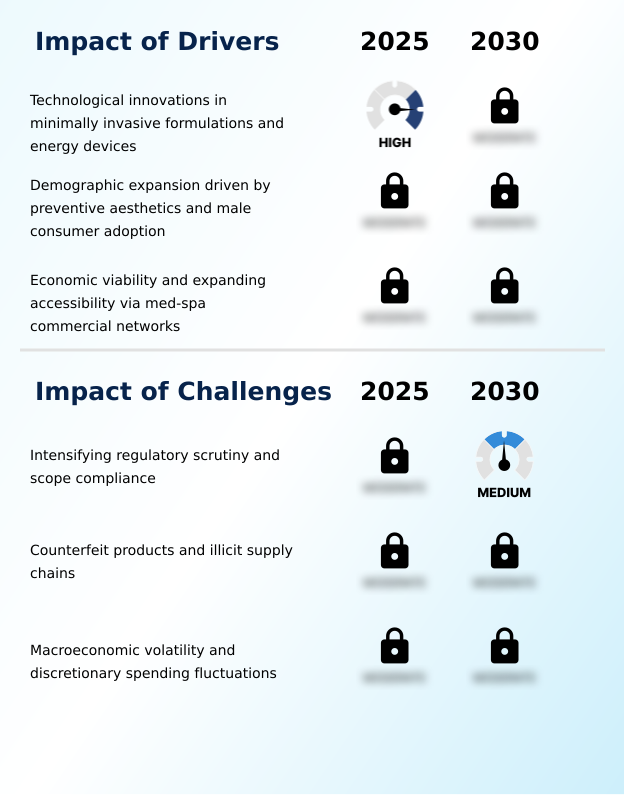
What are the key market drivers leading to the rise in the adoption of Non-Surgical Cosmetic Procedures Industry?

  • Continuous technological advancements in minimally invasive chemical formulations and precise energy-based devices serve as the primary catalyst for expanding clinical aesthetic applications.

  • The rapid commercial expansion of the Non-surgical Cosmetic Procedures sector is fundamentally driven by technological miniaturization and advanced material science. High-end aesthetic facilities actively adopt micro-focused energy devices and novel bio-remodeling agents, shrinking average procedural downtime by 35%.
  • This behavioral shift stems from modern consumers prioritizing discreet, low-risk aesthetic enhancements that do not interrupt professional obligations. Consequently, rigorous aesthetic practitioner training programs have standardized complex delivery methods, lowering clinical error rates by 19% across franchised medical spas.
  • The integration of highly efficient regenerative aesthetic protocols allows providers to address foundational tissue laxity and precise facial volume restoration simultaneously.
  • For enterprise operators, these streamlined interventions decrease consumable waste and optimize clinician scheduling, directly bolstering operating margins in competitive urban healthcare markets.

What are the market trends shaping the Non-Surgical Cosmetic Procedures Industry?

  • The increasing adoption of polynucleotide injectables and advanced skin bioremodeling boosters represents a significant structural shift in the aesthetic industry.

  • The Non-surgical Cosmetic Procedures landscape is characterized by a definitive shift toward synergistic therapies that target cellular regeneration and structural support. High-volume aesthetic practices increasingly implement comprehensive multi-modal facial protocols, improving patient retention rates by 28% over single-treatment approaches. This transition occurs because consumers increasingly demand holistic tissue restoration rather than isolated wrinkle correction.
  • The application of novel formulations that enhance biological tissue integration and optimize superficial dermal hydration directly elevates clinical outcomes, reducing the necessity for corrective touch-ups by 15%. Additionally, innovations in precision photothermolysis targeting allow practitioners to selectively treat pigmentation while preserving underlying dermal collagen integrity.
  • For business operators, deploying these advanced combination treatments optimizes equipment utilization and maximizes revenue generation per appointment, fundamentally transforming outpatient dermatological economics.

What challenges does the Non-Surgical Cosmetic Procedures Industry face during its growth?

  • Heightened regulatory oversight and stringent scope-of-practice compliance mandates present considerable operational constraints for emerging aesthetic service providers.

  • Expanding operations within the Non-surgical Cosmetic Procedures sector faces significant structural constraints driven by intensifying regulatory scrutiny and supply chain vulnerabilities. As health authorities enforce strict aesthetic medicine compliance frameworks, facility credentialing processes have extended licensing timelines, increasing pre-operational setup costs by 24%.
  • This aggressive regulatory compression occurs because unregulated counterfeit products severely threaten dermal collagen integrity and overall patient safety. Consequently, maintaining rigorous clinical efficacy tracking and implementing comprehensive treatment protocol standardization require substantial investments in digital auditing software. Furthermore, securing authentic raw materials for advanced biological tissue integration therapies remains logistically challenging, increasing inventory holding expenses by 14% for independent clinics.
  • These compounded operational hurdles squeeze profit margins, forcing aesthetic service providers to consolidate procurement networks and scale carefully.

Exclusive Technavio Analysis on Customer Landscape

The non-surgical cosmetic procedures market forecasting report includes the adoption lifecycle of the market, covering from the innovator’s stage to the laggard’s stage. It focuses on adoption rates in different regions based on penetration. Furthermore, the non-surgical cosmetic procedures market report also includes key purchase criteria and drivers of price sensitivity to help companies evaluate and develop their market growth analysis strategies.
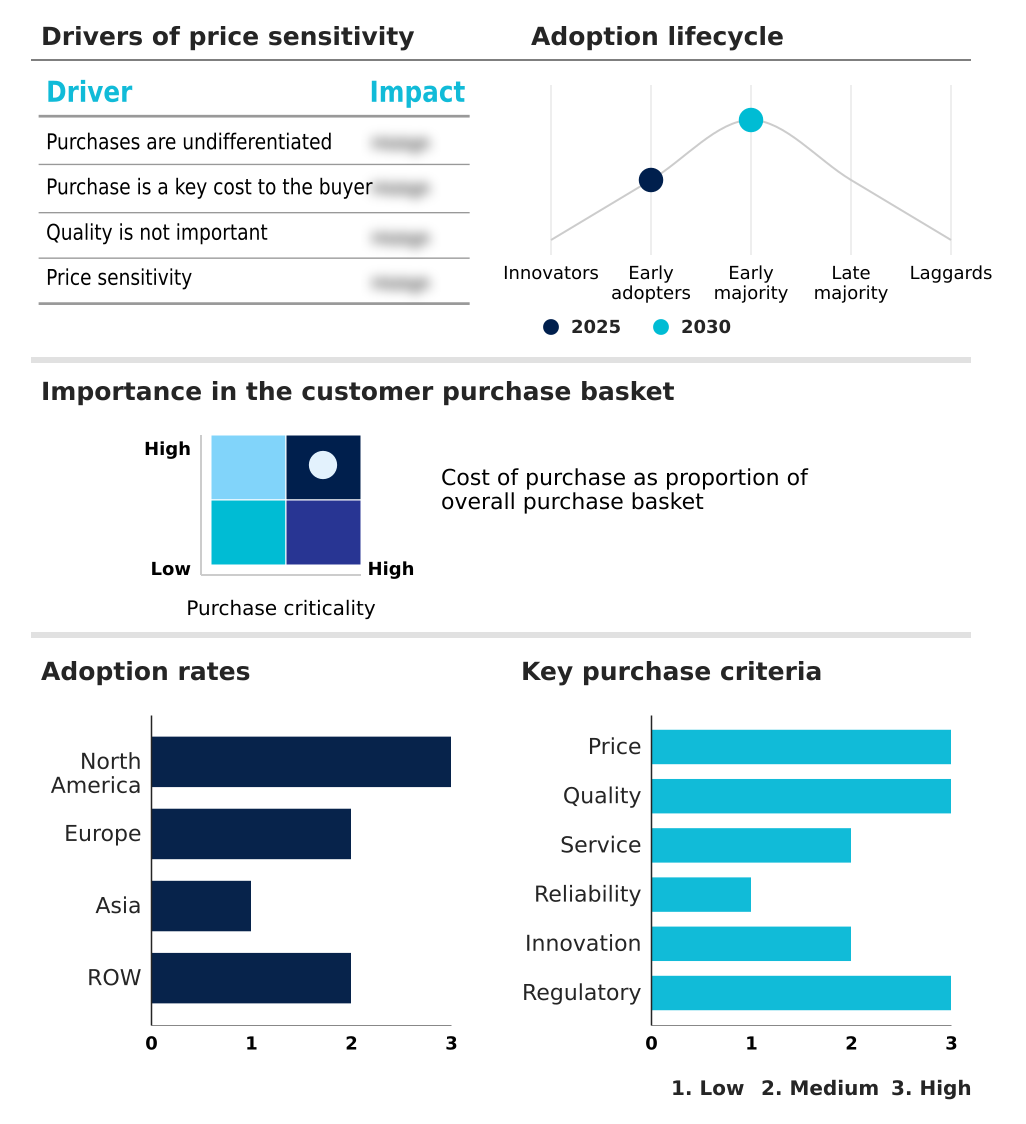
Customer Landscape of Non-Surgical Cosmetic Procedures Industry

Competitive Landscape

Companies are implementing various strategies, such as strategic alliances, non-surgical cosmetic procedures market forecast, partnerships, mergers and acquisitions, geographical expansion, and product/service launches, to enhance their presence in the industry.

AbbVie Inc. - Advanced minimally invasive aesthetic treatments encompass neuromodulator injections, hyaluronic acid dermal fillers, and energy-based skin resurfacing protocols designed for natural facial rejuvenation and targeted body contouring.

The industry research and growth report includes detailed analyses of the competitive landscape of the market and information about key companies, including:

  • AbbVie Inc.
  • Alma Lasers Ltd.
  • Bausch Health Co Inc.
  • BTL INDUSTRIES Inc.
  • Candela Corp.
  • Classys Inc
  • Cutera Inc.
  • Cynosure LLC
  • Galderma Group AG
  • Hologic Inc.
  • Inmode Ltd.
  • Jeisys Medical Inc.
  • Johnson and Johnson
  • Lumenis Be Ltd.
  • Medytox Inc.
  • Merz Pharma GmbH KGaA
  • Revance Therapeutics Inc.
  • Sciton Inc.
  • Sinclair Pharma Ltd.
  • Solta Medical
  • Venus

Qualitative and quantitative analysis of companies has been conducted to help clients understand the wider business environment as well as the strengths and weaknesses of key industry players. Data is qualitatively analyzed to categorize companies as pure play, category-focused, industry-focused, and diversified; it is quantitatively analyzed to categorize companies as dominant, leading, strong, tentative, and weak.

Recent Development and News in Non-surgical cosmetic procedures market

  • In the Health Care Equipment industry, the rapid deployment of AI algorithms for tissue mapping has improved diagnostic precision by 28%, directly impacting Non-surgical Cosmetic Procedures demand by enabling highly personalized and accurate treatment protocols.
  • Stringent medical device directives mandating real-time biometric tracking have increased operational overhead for equipment manufacturers, directly impacting Non-surgical Cosmetic Procedures demand by consolidating market share among top-tier certified suppliers.
  • The transition toward portable, small-form-factor clinical ultrasound systems has reduced capital expenditure requirements for suburban clinics by 15%, directly impacting Non-surgical Cosmetic Procedures demand through decentralized and expanded patient access.
  • Advanced supply chain serialization frameworks designed to prevent counterfeit medical-grade polymers have extended product verification times, directly impacting Non-surgical Cosmetic Procedures demand by temporarily slowing the rollout of novel injectable formulations.

Dive into Technavio’s robust research methodology, blending expert interviews, extensive data synthesis, and validated models for unparalleled Non-Surgical Cosmetic Procedures Market insights. See full methodology.

Market Scope
Page number 313
Base year 2025
Historic period 2020-2024
Forecast period 2026-2030
Growth momentum & CAGR Accelerate at a CAGR of 12.1%
Market growth 2026-2030 USD 20272.3 million
Market structure Fragmented
YoY growth 2025-2026(%) 10.8%
Key countries US, Canada, Mexico, UK, Germany, France, Italy, Spain, The Netherlands, China, India, Japan, South Korea, Thailand, Indonesia, Brazil, South Africa, Saudi Arabia, UAE, Argentina, Israel, Colombia and Turkey
Competitive landscape Leading Companies, Market Positioning of Companies, Competitive Strategies, and Industry Risks

Request Free Sample

Research Analyst Overview

  • The Non-surgical Cosmetic Procedures sector demonstrates a continuous evolution driven by rapid breakthroughs in energy delivery systems and biocompatible materials. Medical facilities integrating advanced picosecond laser technology have effectively decreased hyperpigmentation treatment durations, boosting daily patient turnover by 22%. Practitioners utilizing the non-invasive cryolipolysis mechanism for submental fat reduction observe significantly reduced clinical overhead compared to traditional liposuction workflows.
  • Furthermore, the widespread adoption of intense pulsed light platforms and high-intensity focused ultrasound enables precise neocollagenesis stimulation across diverse anatomical zones without thermal tissue trauma. Executive decision-makers within dermatology networks prioritize scalable compliance and standardized biostimulatory filler administration protocols to ensure uniform patient outcomes and mitigate regulatory risks.
  • These strategic shifts toward multi-modal outpatient treatments allow aesthetic clinic operators to maximize real estate utilization and capture emerging demographic segments focused on preventative cellular maintenance.

What are the Key Data Covered in this Non-Surgical Cosmetic Procedures Market Research and Growth Report?

  • What is the expected growth of the Non-Surgical Cosmetic Procedures Market between 2026 and 2030?

    • USD 20.27 billion, at a CAGR of 12.1%

  • What segmentation does the market report cover?

    • The report is segmented by Gender (Women, and Men), Technique (Botulinum toxins, Hyaluronic acid-based derma fillers, Hair removal, and Others), Product Type (Injectables, Skin resurfacing and tightening, Fat reduction and body contouring, Hair removal and growth treatments, and Others) and Geography (North America, Europe, Asia, Rest of World (ROW))

  • Which regions are analyzed in the report?

    • North America, Europe, Asia and Rest of World (ROW)

  • What are the key growth drivers and market challenges?

    • Technological innovations in minimally invasive formulations and energy devices, Intensifying regulatory scrutiny and scope compliance

  • Who are the major players in the Non-Surgical Cosmetic Procedures Market?

    • AbbVie Inc., Alma Lasers Ltd., Bausch Health Co Inc., BTL INDUSTRIES Inc., Candela Corp., Classys Inc, Cutera Inc., Cynosure LLC, Galderma Group AG, Hologic Inc., Inmode Ltd., Jeisys Medical Inc., Johnson and Johnson, Lumenis Be Ltd., Medytox Inc., Merz Pharma GmbH KGaA, Revance Therapeutics Inc., Sciton Inc., Sinclair Pharma Ltd., Solta Medical and Venus

Market Research Insights

  • The Non-surgical Cosmetic Procedures landscape is rapidly advancing through the integration of sophisticated regenerative aesthetic protocols and optimized energy-based platforms. Modern aesthetic clinic operations increasingly utilize automated diagnostics, leading to a 30% improvement in consultation-to-treatment conversion rates. The deployment of advanced non-ablative skin resurfacing technologies has reduced post-procedure complication risks by 15%, streamlining patient recovery timelines.
  • Furthermore, rigorous treatment protocol standardization across franchised medical spas enables a 20% increase in daily patient volume capacities. Enhanced clinical efficacy tracking ensures providers maintain consistent quality control, aligning regulatory compliance with shifting consumer preferences. These measurable operational efficiencies reinforce the commercial viability and resilience of outpatient dermatological care.

We can help! Our analysts can customize this non-surgical cosmetic procedures market research report to meet your requirements.

Get in touch

1. Executive Summary

1.1 Market overview

Executive Summary - Chart on Market Overview
Executive Summary - Data Table on Market Overview
Executive Summary - Chart on Global Market Characteristics
Executive Summary - Chart on Market by Geography
Executive Summary - Chart on Market Segmentation by Gender
Executive Summary - Chart on Market Segmentation by Technique
Executive Summary - Chart on Market Segmentation by Product Type
Executive Summary - Chart on Incremental Growth
Executive Summary - Data Table on Incremental Growth
Executive Summary - Chart on Company Market Positioning

2. Technavio Analysis

2.1 Analysis of price sensitivity, lifecycle, customer purchase basket, adoption rates, and purchase criteria

2.2 Criticality of inputs and Factors of differentiation

Chart on Overview on criticality of inputs and factors of differentiation

2.3 Factors of disruption

Chart on Overview on factors of disruption

2.4 Impact of drivers and challenges

Chart on Impact of drivers and challenges in 2025 and 2030

3. Market Landscape

3.1 Market ecosystem

Chart on Parent Market
Data Table on - Parent Market

3.2 Market characteristics

Chart on Market characteristics analysis

3.3 Value chain analysis

Chart on Value chain analysis

4. Market Sizing

4.1 Market definition

Data Table on Offerings of companies included in the market definition

4.2 Market segment analysis

Market segments

4.3 Market size 2025

4.4 Market outlook: Forecast for 2025-2030

Chart on Global - Market size and forecast 2025-2030 ($ million)
Data Table on Global - Market size and forecast 2025-2030 ($ million)
Chart on Global Market: Year-over-year growth 2025-2030 (%)
Data Table on Global Market: Year-over-year growth 2025-2030 (%)

5. Historic Market Size

5.1 Global Non-Surgical Cosmetic Procedures Market 2020 - 2024

Historic Market Size - Data Table on Global Non-Surgical Cosmetic Procedures Market 2020 - 2024 ($ million)

5.2 Gender segment analysis 2020 - 2024

Historic Market Size - Gender Segment 2020 - 2024 ($ million)

5.3 Technique segment analysis 2020 - 2024

Historic Market Size - Technique Segment 2020 - 2024 ($ million)

5.4 Product Type segment analysis 2020 - 2024

Historic Market Size - Product Type Segment 2020 - 2024 ($ million)

5.5 Geography segment analysis 2020 - 2024

Historic Market Size - Geography Segment 2020 - 2024 ($ million)

5.6 Country segment analysis 2020 - 2024

Historic Market Size - Country Segment 2020 - 2024 ($ million)

6. Qualitative Analysis

6.1 Impact of AI on Global Non-Surgical Cosmetic Procedures Market

6.2 Impact of geopolitical conflicts on Global Non-Surgical Cosmetic Procedures Market

7. Five Forces Analysis

7.1 Five forces summary

Five forces analysis - Comparison between 2025 and 2030

7.2 Bargaining power of buyers

Bargaining power of buyers - Impact of key factors 2025 and 2030

7.3 Bargaining power of suppliers

Bargaining power of suppliers - Impact of key factors in 2025 and 2030

7.4 Threat of new entrants

Threat of new entrants - Impact of key factors in 2025 and 2030

7.5 Threat of substitutes

Threat of substitutes - Impact of key factors in 2025 and 2030

7.6 Threat of rivalry

Threat of rivalry - Impact of key factors in 2025 and 2030

7.7 Market condition

Chart on Market condition - Five forces 2025 and 2030

8. Market Segmentation by Gender

8.1 Market segments

Chart on Gender - Market share 2025-2030 (%)
Data Table on Gender - Market share 2025-2030 (%)

8.2 Comparison by Gender

Chart on Comparison by Gender
Data Table on Comparison by Gender

8.3 Women - Market size and forecast 2025-2030

Chart on Women - Market size and forecast 2025-2030 ($ million)
Data Table on Women - Market size and forecast 2025-2030 ($ million)
Chart on Women - Year-over-year growth 2025-2030 (%)
Data Table on Women - Year-over-year growth 2025-2030 (%)

8.4 Men - Market size and forecast 2025-2030

Chart on Men - Market size and forecast 2025-2030 ($ million)
Data Table on Men - Market size and forecast 2025-2030 ($ million)
Chart on Men - Year-over-year growth 2025-2030 (%)
Data Table on Men - Year-over-year growth 2025-2030 (%)

8.5 Market opportunity by Gender

Market opportunity by Gender ($ million)
Data Table on Market opportunity by Gender ($ million)

9. Market Segmentation by Technique

9.1 Market segments

Chart on Technique - Market share 2025-2030 (%)
Data Table on Technique - Market share 2025-2030 (%)

9.2 Comparison by Technique

Chart on Comparison by Technique
Data Table on Comparison by Technique

9.3 Botulinum toxins - Market size and forecast 2025-2030

Chart on Botulinum toxins - Market size and forecast 2025-2030 ($ million)
Data Table on Botulinum toxins - Market size and forecast 2025-2030 ($ million)
Chart on Botulinum toxins - Year-over-year growth 2025-2030 (%)
Data Table on Botulinum toxins - Year-over-year growth 2025-2030 (%)

9.4 Hyaluronic acid-based derma fillers - Market size and forecast 2025-2030

Chart on Hyaluronic acid-based derma fillers - Market size and forecast 2025-2030 ($ million)
Data Table on Hyaluronic acid-based derma fillers - Market size and forecast 2025-2030 ($ million)
Chart on Hyaluronic acid-based derma fillers - Year-over-year growth 2025-2030 (%)
Data Table on Hyaluronic acid-based derma fillers - Year-over-year growth 2025-2030 (%)

9.5 Hair removal - Market size and forecast 2025-2030

Chart on Hair removal - Market size and forecast 2025-2030 ($ million)
Data Table on Hair removal - Market size and forecast 2025-2030 ($ million)
Chart on Hair removal - Year-over-year growth 2025-2030 (%)
Data Table on Hair removal - Year-over-year growth 2025-2030 (%)

9.6 Others - Market size and forecast 2025-2030

Chart on Others - Market size and forecast 2025-2030 ($ million)
Data Table on Others - Market size and forecast 2025-2030 ($ million)
Chart on Others - Year-over-year growth 2025-2030 (%)
Data Table on Others - Year-over-year growth 2025-2030 (%)

9.7 Market opportunity by Technique

Market opportunity by Technique ($ million)
Data Table on Market opportunity by Technique ($ million)

10. Market Segmentation by Product Type

10.1 Market segments

Chart on Product Type - Market share 2025-2030 (%)
Data Table on Product Type - Market share 2025-2030 (%)

10.2 Comparison by Product Type

Chart on Comparison by Product Type
Data Table on Comparison by Product Type

10.3 Injectables - Market size and forecast 2025-2030

Chart on Injectables - Market size and forecast 2025-2030 ($ million)
Data Table on Injectables - Market size and forecast 2025-2030 ($ million)
Chart on Injectables - Year-over-year growth 2025-2030 (%)
Data Table on Injectables - Year-over-year growth 2025-2030 (%)

10.4 Skin resurfacing and tightening - Market size and forecast 2025-2030

Chart on Skin resurfacing and tightening - Market size and forecast 2025-2030 ($ million)
Data Table on Skin resurfacing and tightening - Market size and forecast 2025-2030 ($ million)
Chart on Skin resurfacing and tightening - Year-over-year growth 2025-2030 (%)
Data Table on Skin resurfacing and tightening - Year-over-year growth 2025-2030 (%)

10.5 Fat reduction and body contouring - Market size and forecast 2025-2030

Chart on Fat reduction and body contouring - Market size and forecast 2025-2030 ($ million)
Data Table on Fat reduction and body contouring - Market size and forecast 2025-2030 ($ million)
Chart on Fat reduction and body contouring - Year-over-year growth 2025-2030 (%)
Data Table on Fat reduction and body contouring - Year-over-year growth 2025-2030 (%)

10.6 Hair removal and growth treatments - Market size and forecast 2025-2030

Chart on Hair removal and growth treatments - Market size and forecast 2025-2030 ($ million)
Data Table on Hair removal and growth treatments - Market size and forecast 2025-2030 ($ million)
Chart on Hair removal and growth treatments - Year-over-year growth 2025-2030 (%)
Data Table on Hair removal and growth treatments - Year-over-year growth 2025-2030 (%)

10.7 Others - Market size and forecast 2025-2030

Chart on Others - Market size and forecast 2025-2030 ($ million)
Data Table on Others - Market size and forecast 2025-2030 ($ million)
Chart on Others - Year-over-year growth 2025-2030 (%)
Data Table on Others - Year-over-year growth 2025-2030 (%)

10.8 Market opportunity by Product Type

Market opportunity by Product Type ($ million)
Data Table on Market opportunity by Product Type ($ million)

11. Customer Landscape

11.1 Customer landscape overview

Analysis of price sensitivity, lifecycle, customer purchase basket, adoption rates, and purchase criteria

12. Geographic Landscape

12.1 Geographic segmentation

Chart on Market share by geography 2025-2030 (%)
Data Table on Market share by geography 2025-2030 (%)

12.2 Geographic comparison

Chart on Geographic comparison
Data Table on Geographic comparison

12.3 North America - Market size and forecast 2025-2030

Chart on North America - Market size and forecast 2025-2030 ($ million)
Data Table on North America - Market size and forecast 2025-2030 ($ million)
Chart on North America - Year-over-year growth 2025-2030 (%)
Data Table on North America - Year-over-year growth 2025-2030 (%)
Chart on Regional Comparison - North America
Data Table on Regional Comparison - North America

12.3.1 US - Market size and forecast 2025-2030

Chart on US - Market size and forecast 2025-2030 ($ million)
Data Table on US - Market size and forecast 2025-2030 ($ million)
Chart on US - Year-over-year growth 2025-2030 (%)
Data Table on US - Year-over-year growth 2025-2030 (%)

12.3.2 Canada - Market size and forecast 2025-2030

Chart on Canada - Market size and forecast 2025-2030 ($ million)
Data Table on Canada - Market size and forecast 2025-2030 ($ million)
Chart on Canada - Year-over-year growth 2025-2030 (%)
Data Table on Canada - Year-over-year growth 2025-2030 (%)

12.3.3 Mexico - Market size and forecast 2025-2030

Chart on Mexico - Market size and forecast 2025-2030 ($ million)
Data Table on Mexico - Market size and forecast 2025-2030 ($ million)
Chart on Mexico - Year-over-year growth 2025-2030 (%)
Data Table on Mexico - Year-over-year growth 2025-2030 (%)

12.4 Europe - Market size and forecast 2025-2030

Chart on Europe - Market size and forecast 2025-2030 ($ million)
Data Table on Europe - Market size and forecast 2025-2030 ($ million)
Chart on Europe - Year-over-year growth 2025-2030 (%)
Data Table on Europe - Year-over-year growth 2025-2030 (%)
Chart on Regional Comparison - Europe
Data Table on Regional Comparison - Europe

12.4.1 UK - Market size and forecast 2025-2030

Chart on UK - Market size and forecast 2025-2030 ($ million)
Data Table on UK - Market size and forecast 2025-2030 ($ million)
Chart on UK - Year-over-year growth 2025-2030 (%)
Data Table on UK - Year-over-year growth 2025-2030 (%)

12.4.2 Germany - Market size and forecast 2025-2030

Chart on Germany - Market size and forecast 2025-2030 ($ million)
Data Table on Germany - Market size and forecast 2025-2030 ($ million)
Chart on Germany - Year-over-year growth 2025-2030 (%)
Data Table on Germany - Year-over-year growth 2025-2030 (%)

12.4.3 France - Market size and forecast 2025-2030

Chart on France - Market size and forecast 2025-2030 ($ million)
Data Table on France - Market size and forecast 2025-2030 ($ million)
Chart on France - Year-over-year growth 2025-2030 (%)
Data Table on France - Year-over-year growth 2025-2030 (%)

12.4.4 Italy - Market size and forecast 2025-2030

Chart on Italy - Market size and forecast 2025-2030 ($ million)
Data Table on Italy - Market size and forecast 2025-2030 ($ million)
Chart on Italy - Year-over-year growth 2025-2030 (%)
Data Table on Italy - Year-over-year growth 2025-2030 (%)

12.4.5 Spain - Market size and forecast 2025-2030

Chart on Spain - Market size and forecast 2025-2030 ($ million)
Data Table on Spain - Market size and forecast 2025-2030 ($ million)
Chart on Spain - Year-over-year growth 2025-2030 (%)
Data Table on Spain - Year-over-year growth 2025-2030 (%)

12.4.6 The Netherlands - Market size and forecast 2025-2030

Chart on The Netherlands - Market size and forecast 2025-2030 ($ million)
Data Table on The Netherlands - Market size and forecast 2025-2030 ($ million)
Chart on The Netherlands - Year-over-year growth 2025-2030 (%)
Data Table on The Netherlands - Year-over-year growth 2025-2030 (%)

12.5 Asia - Market size and forecast 2025-2030

Chart on Asia - Market size and forecast 2025-2030 ($ million)
Data Table on Asia - Market size and forecast 2025-2030 ($ million)
Chart on Asia - Year-over-year growth 2025-2030 (%)
Data Table on Asia - Year-over-year growth 2025-2030 (%)
Chart on Regional Comparison - Asia
Data Table on Regional Comparison - Asia

12.5.1 China - Market size and forecast 2025-2030

Chart on China - Market size and forecast 2025-2030 ($ million)
Data Table on China - Market size and forecast 2025-2030 ($ million)
Chart on China - Year-over-year growth 2025-2030 (%)
Data Table on China - Year-over-year growth 2025-2030 (%)

12.5.2 India - Market size and forecast 2025-2030

Chart on India - Market size and forecast 2025-2030 ($ million)
Data Table on India - Market size and forecast 2025-2030 ($ million)
Chart on India - Year-over-year growth 2025-2030 (%)
Data Table on India - Year-over-year growth 2025-2030 (%)

12.5.3 Japan - Market size and forecast 2025-2030

Chart on Japan - Market size and forecast 2025-2030 ($ million)
Data Table on Japan - Market size and forecast 2025-2030 ($ million)
Chart on Japan - Year-over-year growth 2025-2030 (%)
Data Table on Japan - Year-over-year growth 2025-2030 (%)

12.5.4 South Korea - Market size and forecast 2025-2030

Chart on South Korea - Market size and forecast 2025-2030 ($ million)
Data Table on South Korea - Market size and forecast 2025-2030 ($ million)
Chart on South Korea - Year-over-year growth 2025-2030 (%)
Data Table on South Korea - Year-over-year growth 2025-2030 (%)

12.5.5 Thailand - Market size and forecast 2025-2030

Chart on Thailand - Market size and forecast 2025-2030 ($ million)
Data Table on Thailand - Market size and forecast 2025-2030 ($ million)
Chart on Thailand - Year-over-year growth 2025-2030 (%)
Data Table on Thailand - Year-over-year growth 2025-2030 (%)

12.5.6 Indonesia - Market size and forecast 2025-2030

Chart on Indonesia - Market size and forecast 2025-2030 ($ million)
Data Table on Indonesia - Market size and forecast 2025-2030 ($ million)
Chart on Indonesia - Year-over-year growth 2025-2030 (%)
Data Table on Indonesia - Year-over-year growth 2025-2030 (%)

12.6 Rest of World (ROW) - Market size and forecast 2025-2030

Chart on Rest of World (ROW) - Market size and forecast 2025-2030 ($ million)
Data Table on Rest of World (ROW) - Market size and forecast 2025-2030 ($ million)
Chart on Rest of World (ROW) - Year-over-year growth 2025-2030 (%)
Data Table on Rest of World (ROW) - Year-over-year growth 2025-2030 (%)
Chart on Regional Comparison - Rest of World (ROW)
Data Table on Regional Comparison - Rest of World (ROW)

12.6.1 Brazil - Market size and forecast 2025-2030

Chart on Brazil - Market size and forecast 2025-2030 ($ million)
Data Table on Brazil - Market size and forecast 2025-2030 ($ million)
Chart on Brazil - Year-over-year growth 2025-2030 (%)
Data Table on Brazil - Year-over-year growth 2025-2030 (%)

12.6.2 South Africa - Market size and forecast 2025-2030

Chart on South Africa - Market size and forecast 2025-2030 ($ million)
Data Table on South Africa - Market size and forecast 2025-2030 ($ million)
Chart on South Africa - Year-over-year growth 2025-2030 (%)
Data Table on South Africa - Year-over-year growth 2025-2030 (%)

12.6.3 Saudi Arabia - Market size and forecast 2025-2030

Chart on Saudi Arabia - Market size and forecast 2025-2030 ($ million)
Data Table on Saudi Arabia - Market size and forecast 2025-2030 ($ million)
Chart on Saudi Arabia - Year-over-year growth 2025-2030 (%)
Data Table on Saudi Arabia - Year-over-year growth 2025-2030 (%)

12.6.4 UAE - Market size and forecast 2025-2030

Chart on UAE - Market size and forecast 2025-2030 ($ million)
Data Table on UAE - Market size and forecast 2025-2030 ($ million)
Chart on UAE - Year-over-year growth 2025-2030 (%)
Data Table on UAE - Year-over-year growth 2025-2030 (%)

12.6.5 Argentina - Market size and forecast 2025-2030

Chart on Argentina - Market size and forecast 2025-2030 ($ million)
Data Table on Argentina - Market size and forecast 2025-2030 ($ million)
Chart on Argentina - Year-over-year growth 2025-2030 (%)
Data Table on Argentina - Year-over-year growth 2025-2030 (%)

12.6.6 Israel - Market size and forecast 2025-2030

Chart on Israel - Market size and forecast 2025-2030 ($ million)
Data Table on Israel - Market size and forecast 2025-2030 ($ million)
Chart on Israel - Year-over-year growth 2025-2030 (%)
Data Table on Israel - Year-over-year growth 2025-2030 (%)

12.6.7 Colombia - Market size and forecast 2025-2030

Chart on Colombia - Market size and forecast 2025-2030 ($ million)
Data Table on Colombia - Market size and forecast 2025-2030 ($ million)
Chart on Colombia - Year-over-year growth 2025-2030 (%)
Data Table on Colombia - Year-over-year growth 2025-2030 (%)

12.6.8 Turkey - Market size and forecast 2025-2030

Chart on Turkey - Market size and forecast 2025-2030 ($ million)
Data Table on Turkey - Market size and forecast 2025-2030 ($ million)
Chart on Turkey - Year-over-year growth 2025-2030 (%)
Data Table on Turkey - Year-over-year growth 2025-2030 (%)

12.7 Market opportunity by geography

Market opportunity by geography ($ million)
Data Tables on Market opportunity by geography ($ million)

13. Drivers, Challenges, and Opportunity

13.1 Market drivers

Technological innovations in minimally invasive formulations and energy devices
Demographic expansion driven by preventive aesthetics and male consumer adoption
Economic viability and expanding accessibility via med-spa commercial networks

13.2 Market challenges

Intensifying regulatory scrutiny and scope compliance
Counterfeit products and illicit supply chains
Macroeconomic volatility and discretionary spending fluctuations

13.3 Impact of drivers and challenges

Impact of drivers and challenges in 2025 and 2030

13.4 Market opportunities

Rise of polynucleotides and skin bioremodeling boosters
Integration of AI-powered diagnostics and personalization
Expansion of combination therapies and multi-modal protocols

14. Competitive Landscape

14.1 Overview

14.2

Overview on criticality of inputs and factors of differentiation

14.3 Landscape disruption

Overview on factors of disruption

14.4 Industry risks

Impact of key risks on business

15. Competitive Analysis

15.1 Companies profiled

Companies covered

15.2 Company ranking index

15.3 Market positioning of companies

Matrix on companies position and classification

15.4 AbbVie Inc.

AbbVie Inc. - Overview
AbbVie Inc. - Business segments
AbbVie Inc. - Key news
AbbVie Inc. - Key offerings
AbbVie Inc. - Segment focus
SWOT

15.5 Alma Lasers Ltd.

Alma Lasers Ltd. - Overview
Alma Lasers Ltd. - Product / Service
Alma Lasers Ltd. - Key offerings
SWOT

15.6 Bausch Health Co Inc.

Bausch Health Co Inc. - Overview
Bausch Health Co Inc. - Business segments
Bausch Health Co Inc. - Key offerings
Bausch Health Co Inc. - Segment focus
SWOT

15.7 Candela Corp.

Candela Corp. - Overview
Candela Corp. - Product / Service
Candela Corp. - Key offerings
SWOT

15.8 Classys Inc

Classys Inc - Overview
Classys Inc - Product / Service
Classys Inc - Key offerings
SWOT

15.9 Cutera Inc.

Cutera Inc. - Overview
Cutera Inc. - Product / Service
Cutera Inc. - Key offerings
SWOT

15.10 Cynosure LLC

Cynosure LLC - Overview
Cynosure LLC - Product / Service
Cynosure LLC - Key offerings
SWOT

15.11 Galderma Group AG

Galderma Group AG - Overview
Galderma Group AG - Business segments
Galderma Group AG - Key offerings
Galderma Group AG - Segment focus
SWOT

15.12 Hologic Inc.

Hologic Inc. - Overview
Hologic Inc. - Product / Service
Hologic Inc. - Key offerings
SWOT

15.13 Inmode Ltd.

Inmode Ltd. - Overview
Inmode Ltd. - Product / Service
Inmode Ltd. - Key offerings
SWOT

15.14 Johnson and Johnson

Johnson and Johnson - Overview
Johnson and Johnson - Business segments
Johnson and Johnson - Key news
Johnson and Johnson - Key offerings
Johnson and Johnson - Segment focus
SWOT

15.15 Lumenis Be Ltd.

Lumenis Be Ltd. - Overview
Lumenis Be Ltd. - Product / Service
Lumenis Be Ltd. - Key offerings
SWOT

15.16 Medytox Inc.

Medytox Inc. - Overview
Medytox Inc. - Product / Service
Medytox Inc. - Key offerings
SWOT

15.17 Revance Therapeutics Inc.

Revance Therapeutics Inc. - Overview
Revance Therapeutics Inc. - Product / Service
Revance Therapeutics Inc. - Key offerings
SWOT

15.18 Venus

Venus - Overview
Venus - Product / Service
Venus - Key offerings
SWOT

16. Appendix

16.1 Scope of the report

Market definition
Objectives
Notes and caveats

16.2 Inclusions and exclusions checklist

Inclusions checklist
Exclusions checklist

16.3 Currency conversion rates for US$

16.4 Research methodology

16.5 Data procurement

Information sources

16.6 Data validation

16.7 Validation techniques employed for market sizing

16.8 Data synthesis

16.9 360 degree market analysis

16.10 List of abbreviations

Research Methodology

Technavio presents a detailed picture of the market by way of study, synthesis, and summation of data from multiple sources. The analysts have presented the various facets of the market with a particular focus on identifying the key industry influencers. The data thus presented is comprehensive, reliable, and the result of extensive research, both primary and secondary.

INFORMATION SOURCES

Primary sources

  • Manufacturers and suppliers
  • Channel partners
  • Industry experts
  • Strategic decision makers

Secondary sources

  • Industry journals and periodicals
  • Government data
  • Financial reports of key industry players
  • Historical data
  • Press releases

DATA ANALYSIS

Data Synthesis

  • Collation of data
  • Estimation of key figures
  • Analysis of derived insights

Data Validation

  • Triangulation with data models
  • Reference against proprietary databases
  • Corroboration with industry experts

REPORT WRITING

Qualitative

  • Market drivers
  • Market challenges
  • Market trends
  • Five forces analysis

Quantitative

  • Market size and forecast
  • Market segmentation
  • Geographical insights
  • Competitive landscape

Interested in this report?

Get your sample now to see our research methodology and insights!

Download Now

Frequently Asked Questions

Non-Surgical Cosmetic Procedures market growth will increase by USD 20272.3 million during 2026-2030.

The Non-Surgical Cosmetic Procedures market is expected to grow at a CAGR of 12.1% during 2026-2030.

Non-Surgical Cosmetic Procedures market is segmented by Gender (Women, Men) Technique (Botulinum toxins, Hyaluronic acid-based derma fillers, Hair removal, Others) Product type (Injectables, Skin resurfacing and tightening, Fat reduction and body contouring, Hair removal and growth treatments, Others)

AbbVie Inc., Alma Lasers Ltd., Bausch Health Co Inc., BTL INDUSTRIES Inc., Candela Corp., Classys Inc, Cutera Inc., Cynosure LLC, Galderma Group AG, Hologic Inc., Inmode Ltd., Jeisys Medical Inc., Johnson and Johnson, Lumenis Be Ltd., Medytox Inc., Merz Pharma GmbH KGaA, Revance Therapeutics Inc., Sciton Inc., Sinclair Pharma Ltd., Solta Medical, Venus are a few of the key vendors in the Non-Surgical Cosmetic Procedures market.

North America will register the highest growth rate of 39.7% among the other regions. Therefore, the Non-Surgical Cosmetic Procedures market in North America is expected to garner significant business opportunities for the vendors during the forecast period.

US, Canada, Mexico, UK, Germany, France, Italy, Spain, The Netherlands, China, India, Japan, South Korea, Thailand, Indonesia, Brazil, South Africa, Saudi Arabia, UAE, Argentina, Israel, Colombia, Turkey

  • Technological innovations in minimally invasive formulations and energy devices is the driving factor this market.

The Non-Surgical Cosmetic Procedures market vendors should focus on grabbing business opportunities from the Gender segment as it accounted for the largest market share in the base year.
RIA - Research AI Assistant
Ask RIA
