NOR Flash Market Analysis, Size, and Forecast 2026-2030: APAC (China, South Korea, and Japan), North America (US, Canada, and Mexico), Europe (Germany, UK, and France), South America (Brazil, Argentina, and Colombia), Middle East and Africa (UAE, Saudi Arabia, and South Africa), and Rest of World (ROW)

NOR Flash Market Analysis, Size, and Forecast 2026-2030:
APAC (China, South Korea, and Japan), North America (US, Canada, and Mexico), Europe (Germany, UK, and France), South America (Brazil, Argentina, and Colombia), Middle East and Africa (UAE, Saudi Arabia, and South Africa), and Rest of World (ROW)

Published: Dec 2025 299 Pages SKU: IRTNTR80131

Market Overview at a Glance

$2.33 B
Market Opportunity
11.3%
CAGR 2025 - 2030
58.8%
APAC Growth
$1.70 B
Serial NOR flash segment 2024

NOR Flash Market Size 2026-2030

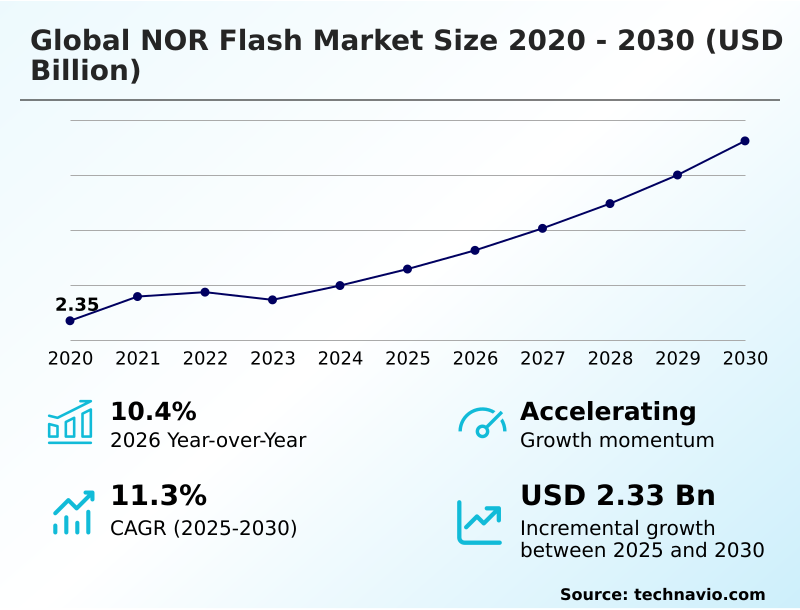
The nor flash market size is valued to increase by USD 2.33 billion, at a CAGR of 11.3% from 2025 to 2030. Increasing demand for high-performance electronics will drive the nor flash market.

Major Market Trends & Insights

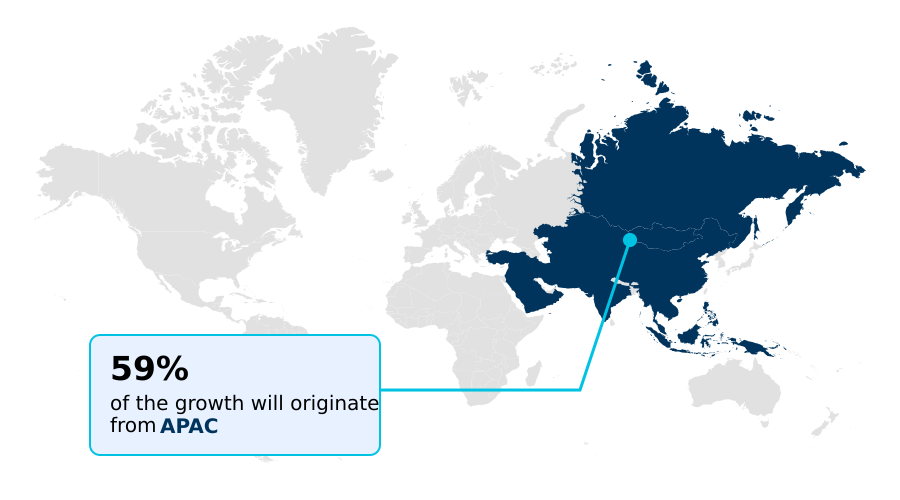
  • APAC dominated the market and accounted for a 58.8% growth during the forecast period.
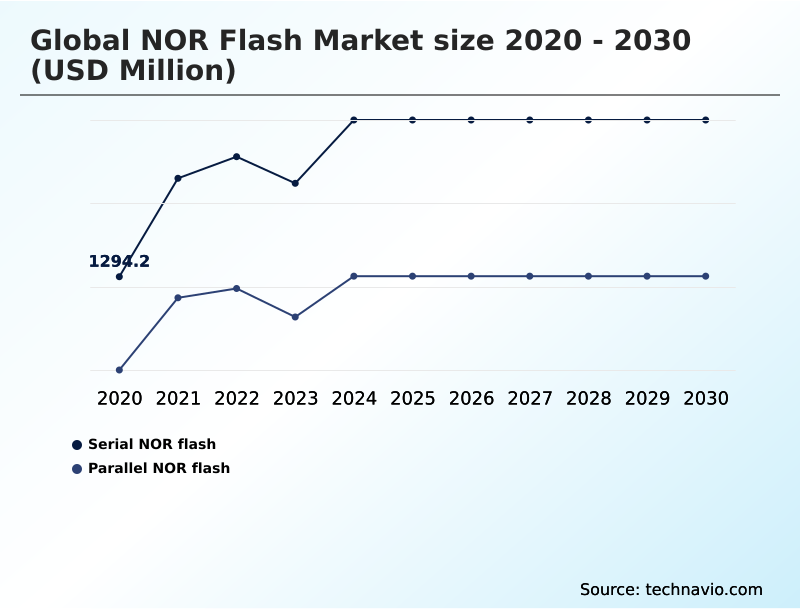
  • By Type - Serial NOR flash segment was valued at USD 1.70 billion in 2024
  • By End-user - Consumer electronics segment accounted for the largest market revenue share in 2024

Market Size & Forecast

  • Market Opportunities: USD 3.27 billion
  • Market Future Opportunities: USD 2.33 billion
  • CAGR from 2025 to 2030 : 11.3%

Market Summary

  • The NOR flash market is characterized by its critical role in ensuring system reliability and performance across a multitude of electronic applications. Its inherent attributes of fast read access and non-volatile data retention make it the preferred choice for boot code storage and execute-in-place (XIP) functionality in embedded systems.
  • Growth is significantly driven by the increasing electronic content in vehicles, where NOR flash is essential for advanced driver-assistance systems (ADAS) and in-vehicle infotainment (IVI) platforms that demand instant-on capability. Another key driver is the expansion of the IoT ecosystem, where countless connected devices rely on low-power, high-reliability memory for firmware storage and over-the-air (OTA) updates.
  • For instance, an automotive OEM’s product strategy for software-defined vehicles depends on a robust memory subsystem for secure firmware management, where high-density NOR flash enables reliable OTA updates, ensuring system integrity and reducing long-term maintenance costs.
  • However, the market faces challenges from the high capital investment required for semiconductor fabrication and the competitive pressure from emerging memory technologies like MRAM and ReRAM, which threaten to disrupt established use cases by offering alternative performance characteristics.

What will be the Size of the NOR Flash Market during the forecast period?

Get Key Insights on Market Forecast (PDF) Request Free Sample

How is the NOR Flash Market Segmented?

The nor flash industry research report provides comprehensive data (region-wise segment analysis), with forecasts and estimates in "USD million" for the period 2026-2030, as well as historical data from 2020-2024 for the following segments.

  • Type
    • Serial NOR flash
    • Parallel NOR flash
  • End-user
    • Consumer electronics
    • Communication
    • Automotive
    • Industrial
    • Others
  • Product type
    • Quad SPI
    • SPI single or dual
    • Octal and xSPI
  • Geography
    • APAC
      • China
      • South Korea
      • Japan
    • North America
      • US
      • Canada
      • Mexico
    • Europe
      • Germany
      • UK
      • France
    • South America
      • Brazil
      • Argentina
      • Colombia
    • Middle East and Africa
      • UAE
      • Saudi Arabia
      • South Africa
    • Rest of World (ROW)

By Type Insights

The serial nor flash segment is estimated to witness significant growth during the forecast period.

The market is segmented by type, where serial NOR flash is pivotal due to its low pin count and simplified architecture, making it ideal for a wide range of NOR flash applications.

This non-volatile storage contrasts with parallel NOR flash, which is reserved for systems requiring the fastest possible direct memory mapping. In high-volume consumer electronics memory, where NOR flash versus NAND flash decisions are critical, the serial interface dominates.

NOR flash pricing trends are heavily influenced by demand for code storage solutions in devices like NOR flash for smart meters.

Innovations in single-level cell designs and techniques like code shadowing are crucial for balancing performance and cost, with some architectures reducing board space by 25%.

Request Free Sample

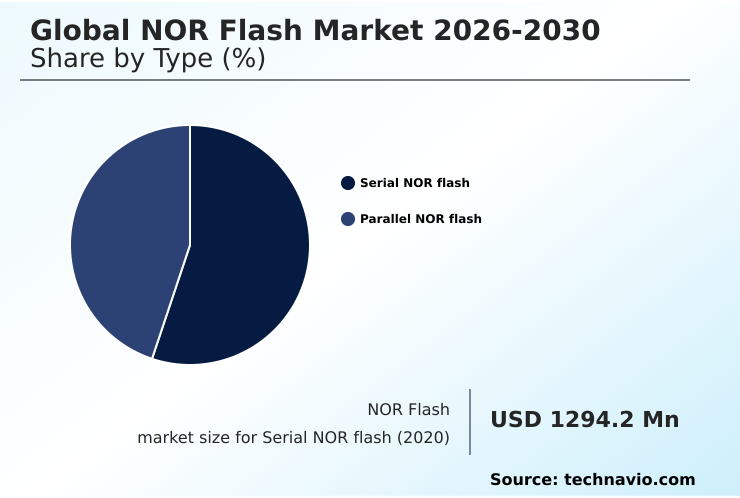
The Serial NOR flash segment was valued at USD 1.70 billion in 2024 and showed a gradual increase during the forecast period.

Request Free Sample

Regional Analysis

APAC is estimated to contribute 58.8% to the growth of the global market during the forecast period.Technavio’s analysts have elaborately explained the regional trends and drivers that shape the market during the forecast period.

See How NOR Flash Market Demand is Rising in APAC Request Free Sample

The geographic landscape is dominated by the APAC region, which functions as both a primary manufacturing hub and a massive consumer, accounting for over 58% of incremental growth.

This is driven by the region’s expansive industrial automation memory sector and strategic government initiatives promoting semiconductor self-sufficiency.

Demand for automotive-grade NOR flash is particularly strong for NOR flash in ADAS applications, where fast read access for firmware storage is critical for ensuring firmware integrity.

The widespread use of the quad SPI interface in memory for embedded microcontrollers further solidifies this demand. North America and Europe are key markets for automotive memory solutions and specialized products like radiation-hardened NOR flash, focusing on high-value sectors.

The need for efficient system-on-chip integration makes this non-volatile storage essential in advanced driver-assistance systems and NOR flash for IoT devices.

Market Dynamics

Our researchers analyzed the data with 2025 as the base year, along with the key drivers, trends, and challenges. A holistic analysis of drivers will help companies refine their marketing strategies to gain a competitive advantage.

  • Strategic decision-making in the NOR flash market is increasingly complex, shaped by a confluence of technological evolution and end-market demands. The impact of 5g rollout on NOR flash is significant, driving demand for higher-density memory in networking equipment. Concurrently, NOR flash requirements for automotive ADAS are becoming more stringent, prioritizing reliability and fast performance.
  • This has elevated the importance of using NOR flash for secure boot processes to protect against cyber threats. System designers are evaluating the benefits of octal SPI for fast boot capabilities in next-generation infotainment systems. However, challenges in NOR flash miniaturization persist, pushing manufacturers toward advancements in 3d NOR flash technology.
  • The fundamental role of NOR flash in iot firmware and its use in industrial automation systems remain stable demand drivers. Key considerations include the threat from substitutes for NOR flash in electronics and fluctuating cost factors in NOR flash production.
  • The ability to facilitate secure over-the-air updates is a key differentiator, and comparing serial and parallel NOR flash helps optimize designs. Ensuring data integrity in NOR flash is paramount, especially for low power NOR flash for wearables and high-reliability memory for aerospace. The on-chip ecc benefits in NOR flash and streamlined NOR flash integration with system-on-chips are critical for performance.
  • The market must also navigate e-waste regulations for NOR flash and mitigate supply chain risks for NOR flash market stability. For instance, implementing robust OTA update capabilities has been shown to reduce post-sale maintenance dispatches by a double-digit percentage, directly improving operational efficiency.

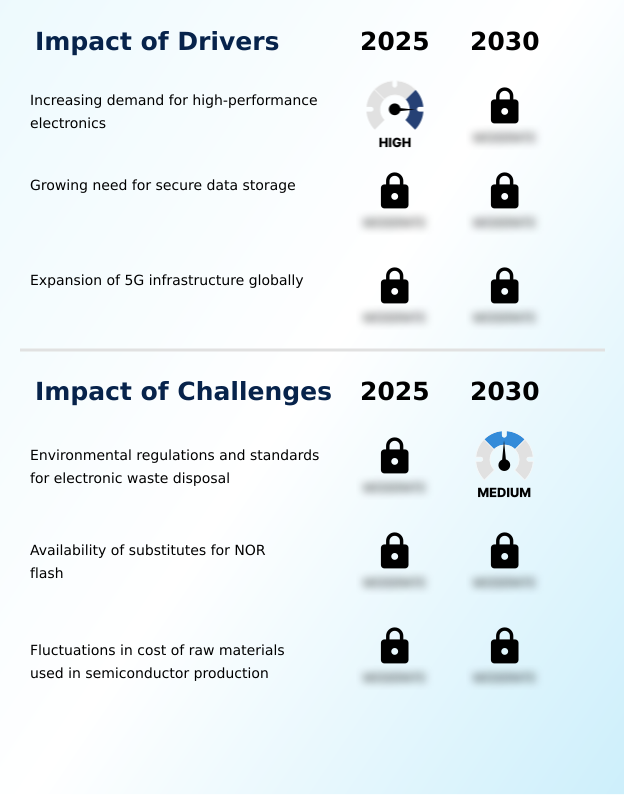
What are the key market drivers leading to the rise in the adoption of NOR Flash Industry?

  • The rising demand for high-performance electronics across consumer, automotive, and industrial applications serves as a fundamental driver for market expansion.

  • Demand for high-performance electronics is a primary driver, with devices requiring dependable non-volatile memory for critical boot code storage and firmware storage.
  • High reliability memory is essential in telecommunication equipment memory, particularly memory for 5G base stations, and in NOR flash in medical devices, where data retention is non-negotiable.
  • In automotive applications, the need for responsive NOR flash for IVI systems and complex in-vehicle infotainment platforms fuels growth. The emphasis is on secure data storage solutions with low power consumption.
  • The adoption of these components in critical infrastructure has been shown to reduce system recovery times by more than 60%, demonstrating their significant value in maintaining operational uptime and system resilience.

What are the market trends shaping the NOR Flash Industry?

  • A prominent trend shaping the market is the intensified focus from vendors on launching new products. These innovations are tailored to meet the escalating demands of high-growth sectors.

  • Key trends revolve around innovation to support next-generation systems. The miniaturization of memory chips is being advanced by developments like 3D NOR flash technology and advanced packaging for flash memory, enabling higher memory density. Interfaces are also evolving, with octal SPI and the xSPI interface delivering the high bandwidth needed for execute-in-place functionality and fast boot time memory.
  • This is critical for complex zonal architecture memory in vehicles. Secure over-the-air updates are another focus, requiring sophisticated secure firmware management to ensure system integrity. These advancements maintain a competitive edge, with some new architectures improving data throughput by over 50% compared to legacy interfaces, even as the MRAM versus NOR flash debate continues.

What challenges does the NOR Flash Industry face during its growth?

  • Stringent environmental regulations and evolving standards for the disposal of electronic waste present a significant operational and financial challenge to the industry.

  • The industry faces challenges from both technological and regulatory fronts. The semiconductor supply chain is strained by fluctuating semiconductor raw material costs, impacting everything from the semiconductor fabrication plant to the final product. Scalability is a technical hurdle, as moving beyond the 28nm process node proves difficult, opening the door for alternatives like ReRAM as a NOR flash substitute.
  • Concurrently, stringent electronic waste regulations, including extended producer responsibility and restriction of hazardous substances, add complexity. While features like on-chip error correction code and support for a secure boot process maintain value, the cost of compliance can increase operational overhead by up to 15%, impacting overall profitability.

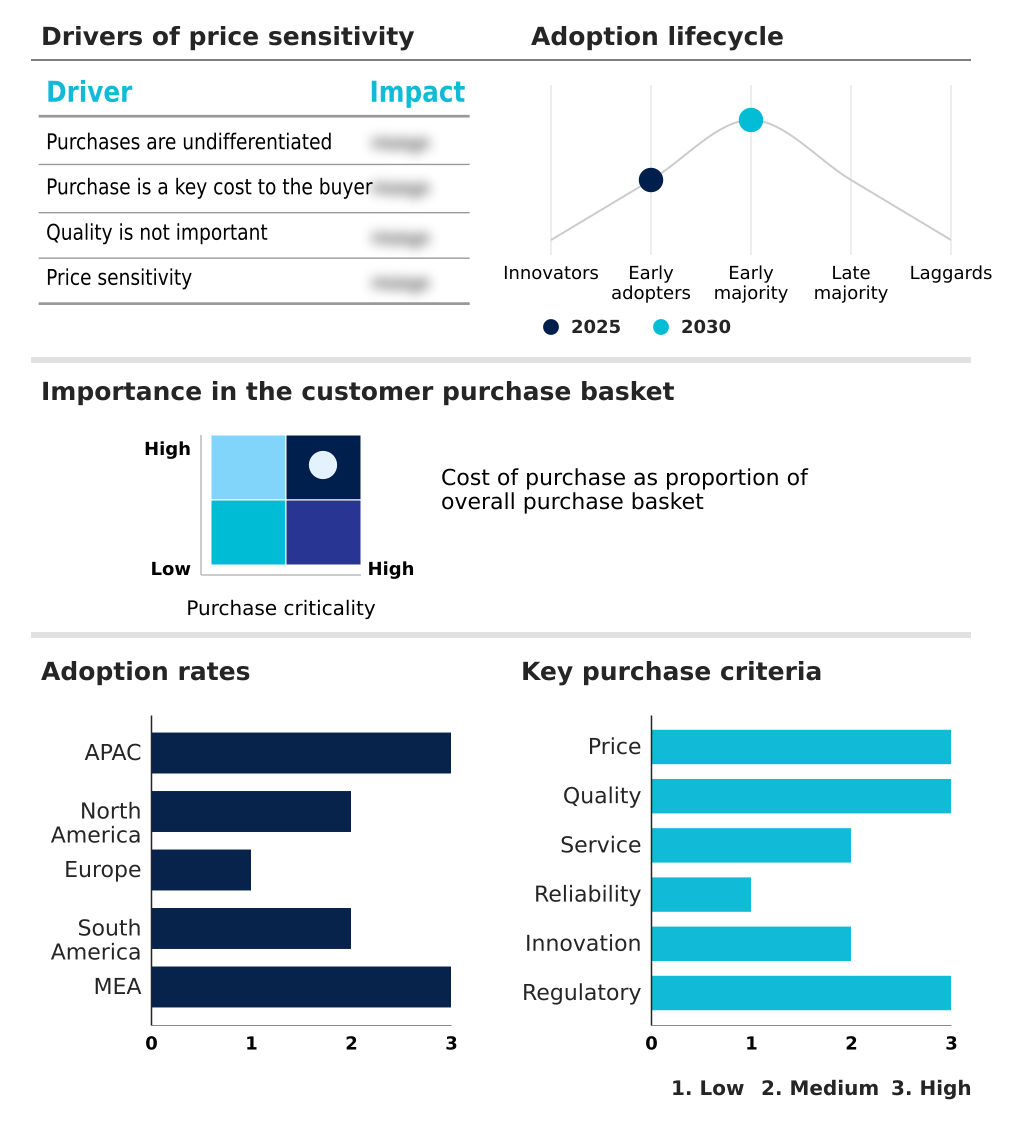
Exclusive Technavio Analysis on Customer Landscape

The nor flash market forecasting report includes the adoption lifecycle of the market, covering from the innovator’s stage to the laggard’s stage. It focuses on adoption rates in different regions based on penetration. Furthermore, the nor flash market report also includes key purchase criteria and drivers of price sensitivity to help companies evaluate and develop their market growth analysis strategies.

Customer Landscape of NOR Flash Industry

Competitive Landscape

Companies are implementing various strategies, such as strategic alliances, nor flash market forecast, partnerships, mergers and acquisitions, geographical expansion, and product/service launches, to enhance their presence in the industry.

Alliance Memory Inc. - Offering a broad range of memory ICs, including SRAM, DRAM, and various FLASH solutions, to support diverse legacy and modern electronic design requirements.

The industry research and growth report includes detailed analyses of the competitive landscape of the market and information about key companies, including:

  • Alliance Memory Inc.
  • Amkor Technology Inc.
  • Cypress Semiconductor Corp
  • Elite Semiconductor Tech Inc.
  • Giantec Semiconductor Corp.
  • GigaDevice Semiconductor Inc
  • Infineon Technologies AG
  • Integrated Silicon Solution
  • Macronix International Co Ltd
  • Microchip Technology Inc.
  • Micron Technology Inc.
  • Renesas Electronics Corp.
  • Rochester Electronics LLC
  • ROHM Co. Ltd.
  • Sino Wealth Electronic Ltd.
  • Winbond Electronics Corp.
  • Wuhan Xinxin Semiconductor Manufacturing Co., Ltd.
  • XTX Technology Inc.

Qualitative and quantitative analysis of companies has been conducted to help clients understand the wider business environment as well as the strengths and weaknesses of key industry players. Data is qualitatively analyzed to categorize companies as pure play, category-focused, industry-focused, and diversified; it is quantitatively analyzed to categorize companies as dominant, leading, strong, tentative, and weak.

Recent Development and News in Nor flash market

  • In August, 2024, Infineon Technologies AG launched its SEMPER X1 LPDDR Flash, a memory solution engineered for next-generation automotive architectures to enhance safety and performance.
  • In November, 2024, Macronix International Co. Ltd. introduced its groundbreaking 3D NOR flash technology, announcing a single-chip 4Gb solution with mass production anticipated for early 2025.
  • In January, 2025, a Defense Logistics Agency qualification was announced for Infineon Technologies AG's radiation-hardened 512 Mbit QSPI NOR flash, making it the first QML-qualified memory for the space industry.
  • In May, 2025, Infineon Technologies AG achieved ASIL-D certification for its SEMPER NOR flash memory family, a key validation for its use in safety-critical automotive systems like ADAS.

Dive into Technavio’s robust research methodology, blending expert interviews, extensive data synthesis, and validated models for unparalleled NOR Flash Market insights. See full methodology.

Market Scope
Page number 299
Base year 2025
Historic period 2020-2024
Forecast period 2026-2030
Growth momentum & CAGR Accelerate at a CAGR of 11.3%
Market growth 2026-2030 USD 2328.3 million
Market structure Fragmented
YoY growth 2025-2026(%) 10.4%
Key countries China, Taiwan, South Korea, Japan, India, Australia, US, Canada, Mexico, Germany, UK, France, The Netherlands, Italy, Spain, Brazil, Argentina, Colombia, UAE, Saudi Arabia, South Africa, Egypt and Israel
Competitive landscape Leading Companies, Market Positioning of Companies, Competitive Strategies, and Industry Risks

Request Free Sample

Research Analyst Overview

  • The NOR Flash market is sustained by its indispensable role in applications demanding high reliability memory and fast read access for critical code. Its architecture, featuring non-volatile memory properties, is essential for firmware storage and the secure boot process in everything from consumer electronics to advanced automotive-grade NOR flash systems.
  • A key boardroom-level consideration is product strategy related to miniaturization, where technologies like wafer-level chip scale packages (WLCSP) and the move toward the 28nm process node are critical for staying competitive. While serial NOR flash with its low pin count and quad SPI interface dominates, parallel NOR flash holds its ground in legacy systems requiring direct memory mapping.
  • Innovations such as on-chip error correction code (ECC) and 3D NOR flash technology are addressing the need for higher memory density and robust data retention. The technology is fundamental to advanced driver-assistance systems (ADAS) and in-vehicle infotainment (IVI), enabling functionality like over-the-air (OTA) updates and execute-in-place (XIP).
  • Demand is further bolstered by the rollout of 5G, with network infrastructure deployments driving a need for components that support over 400 million new connections.

What are the Key Data Covered in this NOR Flash Market Research and Growth Report?

  • What is the expected growth of the NOR Flash Market between 2026 and 2030?

    • USD 2.33 billion, at a CAGR of 11.3%

  • What segmentation does the market report cover?

    • The report is segmented by Type (Serial NOR flash, and Parallel NOR flash), End-user (Consumer electronics, Communication, Automotive, Industrial, and Others), Product Type (Quad SPI, SPI single or dual, and Octal and xSPI) and Geography (APAC, North America, Europe, South America, Middle East and Africa)

  • Which regions are analyzed in the report?

    • APAC, North America, Europe, South America and Middle East and Africa

  • What are the key growth drivers and market challenges?

    • Increasing demand for high-performance electronics, Environmental regulations and standards for electronic waste disposal

  • Who are the major players in the NOR Flash Market?

    • Alliance Memory Inc., Amkor Technology Inc., Cypress Semiconductor Corp, Elite Semiconductor Tech Inc., Giantec Semiconductor Corp., GigaDevice Semiconductor Inc, Infineon Technologies AG, Integrated Silicon Solution, Macronix International Co Ltd, Microchip Technology Inc., Micron Technology Inc., Renesas Electronics Corp., Rochester Electronics LLC, ROHM Co. Ltd., Sino Wealth Electronic Ltd., Winbond Electronics Corp., Wuhan Xinxin Semiconductor Manufacturing Co., Ltd. and XTX Technology Inc.

Market Research Insights

  • The market is shaped by competing technological and economic forces. Demand for high-performance electronics memory is strong, particularly for automotive memory solutions and telecommunication equipment memory used in 5G base stations. This is balanced by challenges from the semiconductor supply chain, where volatile semiconductor raw material costs can cause downstream service quotes to increase by as much as 18%.
  • While NOR flash pricing trends are a constant consideration, the technology's role in secure data storage solutions for NOR flash in medical devices and industrial automation memory remains critical.
  • As NOR flash applications expand into NOR flash for IoT and complex NOR flash for IVI systems, the debate of NOR flash versus NAND flash continues, with each technology serving distinct needs.
  • Alternatives like MRAM versus NOR flash and ReRAM as NOR flash substitute are gaining attention, especially as the miniaturization of memory chips pushes current technology nodes to their limits.

We can help! Our analysts can customize this nor flash market research report to meet your requirements.

Get in touch

1. Executive Summary

1.1 Market overview

Executive Summary - Chart on Market Overview
Executive Summary - Data Table on Market Overview
Executive Summary - Chart on Global Market Characteristics
Executive Summary - Chart on Market by Geography
Executive Summary - Chart on Market Segmentation by Type
Executive Summary - Chart on Market Segmentation by End-user
Executive Summary - Chart on Market Segmentation by Product Type
Executive Summary - Chart on Incremental Growth
Executive Summary - Data Table on Incremental Growth
Executive Summary - Chart on Company Market Positioning

2. Technavio Analysis

2.1 Analysis of price sensitivity, lifecycle, customer purchase basket, adoption rates, and purchase criteria

2.2 Criticality of inputs and Factors of differentiation

Chart on Overview on criticality of inputs and factors of differentiation

2.3 Factors of disruption

Chart on Overview on factors of disruption

2.4 Impact of drivers and challenges

Chart on Impact of drivers and challenges in 2025 and 2030

3. Market Landscape

3.1 Market ecosystem

Chart on Parent Market
Data Table on - Parent Market

3.2 Market characteristics

Chart on Market characteristics analysis

3.3 Value chain analysis

Chart on Value chain analysis

4. Market Sizing

4.1 Market definition

Data Table on Offerings of companies included in the market definition

4.2 Market segment analysis

Market segments

4.3 Market size 2025

4.4 Market outlook: Forecast for 2025-2030

Chart on Global - Market size and forecast 2025-2030 ($ million)
Data Table on Global - Market size and forecast 2025-2030 ($ million)
Chart on Global Market: Year-over-year growth 2025-2030 (%)
Data Table on Global Market: Year-over-year growth 2025-2030 (%)

5. Historic Market Size

5.1 Global NOR Flash Market 2020 - 2024

Historic Market Size - Data Table on Global NOR Flash Market 2020 - 2024 ($ million)

5.2 Type segment analysis 2020 - 2024

Historic Market Size - Type Segment 2020 - 2024 ($ million)

5.3 End-user segment analysis 2020 - 2024

Historic Market Size - End-user Segment 2020 - 2024 ($ million)

5.4 Product Type segment analysis 2020 - 2024

Historic Market Size - Product Type Segment 2020 - 2024 ($ million)

5.5 Geography segment analysis 2020 - 2024

Historic Market Size - Geography Segment 2020 - 2024 ($ million)

5.6 Country segment analysis 2020 - 2024

Historic Market Size - Country Segment 2020 - 2024 ($ million)

6. Qualitative Analysis

6.1 The AI impact on the global NOR flash market

7. Five Forces Analysis

7.1 Five forces summary

Five forces analysis - Comparison between 2025 and 2030

7.2 Bargaining power of buyers

Bargaining power of buyers - Impact of key factors 2025 and 2030

7.3 Bargaining power of suppliers

Bargaining power of suppliers - Impact of key factors in 2025 and 2030

7.4 Threat of new entrants

Threat of new entrants - Impact of key factors in 2025 and 2030

7.5 Threat of substitutes

Threat of substitutes - Impact of key factors in 2025 and 2030

7.6 Threat of rivalry

Threat of rivalry - Impact of key factors in 2025 and 2030

7.7 Market condition

Chart on Market condition - Five forces 2025 and 2030

8. Market Segmentation by Type

8.1 Market segments

Chart on Type - Market share 2025-2030 (%)
Data Table on Type - Market share 2025-2030 (%)

8.2 Comparison by Type

Chart on Comparison by Type
Data Table on Comparison by Type

8.3 Serial NOR flash - Market size and forecast 2025-2030

Chart on Serial NOR flash - Market size and forecast 2025-2030 ($ million)
Data Table on Serial NOR flash - Market size and forecast 2025-2030 ($ million)
Chart on Serial NOR flash - Year-over-year growth 2025-2030 (%)
Data Table on Serial NOR flash - Year-over-year growth 2025-2030 (%)

8.4 Parallel NOR flash - Market size and forecast 2025-2030

Chart on Parallel NOR flash - Market size and forecast 2025-2030 ($ million)
Data Table on Parallel NOR flash - Market size and forecast 2025-2030 ($ million)
Chart on Parallel NOR flash - Year-over-year growth 2025-2030 (%)
Data Table on Parallel NOR flash - Year-over-year growth 2025-2030 (%)

8.5 Market opportunity by Type

Market opportunity by Type ($ million)
Data Table on Market opportunity by Type ($ million)

9. Market Segmentation by End-user

9.1 Market segments

Chart on End-user - Market share 2025-2030 (%)
Data Table on End-user - Market share 2025-2030 (%)

9.2 Comparison by End-user

Chart on Comparison by End-user
Data Table on Comparison by End-user

9.3 Consumer electronics - Market size and forecast 2025-2030

Chart on Consumer electronics - Market size and forecast 2025-2030 ($ million)
Data Table on Consumer electronics - Market size and forecast 2025-2030 ($ million)
Chart on Consumer electronics - Year-over-year growth 2025-2030 (%)
Data Table on Consumer electronics - Year-over-year growth 2025-2030 (%)

9.4 Communication - Market size and forecast 2025-2030

Chart on Communication - Market size and forecast 2025-2030 ($ million)
Data Table on Communication - Market size and forecast 2025-2030 ($ million)
Chart on Communication - Year-over-year growth 2025-2030 (%)
Data Table on Communication - Year-over-year growth 2025-2030 (%)

9.5 Automotive - Market size and forecast 2025-2030

Chart on Automotive - Market size and forecast 2025-2030 ($ million)
Data Table on Automotive - Market size and forecast 2025-2030 ($ million)
Chart on Automotive - Year-over-year growth 2025-2030 (%)
Data Table on Automotive - Year-over-year growth 2025-2030 (%)

9.6 Industrial - Market size and forecast 2025-2030

Chart on Industrial - Market size and forecast 2025-2030 ($ million)
Data Table on Industrial - Market size and forecast 2025-2030 ($ million)
Chart on Industrial - Year-over-year growth 2025-2030 (%)
Data Table on Industrial - Year-over-year growth 2025-2030 (%)

9.7 Others - Market size and forecast 2025-2030

Chart on Others - Market size and forecast 2025-2030 ($ million)
Data Table on Others - Market size and forecast 2025-2030 ($ million)
Chart on Others - Year-over-year growth 2025-2030 (%)
Data Table on Others - Year-over-year growth 2025-2030 (%)

9.8 Market opportunity by End-user

Market opportunity by End-user ($ million)
Data Table on Market opportunity by End-user ($ million)

10. Market Segmentation by Product Type

10.1 Market segments

Chart on Product Type - Market share 2025-2030 (%)
Data Table on Product Type - Market share 2025-2030 (%)

10.2 Comparison by Product Type

Chart on Comparison by Product Type
Data Table on Comparison by Product Type

10.3 Quad SPI - Market size and forecast 2025-2030

Chart on Quad SPI - Market size and forecast 2025-2030 ($ million)
Data Table on Quad SPI - Market size and forecast 2025-2030 ($ million)
Chart on Quad SPI - Year-over-year growth 2025-2030 (%)
Data Table on Quad SPI - Year-over-year growth 2025-2030 (%)

10.4 SPI single or dual - Market size and forecast 2025-2030

Chart on SPI single or dual - Market size and forecast 2025-2030 ($ million)
Data Table on SPI single or dual - Market size and forecast 2025-2030 ($ million)
Chart on SPI single or dual - Year-over-year growth 2025-2030 (%)
Data Table on SPI single or dual - Year-over-year growth 2025-2030 (%)

10.5 Octal and xSPI - Market size and forecast 2025-2030

Chart on Octal and xSPI - Market size and forecast 2025-2030 ($ million)
Data Table on Octal and xSPI - Market size and forecast 2025-2030 ($ million)
Chart on Octal and xSPI - Year-over-year growth 2025-2030 (%)
Data Table on Octal and xSPI - Year-over-year growth 2025-2030 (%)

10.6 Market opportunity by Product Type

Market opportunity by Product Type ($ million)
Data Table on Market opportunity by Product Type ($ million)

11. Customer Landscape

11.1 Customer landscape overview

Analysis of price sensitivity, lifecycle, customer purchase basket, adoption rates, and purchase criteria

12. Geographic Landscape

12.1 Geographic segmentation

Chart on Market share by geography 2025-2030 (%)
Data Table on Market share by geography 2025-2030 (%)

12.2 Geographic comparison

Chart on Geographic comparison
Data Table on Geographic comparison

12.3 APAC - Market size and forecast 2025-2030

Chart on APAC - Market size and forecast 2025-2030 ($ million)
Data Table on APAC - Market size and forecast 2025-2030 ($ million)
Chart on APAC - Year-over-year growth 2025-2030 (%)
Data Table on APAC - Year-over-year growth 2025-2030 (%)
Chart on Regional Comparison - APAC
Data Table on Regional Comparison - APAC

12.3.1 China - Market size and forecast 2025-2030

Chart on China - Market size and forecast 2025-2030 ($ million)
Data Table on China - Market size and forecast 2025-2030 ($ million)
Chart on China - Year-over-year growth 2025-2030 (%)
Data Table on China - Year-over-year growth 2025-2030 (%)

12.3.2 Taiwan - Market size and forecast 2025-2030

Chart on Taiwan - Market size and forecast 2025-2030 ($ million)
Data Table on Taiwan - Market size and forecast 2025-2030 ($ million)
Chart on Taiwan - Year-over-year growth 2025-2030 (%)
Data Table on Taiwan - Year-over-year growth 2025-2030 (%)

12.3.3 South Korea - Market size and forecast 2025-2030

Chart on South Korea - Market size and forecast 2025-2030 ($ million)
Data Table on South Korea - Market size and forecast 2025-2030 ($ million)
Chart on South Korea - Year-over-year growth 2025-2030 (%)
Data Table on South Korea - Year-over-year growth 2025-2030 (%)

12.3.4 Japan - Market size and forecast 2025-2030

Chart on Japan - Market size and forecast 2025-2030 ($ million)
Data Table on Japan - Market size and forecast 2025-2030 ($ million)
Chart on Japan - Year-over-year growth 2025-2030 (%)
Data Table on Japan - Year-over-year growth 2025-2030 (%)

12.3.5 India - Market size and forecast 2025-2030

Chart on India - Market size and forecast 2025-2030 ($ million)
Data Table on India - Market size and forecast 2025-2030 ($ million)
Chart on India - Year-over-year growth 2025-2030 (%)
Data Table on India - Year-over-year growth 2025-2030 (%)

12.3.6 Australia - Market size and forecast 2025-2030

Chart on Australia - Market size and forecast 2025-2030 ($ million)
Data Table on Australia - Market size and forecast 2025-2030 ($ million)
Chart on Australia - Year-over-year growth 2025-2030 (%)
Data Table on Australia - Year-over-year growth 2025-2030 (%)

12.4 North America - Market size and forecast 2025-2030

Chart on North America - Market size and forecast 2025-2030 ($ million)
Data Table on North America - Market size and forecast 2025-2030 ($ million)
Chart on North America - Year-over-year growth 2025-2030 (%)
Data Table on North America - Year-over-year growth 2025-2030 (%)
Chart on Regional Comparison - North America
Data Table on Regional Comparison - North America

12.4.1 US - Market size and forecast 2025-2030

Chart on US - Market size and forecast 2025-2030 ($ million)
Data Table on US - Market size and forecast 2025-2030 ($ million)
Chart on US - Year-over-year growth 2025-2030 (%)
Data Table on US - Year-over-year growth 2025-2030 (%)

12.4.2 Canada - Market size and forecast 2025-2030

Chart on Canada - Market size and forecast 2025-2030 ($ million)
Data Table on Canada - Market size and forecast 2025-2030 ($ million)
Chart on Canada - Year-over-year growth 2025-2030 (%)
Data Table on Canada - Year-over-year growth 2025-2030 (%)

12.4.3 Mexico - Market size and forecast 2025-2030

Chart on Mexico - Market size and forecast 2025-2030 ($ million)
Data Table on Mexico - Market size and forecast 2025-2030 ($ million)
Chart on Mexico - Year-over-year growth 2025-2030 (%)
Data Table on Mexico - Year-over-year growth 2025-2030 (%)

12.5 Europe - Market size and forecast 2025-2030

Chart on Europe - Market size and forecast 2025-2030 ($ million)
Data Table on Europe - Market size and forecast 2025-2030 ($ million)
Chart on Europe - Year-over-year growth 2025-2030 (%)
Data Table on Europe - Year-over-year growth 2025-2030 (%)
Chart on Regional Comparison - Europe
Data Table on Regional Comparison - Europe

12.5.1 Germany - Market size and forecast 2025-2030

Chart on Germany - Market size and forecast 2025-2030 ($ million)
Data Table on Germany - Market size and forecast 2025-2030 ($ million)
Chart on Germany - Year-over-year growth 2025-2030 (%)
Data Table on Germany - Year-over-year growth 2025-2030 (%)

12.5.2 UK - Market size and forecast 2025-2030

Chart on UK - Market size and forecast 2025-2030 ($ million)
Data Table on UK - Market size and forecast 2025-2030 ($ million)
Chart on UK - Year-over-year growth 2025-2030 (%)
Data Table on UK - Year-over-year growth 2025-2030 (%)

12.5.3 France - Market size and forecast 2025-2030

Chart on France - Market size and forecast 2025-2030 ($ million)
Data Table on France - Market size and forecast 2025-2030 ($ million)
Chart on France - Year-over-year growth 2025-2030 (%)
Data Table on France - Year-over-year growth 2025-2030 (%)

12.5.4 The Netherlands - Market size and forecast 2025-2030

Chart on The Netherlands - Market size and forecast 2025-2030 ($ million)
Data Table on The Netherlands - Market size and forecast 2025-2030 ($ million)
Chart on The Netherlands - Year-over-year growth 2025-2030 (%)
Data Table on The Netherlands - Year-over-year growth 2025-2030 (%)

12.5.5 Italy - Market size and forecast 2025-2030

Chart on Italy - Market size and forecast 2025-2030 ($ million)
Data Table on Italy - Market size and forecast 2025-2030 ($ million)
Chart on Italy - Year-over-year growth 2025-2030 (%)
Data Table on Italy - Year-over-year growth 2025-2030 (%)

12.5.6 Spain - Market size and forecast 2025-2030

Chart on Spain - Market size and forecast 2025-2030 ($ million)
Data Table on Spain - Market size and forecast 2025-2030 ($ million)
Chart on Spain - Year-over-year growth 2025-2030 (%)
Data Table on Spain - Year-over-year growth 2025-2030 (%)

12.6 South America - Market size and forecast 2025-2030

Chart on South America - Market size and forecast 2025-2030 ($ million)
Data Table on South America - Market size and forecast 2025-2030 ($ million)
Chart on South America - Year-over-year growth 2025-2030 (%)
Data Table on South America - Year-over-year growth 2025-2030 (%)
Chart on Regional Comparison - South America
Data Table on Regional Comparison - South America

12.6.1 Brazil - Market size and forecast 2025-2030

Chart on Brazil - Market size and forecast 2025-2030 ($ million)
Data Table on Brazil - Market size and forecast 2025-2030 ($ million)
Chart on Brazil - Year-over-year growth 2025-2030 (%)
Data Table on Brazil - Year-over-year growth 2025-2030 (%)

12.6.2 Argentina - Market size and forecast 2025-2030

Chart on Argentina - Market size and forecast 2025-2030 ($ million)
Data Table on Argentina - Market size and forecast 2025-2030 ($ million)
Chart on Argentina - Year-over-year growth 2025-2030 (%)
Data Table on Argentina - Year-over-year growth 2025-2030 (%)

12.6.3 Colombia - Market size and forecast 2025-2030

Chart on Colombia - Market size and forecast 2025-2030 ($ million)
Data Table on Colombia - Market size and forecast 2025-2030 ($ million)
Chart on Colombia - Year-over-year growth 2025-2030 (%)
Data Table on Colombia - Year-over-year growth 2025-2030 (%)

12.7 Middle East and Africa - Market size and forecast 2025-2030

Chart on Middle East and Africa - Market size and forecast 2025-2030 ($ million)
Data Table on Middle East and Africa - Market size and forecast 2025-2030 ($ million)
Chart on Middle East and Africa - Year-over-year growth 2025-2030 (%)
Data Table on Middle East and Africa - Year-over-year growth 2025-2030 (%)
Chart on Regional Comparison - Middle East and Africa
Data Table on Regional Comparison - Middle East and Africa

12.7.1 UAE - Market size and forecast 2025-2030

Chart on UAE - Market size and forecast 2025-2030 ($ million)
Data Table on UAE - Market size and forecast 2025-2030 ($ million)
Chart on UAE - Year-over-year growth 2025-2030 (%)
Data Table on UAE - Year-over-year growth 2025-2030 (%)

12.7.2 Saudi Arabia - Market size and forecast 2025-2030

Chart on Saudi Arabia - Market size and forecast 2025-2030 ($ million)
Data Table on Saudi Arabia - Market size and forecast 2025-2030 ($ million)
Chart on Saudi Arabia - Year-over-year growth 2025-2030 (%)
Data Table on Saudi Arabia - Year-over-year growth 2025-2030 (%)

12.7.3 South Africa - Market size and forecast 2025-2030

Chart on South Africa - Market size and forecast 2025-2030 ($ million)
Data Table on South Africa - Market size and forecast 2025-2030 ($ million)
Chart on South Africa - Year-over-year growth 2025-2030 (%)
Data Table on South Africa - Year-over-year growth 2025-2030 (%)

12.7.4 Egypt - Market size and forecast 2025-2030

Chart on Egypt - Market size and forecast 2025-2030 ($ million)
Data Table on Egypt - Market size and forecast 2025-2030 ($ million)
Chart on Egypt - Year-over-year growth 2025-2030 (%)
Data Table on Egypt - Year-over-year growth 2025-2030 (%)

12.7.5 Israel - Market size and forecast 2025-2030

Chart on Israel - Market size and forecast 2025-2030 ($ million)
Data Table on Israel - Market size and forecast 2025-2030 ($ million)
Chart on Israel - Year-over-year growth 2025-2030 (%)
Data Table on Israel - Year-over-year growth 2025-2030 (%)

12.8 Market opportunity by geography

Market opportunity by geography ($ million)
Data Tables on Market opportunity by geography ($ million)

13. Drivers, Challenges, and Opportunity

13.1 Market drivers

Increasing demand for high-performance electronics
Growing need for secure data storage
Expansion of 5G infrastructure globally

13.2 Market challenges

Environmental regulations and standards for electronic waste disposal
Availability of substitutes for NOR flash
Fluctuations in cost of raw materials used in semiconductor production

13.3 Impact of drivers and challenges

Impact of drivers and challenges in 2025 and 2030

13.4 Market opportunities

Increasing focus of vendors on new product launches
Rising number of strategic alliances
Growing miniaturization of NOR flash

14. Competitive Landscape

14.1 Overview

14.2

Overview on criticality of inputs and factors of differentiation

14.3 Landscape disruption

Overview on factors of disruption

14.4 Industry risks

Impact of key risks on business

15. Competitive Analysis

15.1 Companies profiled

Companies covered

15.2 Company ranking index

15.3 Market positioning of companies

Matrix on companies position and classification

15.4 Amkor Technology Inc.

Amkor Technology Inc. - Overview
Amkor Technology Inc. - Business segments
Amkor Technology Inc. - Key news
Amkor Technology Inc. - Key offerings
Amkor Technology Inc. - Segment focus
SWOT

15.5 Elite Semiconductor Tech Inc.

Elite Semiconductor Tech Inc. - Overview
Elite Semiconductor Tech Inc. - Product / Service
Elite Semiconductor Tech Inc. - Key offerings
SWOT

15.6 GigaDevice Semiconductor Inc

GigaDevice Semiconductor Inc - Overview
GigaDevice Semiconductor Inc - Product / Service
GigaDevice Semiconductor Inc - Key offerings
SWOT

15.7 Infineon Technologies AG

Infineon Technologies AG - Overview
Infineon Technologies AG - Business segments
Infineon Technologies AG - Key news
Infineon Technologies AG - Key offerings
Infineon Technologies AG - Segment focus
SWOT

15.8 Integrated Silicon Solution

Integrated Silicon Solution - Overview
Integrated Silicon Solution - Product / Service
Integrated Silicon Solution - Key offerings
SWOT

15.9 Macronix International Co Ltd

Macronix International Co Ltd - Overview
Macronix International Co Ltd - Product / Service
Macronix International Co Ltd - Key offerings
SWOT

15.10 Microchip Technology Inc.

Microchip Technology Inc. - Overview
Microchip Technology Inc. - Business segments
Microchip Technology Inc. - Key news
Microchip Technology Inc. - Key offerings
Microchip Technology Inc. - Segment focus
SWOT

15.11 Micron Technology Inc.

Micron Technology Inc. - Overview
Micron Technology Inc. - Business segments
Micron Technology Inc. - Key news
Micron Technology Inc. - Key offerings
Micron Technology Inc. - Segment focus
SWOT

15.12 Renesas Electronics Corp.

Renesas Electronics Corp. - Overview
Renesas Electronics Corp. - Business segments
Renesas Electronics Corp. - Key news
Renesas Electronics Corp. - Key offerings
Renesas Electronics Corp. - Segment focus
SWOT

15.13 Rochester Electronics LLC

Rochester Electronics LLC - Overview
Rochester Electronics LLC - Product / Service
Rochester Electronics LLC - Key offerings
SWOT

15.14 ROHM Co. Ltd.

ROHM Co. Ltd. - Overview
ROHM Co. Ltd. - Business segments
ROHM Co. Ltd. - Key news
ROHM Co. Ltd. - Key offerings
ROHM Co. Ltd. - Segment focus
SWOT

15.15 Sino Wealth Electronic Ltd.

Sino Wealth Electronic Ltd. - Overview
Sino Wealth Electronic Ltd. - Product / Service
Sino Wealth Electronic Ltd. - Key offerings
SWOT

15.16 Winbond Electronics Corp.

Winbond Electronics Corp. - Overview
Winbond Electronics Corp. - Business segments
Winbond Electronics Corp. - Key news
Winbond Electronics Corp. - Key offerings
Winbond Electronics Corp. - Segment focus
SWOT

15.17 Wuhan Xinxin Semiconductor Manufacturing Co., Ltd.

Wuhan Xinxin Semiconductor Manufacturing Co., Ltd. - Overview
Wuhan Xinxin Semiconductor Manufacturing Co., Ltd. - Product / Service
Wuhan Xinxin Semiconductor Manufacturing Co., Ltd. - Key offerings
SWOT

15.18 XTX Technology Inc.

XTX Technology Inc. - Overview
XTX Technology Inc. - Product / Service
XTX Technology Inc. - Key offerings
SWOT

16. Appendix

16.1 Scope of the report

Market definition
Objectives
Notes and caveats

16.2 Inclusions and exclusions checklist

Inclusions checklist
Exclusions checklist

16.3 Currency conversion rates for US$

16.4 Research methodology

16.5 Data procurement

Information sources

16.6 Data validation

16.7 Validation techniques employed for market sizing

16.8 Data synthesis

16.9 360 degree market analysis

16.10 List of abbreviations

Research Methodology

Technavio presents a detailed picture of the market by way of study, synthesis, and summation of data from multiple sources. The analysts have presented the various facets of the market with a particular focus on identifying the key industry influencers. The data thus presented is comprehensive, reliable, and the result of extensive research, both primary and secondary.

INFORMATION SOURCES

Primary sources

  • Manufacturers and suppliers
  • Channel partners
  • Industry experts
  • Strategic decision makers

Secondary sources

  • Industry journals and periodicals
  • Government data
  • Financial reports of key industry players
  • Historical data
  • Press releases

DATA ANALYSIS

Data Synthesis

  • Collation of data
  • Estimation of key figures
  • Analysis of derived insights

Data Validation

  • Triangulation with data models
  • Reference against proprietary databases
  • Corroboration with industry experts

REPORT WRITING

Qualitative

  • Market drivers
  • Market challenges
  • Market trends
  • Five forces analysis

Quantitative

  • Market size and forecast
  • Market segmentation
  • Geographical insights
  • Competitive landscape

Interested in this report?

Get your sample now to see our research methodology and insights!

Download Now

Frequently Asked Questions

NOR Flash market growth will increase by USD 2328.3 million during 2026-2030.

The NOR Flash market is expected to grow at a CAGR of 11.3% during 2026-2030.

NOR Flash market is segmented by Type (Serial NOR flash, Parallel NOR flash) End-user (Consumer electronics, Communication, Automotive, Industrial, Others) Product type (Quad SPI, SPI single or dual, Octal and xSPI)

Alliance Memory Inc., Amkor Technology Inc., Cypress Semiconductor Corp, Elite Semiconductor Tech Inc., Giantec Semiconductor Corp., GigaDevice Semiconductor Inc, Infineon Technologies AG, Integrated Silicon Solution, Macronix International Co Ltd, Microchip Technology Inc., Micron Technology Inc., Renesas Electronics Corp., Rochester Electronics LLC, ROHM Co. Ltd., Sino Wealth Electronic Ltd., Winbond Electronics Corp., Wuhan Xinxin Semiconductor Manufacturing Co., Ltd., XTX Technology Inc. are a few of the key vendors in the NOR Flash market.

APAC will register the highest growth rate of 58.8% among the other regions. Therefore, the NOR Flash market in APAC is expected to garner significant business opportunities for the vendors during the forecast period.

China, Taiwan, South Korea, Japan, India, Australia, US, Canada, Mexico, Germany, UK, France, The Netherlands, Italy, Spain, Brazil, Argentina, Colombia, UAE, Saudi Arabia, South Africa, Egypt, Israel

  • Increasing demand for high-performance electronics is the driving factor this market.

The NOR Flash market vendors should focus on grabbing business opportunities from the Type segment as it accounted for the largest market share in the base year.