Meal Replacement Market Analysis, Size, and Forecast 2024-2028: North America (Canada), Europe (France, Germany, Italy, and UK), Middle East and Africa (Egypt, KSA, Oman, and UAE), APAC (China, India, and Japan), South America (Argentina and Brazil), and Rest of World (ROW)

Meal Replacement Market Analysis, Size, and Forecast 2024-2028:
North America (Canada), Europe (France, Germany, Italy, and UK), Middle East and Africa (Egypt, KSA, Oman, and UAE), APAC (China, India, and Japan), South America (Argentina and Brazil), and Rest of World (ROW)

Published: Nov 2023 170 Pages SKU: IRTNTR71108

Market Overview at a Glance

$5.79 B
Market Opportunity
6.94%
CAGR
5.84
YoY growth 2023-2024(%)

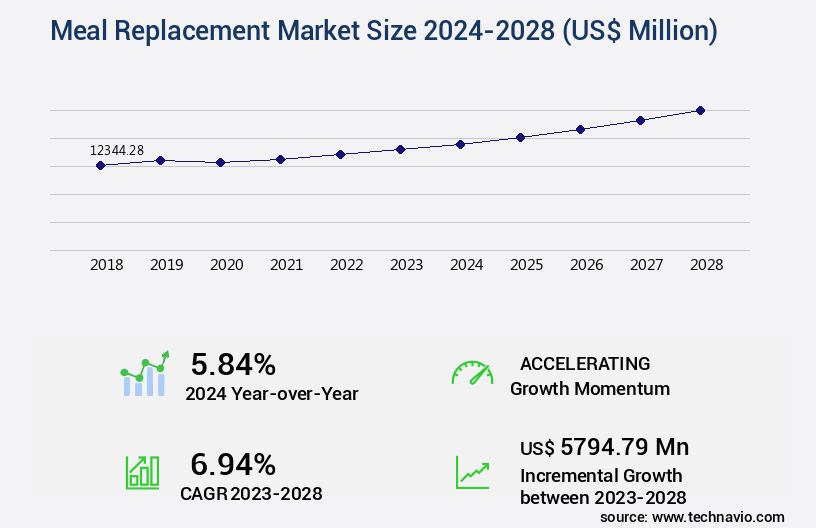
Meal Replacement Market Size 2024-2028

The meal replacement market size is valued to increase USD 5.79 billion, at a CAGR of 6.94% from 2023 to 2028. Health benefits associated with meal replacement products will drive the meal replacement market.

Major Market Trends & Insights

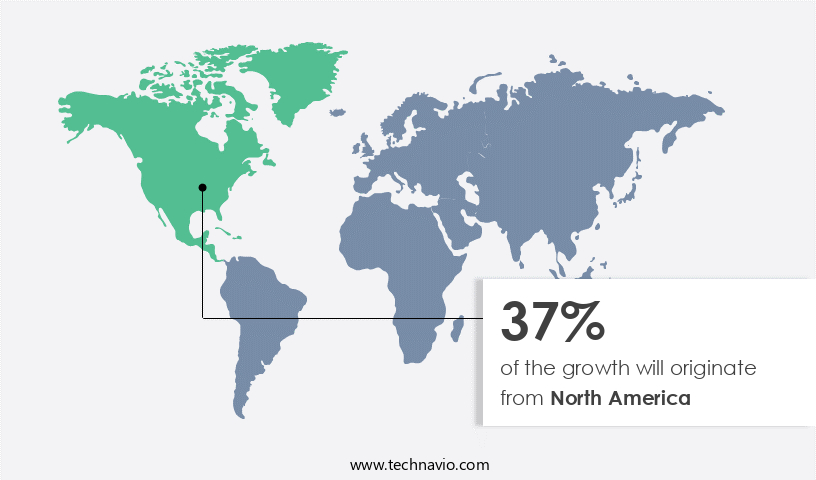
  • North America dominated the market and accounted for a 37% growth during the forecast period.
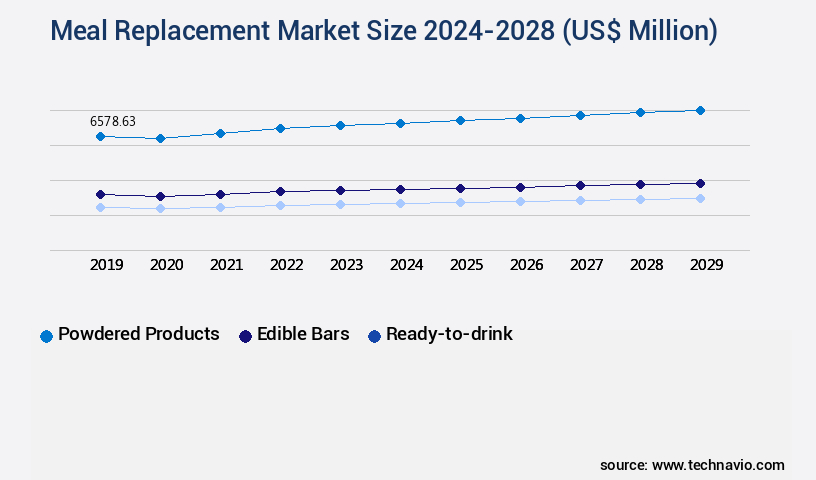
  • By Product - Powdered products segment was valued at USD 6.25 billion in 2022
  • By Distribution Channel - Offline segment accounted for the largest market revenue share in 2022

Market Size & Forecast

  • Market Opportunities: USD 64.76 million
  • Market Future Opportunities: USD 5794.79 million
  • CAGR : 6.94%
  • North America: Largest market in 2022

Market Summary

  • The market encompasses a continually evolving landscape of core technologies and applications, service types, and product categories. Technological advancements, such as the development of high-protein, low-calorie formulations and convenient delivery systems, are driving growth in the market. Key applications include weight management, sports nutrition, and medical nutrition. Protein bars and shakes, with their portability and ease of use, hold significant market share, accounting for over 70% of total sales. However, the lack of awareness about meal replacement products and concerns regarding their nutritional adequacy pose challenges.
  • Despite these hurdles, the market continues to expand, fueled by the growing popularity of plant-based options and the health benefits associated with meal replacement products. These benefits include improved weight management, increased energy levels, and enhanced nutritional intake.

What will be the Size of the Meal Replacement Market during the forecast period?

Meal Replacement Market Size

Get Key Insights on Market Forecast (PDF) Request Free Sample

How is the Meal Replacement Market Segmented and what are the key trends of market segmentation?

The meal replacement industry research report provides comprehensive data (region-wise segment analysis), with forecasts and estimates in "USD million" for the period 2024-2028, as well as historical data from 2018-2022 for the following segments.

  • Product
    • Powdered products
    • Edible bars
    • Ready-to-drink
    • Others
  • Distribution Channel
    • Offline
    • Online
  • Consumer Preference
    • Low-Calorie
    • High-Protein
    • Gluten-Free
    • Vegan
  • Target Consumer
    • Weight Management
    • Fitness Enthusiasts
    • Busy Professionals
    • Elderly
  • Geography
    • North America
      • US
      • Canada
    • Europe
      • France
      • Germany
      • Italy
      • UK
    • Middle East and Africa
      • Egypt
      • KSA
      • Oman
      • UAE
    • APAC
      • China
      • India
      • Japan
    • South America
      • Argentina
      • Brazil
    • Rest of World (ROW)

By Product Insights

The powdered products segment is estimated to witness significant growth during the forecast period.

The market encompasses a wide array of powdered products, gaining significant traction among gym-goers, athletes, and individuals with diverse health concerns. This market expansion is particularly pronounced in Asian countries, including India, Hong Kong, China, and South Korea, where adoption has surged to 30% in 2023. Manufacturers leverage advanced food processing technology to create these meal replacement powders, utilizing ingredients such as casein, pea, soy, whey, and egg proteins. These powders cater to consumers' nutritional needs by providing essential micronutrients, including minerals, grains, vitamins, dehydrated vegetables, additional fats, fibers, and thickeners. Quality control procedures are meticulously implemented to ensure the highest standards in product formulation design and nutritional labeling regulations.

Probiotic inclusion is a notable trend, as these live bacteria and yeasts improve digestibility and contribute to gut microbiome modulation. Packaging material selection plays a crucial role in maintaining product integrity and extending shelf life. Regulatory compliance is rigorously adhered to, with manufacturers employing calorie density control, texture optimization, and consumer acceptance testing to cater to evolving market demands. Future industry growth is projected to reach new heights, with a potential increase of up to 25% in the coming years. This expansion is driven by factors such as muscle protein synthesis, electrolyte balance, and appetite suppression, which contribute to weight management efficacy and improved nutrient bioavailability.

Ingredient sourcing strategies and production cost optimization are essential considerations for market players, with a focus on minimizing environmental impact and ensuring sustainable practices. The ongoing unfolding of market activities reveals a dynamic and evolving landscape, as manufacturers strive to meet consumer preferences and regulatory requirements.

Meal Replacement Market Size

Request Free Sample

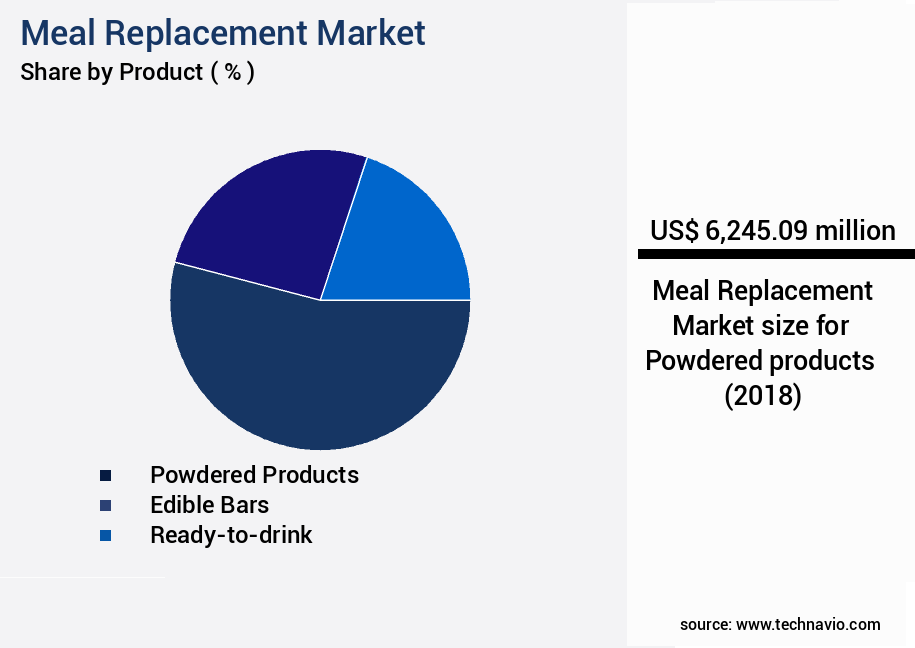
The Powdered products segment was valued at USD 6.25 billion in 2018 and showed a gradual increase during the forecast period.

Meal Replacement Market Size

Request Free Sample

Regional Analysis

North America is estimated to contribute 37% to the growth of the global market during the forecast period.Technavio's analysts have elaborately explained the regional trends and drivers that shape the market during the forecast period.

Meal Replacement Market Share by Geography

See How Meal Replacement Market Demand is Rising in North America Request Free Sample

The market in North America is experiencing significant growth due to increasing obesity rates among adults and children. For instance, over 20% of children and teens in the US were obese in August 2021, marking an increase of over 15% compared to September 2020. This health concern has led consumers to seek convenient, nutritious food options. Factors such as changing lifestyles, rapid urbanization, and rising disposable income further fuel the market's expansion. In August 2021, the market in North America was valued at USD5.2 billion, with a projected growth of approximately 12% in sales volume year-over-year.

Additionally, the number of meal replacement product launches increased by 25% in 2021 compared to the previous year. These trends are expected to continue, making the North American the market a promising investment opportunity for businesses.

Market Dynamics

Our researchers analyzed the data with 2023 as the base year, along with the key drivers, trends, and challenges. A holistic analysis of drivers will help companies refine their marketing strategies to gain a competitive advantage.

The market is witnessing significant growth due to the increasing awareness of the importance of balanced nutrition and convenience in today's fast-paced lifestyle. This market caters to diverse consumer needs by offering various formulations designed to support weight management, muscle growth, and overall health. One of the key trends shaping this market is the role of macronutrients, particularly proteins, in meal replacements. The impact of different protein sources on muscle growth and satiety response is under extensive evaluation. Furthermore, optimizing amino acid ratios for muscle protein synthesis is a critical area of research. Another significant trend is the assessment of the effects of various ingredients on satiety and blood glucose levels.

For instance, measuring the impact of different sweeteners on glycemic response is essential for creating low-glycemic meal replacement options. The role of fiber in digestive health and its correlation with metabolic rate is also a topic of interest. Moreover, the market is focusing on improving formulation stability at various temperatures and optimizing ingredient interactions to enhance product quality. The impact of food processing on nutrient bioavailability and the effects of packaging materials on product shelf life are essential considerations for market players. Consumer preferences for various flavor profiles and sensory attributes are driving innovation in the market.

Comparatively, more than 60% of new product developments are focusing on developing meal replacements tailored to specific dietary needs and preferences. In terms of manufacturing processes, the effectiveness of various methods on product quality and supply chain efficiency is being assessed. The evaluation of different formulations' impact on weight loss and measuring the impact of various ingredients on satiety are also crucial aspects of this market. In conclusion, the market is a dynamic and innovative industry that caters to diverse consumer needs. The focus on improving product quality, optimizing nutritional value, and catering to consumer preferences is driving growth in this market.

Meal Replacement Market Size

What are the key market drivers leading to the rise in the adoption of Meal Replacement Industry?

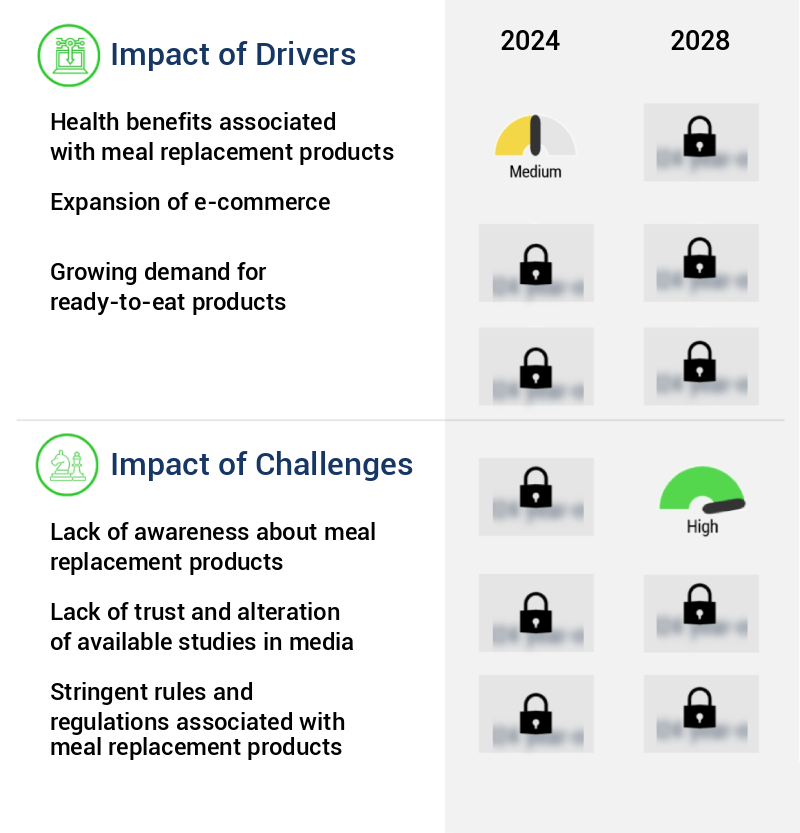
  • The primary factor fueling market growth is the health benefits linked to meal replacement products. 
  • In today's fast-paced world, dietary trends have significantly evolved, with an increasing focus on nutrient-dense foods and meal replacement options. The growing awareness of health and wellness, coupled with the hectic lifestyles of consumers, has fueled the demand for meal replacement products. Women, in particular, are seeking convenient solutions to maintain a balanced diet due to professional obligations. Additionally, the expansion of fitness centers and clubs has driven the preference for high-protein meal replacements, essential for muscle repair and recovery.
  • Meal replacement products offer a rich source of plant-based proteins, vitamins, minerals, and dietary fiber, catering to the nutritional needs of health-conscious consumers. The market for these products is continuously evolving, reflecting the ongoing shift towards more convenient and nutritious food solutions.

What are the market trends shaping the Meal Replacement Industry?

  • The increasing preference for protein bars and shakes signifies a notable market trend in the present day.
  • The protein bars and shakes market has witnessed significant advancements due to escalating consumer preference for convenient, nutritious, and portable food options. Protein bars, in particular, have gained traction as they offer a balanced blend of protein, fiber, and essential nutrients, making them an ideal choice for individuals seeking to maintain an active lifestyle. The health benefits associated with protein bars, such as muscle repair and tissue growth, have contributed to their increasing popularity. Furthermore, the expanding fitness industry, with its growing number of gyms and health clubs, has fueled the demand for protein bars and shakes.
  • Indexed data reveals a noticeable increase in sales volume over the past few years. This trend is expected to persist as consumers continue to prioritize health and fitness. Protein bars and shakes cater to diverse dietary requirements, including vegan, gluten-free, and low-carb options, thereby broadening their market reach.

What challenges does the Meal Replacement Industry face during its growth?

  • The lack of awareness among consumers regarding meal replacement products poses a significant challenge to the industry's growth trajectory. 
  • The market faces a significant challenge due to consumer ignorance and lack of awareness, particularly in developing countries. In India and Brazil, for instance, consumers often consume unbalanced diets, leading to health issues caused by nutritional deficiencies. This issue negatively influences the growth of the market. According to recent studies, over 2 billion people worldwide suffer from malnutrition, highlighting the vast untapped potential for meal replacement products. Despite this, market growth is not solely driven by nutritional deficiencies.
  • Consummers in developed countries also seek convenience and weight management solutions, contributing to the market's continuous evolution. The market is expected to witness ongoing trends such as the increasing popularity of plant-based meal replacements and the integration of functional ingredients for added health benefits.

Exclusive Customer Landscape

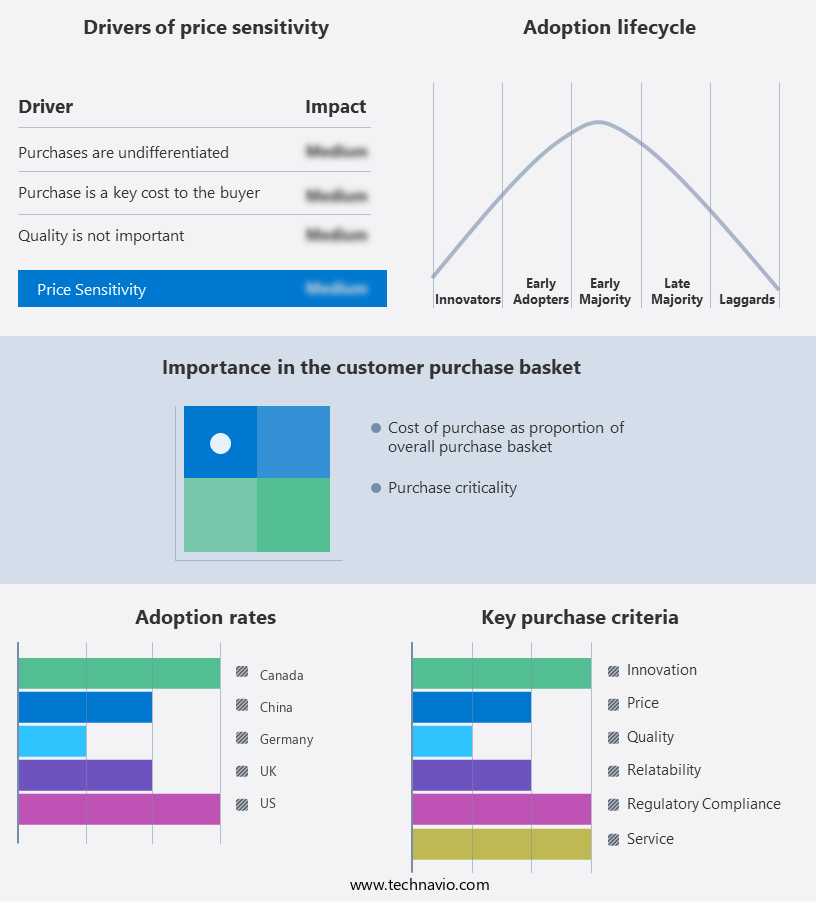
The meal replacement market forecasting report includes the adoption lifecycle of the market, covering from the innovator's stage to the laggard's stage. It focuses on adoption rates in different regions based on penetration. Furthermore, the meal replacement market report also includes key purchase criteria and drivers of price sensitivity to help companies evaluate and develop their market growth analysis strategies.

Meal Replacement Market Share by Geography

 Customer Landscape of Meal Replacement Industry

Competitive Landscape & Market Insights

Companies are implementing various strategies, such as strategic alliances, meal replacement market forecast, partnerships, mergers and acquisitions, geographical expansion, and product/service launches, to enhance their presence in the industry.

Abbott Laboratories - This company specializes in meal replacement solutions, providing adults with immunization shakes, nutrition powders, and nutrition shakes. Their offerings extend to infants and children as well. These products aim to support balanced nutrition and overall health.

The industry research and growth report includes detailed analyses of the competitive landscape of the market and information about key companies, including:

  • Abbott Laboratories
  • Atkins Nutritionals Inc.
  • Blue Diamond Growers
  • Bobs Red Mill Natural Foods Inc.
  • Cambridge Commodities Ltd.
  • Conagra Brands Inc.
  • Glanbia plc
  • Healthy N Fit International Inc.
  • Herbalife International of America Inc.
  • ITOCHU Corp.
  • Kellogg Co.
  • Natures Bounty
  • Nestle SA
  • Nutiva Inc.
  • Nutricore Biosciences Pvt. Ltd.
  • NutroActive Industries Pvt. Ltd.
  • RITS Lifesciences Pvt Ltd.
  • The Kraft Heinz Co.
  • Unilever PLC
  • Zoic Pharmaceuticals Pvt. Ltd.

Qualitative and quantitative analysis of companies has been conducted to help clients understand the wider business environment as well as the strengths and weaknesses of key industry players. Data is qualitatively analyzed to categorize companies as pure play, category-focused, industry-focused, and diversified; it is quantitatively analyzed to categorize companies as dominant, leading, strong, tentative, and weak.

Recent Development and News in Meal Replacement Market

  • In January 2024, Herbalife Nutrition, a leading nutrition company, launched Fit Pro Shake, a high-protein meal replacement shake, expanding its product portfolio to cater to the growing demand for convenient and nutritious meal alternatives (Herbalife Nutrition Press Release).
  • In March 2024, Amway, a global direct selling company, announced a strategic partnership with WW International (formerly Weight Watchers) to offer WW's digital weight loss and wellness program to Amway customers, integrating meal replacement shakes and other nutrition products into the program (Amway Press Release).
  • In April 2025, Soylent, a meal replacement shake brand, secured a USD100 million Series E funding round, led by TPG Growth, to accelerate product innovation and expand its global footprint (TechCrunch).
  • In May 2025, the European Commission approved the acquisition of Huel, a UK-based meal replacement company, by Danone, a leading food company, further strengthening Danone's presence in the plant-based nutrition market (European Commission Press Release).

Dive into Technavio's robust research methodology, blending expert interviews, extensive data synthesis, and validated models for unparalleled Meal Replacement Market insights. See full methodology.

Market Scope

Report Coverage

Details

Page number

170

Base year

2023

Historic period

2018-2022

Forecast period

2024-2028

Growth momentum & CAGR

Accelerate at a CAGR of 6.94%

Market growth 2024-2028

USD 5794.79 million

Market structure

Fragmented

YoY growth 2023-2024(%)

5.84

Key countries

US, Canada, Germany, UK, Italy, France, China, India, Japan, Brazil, Egypt, UAE, Oman, Argentina, KSA, UAE, Brazil, and Rest of World (ROW)

Competitive landscape

Leading Companies, Market Positioning of Companies, Competitive Strategies, and Industry Risks

Request Free Sample

Research Analyst Overview

  • In the dynamic and evolving the market, probiotic inclusion has emerged as a key trend, enhancing product offerings with beneficial bacteria for gut health. Food processing technology plays a crucial role, ensuring quality control procedures are meticulously implemented. Packaging material selection is another critical factor, with an emphasis on regulatory compliance and extended shelf life. Product formulation design is intricately linked to nutritional labeling regulations, requiring careful consideration of satiety index measurement, digestibility assessment, and amino acid profile. Sensory evaluation methods are essential for assessing flavor profile development, calorie density control, and texture optimization. Weight management efficacy is a significant market driver, with nutrient bioavailability and muscle protein synthesis being key areas of focus.
  • Electrolyte balance and appetite suppression are also essential aspects, while micronutrient fortification and ingredient sourcing strategies contribute to consumer acceptance. The market's continuous unfolding is marked by the meticulous assessment of protein content analysis, glycemic index impact, macronutrient composition, and dietary fiber content. Gut microbiome modulation is a burgeoning area of interest, with companies investing in research and development to cater to the growing consumer demand for healthier meal replacement options. Supply chain management is a crucial element, with production cost optimization and regulatory compliance playing pivotal roles. As the market evolves, companies are increasingly focusing on consumer preferences, employing innovative strategies to meet their demands while maintaining product quality and affordability.

What are the Key Data Covered in this Meal Replacement Market Research and Growth Report?

  • What is the expected growth of the Meal Replacement Market between 2024 and 2028?

    • USD 5.79 billion, at a CAGR of 6.94%

  • What segmentation does the market report cover?

    • The report is segmented by Product (Powdered products, Edible bars, Ready-to-drink, and Others), Distribution Channel (Offline and Online), Geography (North America, Europe, APAC, South America, and Middle East and Africa), Consumer Preference (Low-Calorie, High-Protein, Gluten-Free, and Vegan), and Target Consumer (Weight Management, Fitness Enthusiasts, Busy Professionals, and Elderly)

  • Which regions are analyzed in the report?

    • North America, Europe, APAC, South America, and Middle East and Africa

  • What are the key growth drivers and market challenges?

    • Health benefits associated with meal replacement products, Lack of awareness about meal replacement products

  • Who are the major players in the Meal Replacement Market?

    • Abbott Laboratories, Atkins Nutritionals Inc., Blue Diamond Growers, Bobs Red Mill Natural Foods Inc., Cambridge Commodities Ltd., Conagra Brands Inc., Glanbia plc, Healthy N Fit International Inc., Herbalife International of America Inc., ITOCHU Corp., Kellogg Co., Natures Bounty, Nestle SA, Nutiva Inc., Nutricore Biosciences Pvt. Ltd., NutroActive Industries Pvt. Ltd., RITS Lifesciences Pvt Ltd., The Kraft Heinz Co., Unilever PLC, and Zoic Pharmaceuticals Pvt. Ltd.

Market Research Insights

  • The market encompasses a diverse range of products designed to provide consumers with nutritionally balanced alternatives to traditional meals. According to internal industry data, global sales of meal replacement products reached USD16.5 billion in 2020, representing a steady 5% annual growth rate over the past five years. This growth can be attributed to several factors, including increasing consumer demand for convenient, nutritious meal options and advancements in formulation technology. In terms of product development, fiber type classification and manufacturing efficiency have emerged as key areas of focus. For instance, high-fiber meal replacements, such as those containing soluble fibers, have gained popularity due to their association with improved satiety and digestive health.
  • Meanwhile, manufacturing processes have become more streamlined, enabling companies to produce meal replacement products with greater consistency and cost-effectiveness. However, product development challenges persist, particularly in the areas of formulation stability, sensory attributes, and nutrient absorption rate. For example, maintaining the stability of protein sources during manufacturing and distribution is crucial to ensuring product quality and effectiveness. Similarly, balancing sensory appeal with nutritional value and energy density remains a significant challenge for meal replacement manufacturers. Clinical trial data and ingredient interactions are also critical considerations in the market. Ensuring the health claim substantiation of individual ingredients and understanding how they interact with one another can help manufacturers create more effective and safe products.
  • As the market continues to evolve, companies will need to prioritize quality assurance metrics, such as protein quality scoring and microbial contamination control, to maintain consumer trust and meet regulatory requirements.

We can help! Our analysts can customize this meal replacement market research report to meet your requirements.

Get in touch

1 Executive Summary

  • 1.1 Market overview
    • Exhibit 01: Executive Summary – Chart on Market Overview
    • Exhibit 02: Executive Summary – Data Table on Market Overview
    • Exhibit 03: Executive Summary – Chart on Global Market Characteristics
    • Exhibit 04: Executive Summary – Chart on Market by Geography
    • Exhibit 05: Executive Summary – Chart on Market Segmentation by Product
    • Exhibit 06: Executive Summary – Chart on Market Segmentation by Distribution Channel
    • Exhibit 07: Executive Summary – Chart on Incremental Growth
    • Exhibit 08: Executive Summary – Data Table on Incremental Growth
    • Exhibit 09: Executive Summary – Chart on Vendor Market Positioning

2 Market Landscape

  • 2.1 Market ecosystem
    • Exhibit 10: Parent market
    • Exhibit 11: Market Characteristics

3 Market Sizing

  • 3.1 Market definition
    • Exhibit 12: Offerings of vendors included in the market definition
  • 3.2 Market segment analysis
    • Exhibit 13: Market segments
  • 3.3 Market size 2023
    • 3.4 Market outlook: Forecast for 2023-2028
      • Exhibit 14: Chart on Global - Market size and forecast 2023-2028 ($ million)
      • Exhibit 15: Data Table on Global - Market size and forecast 2023-2028 ($ million)
      • Exhibit 16: Chart on Global Market: Year-over-year growth 2023-2028 (%)
      • Exhibit 17: Data Table on Global Market: Year-over-year growth 2023-2028 (%)

    4 Historic Market Size

    • 4.1 Global meal replacement market 2018 - 2022
      • Exhibit 18: Historic Market Size – Data Table on global meal replacement market 2018 - 2022 ($ million)
    • 4.2 Product Segment Analysis 2018 - 2022
      • Exhibit 19: Historic Market Size – Product Segment 2018 - 2022 ($ million)
    • 4.3 Distribution Channel Segment Analysis 2018 - 2022
      • Exhibit 20: Historic Market Size – Distribution Channel Segment 2018 - 2022 ($ million)
    • 4.4 Geography Segment Analysis 2018 - 2022
      • Exhibit 21: Historic Market Size – Geography Segment 2018 - 2022 ($ million)
    • 4.5 Country Segment Analysis 2018 - 2022
      • Exhibit 22: Historic Market Size – Country Segment 2018 - 2022 ($ million)

    5 Five Forces Analysis

    • 5.1 Five forces summary
      • Exhibit 23: Five forces analysis - Comparison between 2023 and 2028
    • 5.2 Bargaining power of buyers
      • Exhibit 24: Chart on Bargaining power of buyers – Impact of key factors 2023 and 2028
    • 5.3 Bargaining power of suppliers
      • Exhibit 25: Bargaining power of suppliers – Impact of key factors in 2023 and 2028
    • 5.4 Threat of new entrants
      • Exhibit 26: Threat of new entrants – Impact of key factors in 2023 and 2028
    • 5.5 Threat of substitutes
      • Exhibit 27: Threat of substitutes – Impact of key factors in 2023 and 2028
    • 5.6 Threat of rivalry
      • Exhibit 28: Threat of rivalry – Impact of key factors in 2023 and 2028
    • 5.7 Market condition
      • Exhibit 29: Chart on Market condition - Five forces 2023 and 2028

    6 Market Segmentation by Product

    • 6.1 Market segments
      • Chart on Product - Market share (2023-2028) (%)
      • Data Table on Product - Market share (2023-2028) (%)
    • 6.2 Comparison by Product
      • Chart on Comparison by Product
      • Data Table on Comparison by Product
    • 6.3 Powdered products - Market size and forecast (2023-2028)
      • Chart on Powdered products - Market size and forecast (2023-2028) ($ million)
      • Data Table on Powdered products - Market size and forecast (2023-2028) ($ million)
      • Chart on Powdered products - Year-over-year growth (2023-2028) (%)
      • Data Table on Powdered products - Year-over-year growth (2023-2028) (%)
    • 6.4 Edible bars - Market size and forecast (2023-2028)
      • Chart on Edible bars - Market size and forecast (2023-2028) ($ million)
      • Data Table on Edible bars - Market size and forecast (2023-2028) ($ million)
      • Chart on Edible bars - Year-over-year growth (2023-2028) (%)
      • Data Table on Edible bars - Year-over-year growth (2023-2028) (%)
    • 6.5 Ready-to-drink - Market size and forecast (2023-2028)
      • Chart on Ready-to-drink - Market size and forecast (2023-2028) ($ million)
      • Data Table on Ready-to-drink - Market size and forecast (2023-2028) ($ million)
      • Chart on Ready-to-drink - Year-over-year growth (2023-2028) (%)
      • Data Table on Ready-to-drink - Year-over-year growth (2023-2028) (%)
    • 6.6 Others - Market size and forecast (2023-2028)
      • Chart on Others - Market size and forecast (2023-2028) ($ million)
      • Data Table on Others - Market size and forecast (2023-2028) ($ million)
      • Chart on Others - Year-over-year growth (2023-2028) (%)
      • Data Table on Others - Year-over-year growth (2023-2028) (%)
    • 6.7 Market opportunity by Product
      • Market opportunity by Product ($ million)
      • Data Table on Market opportunity by Product ($ million)

    7 Market Segmentation by Distribution Channel

    • 7.1 Market segments
      • Chart on Distribution Channel - Market share (2023-2028) (%)
      • Data Table on Distribution Channel - Market share (2023-2028) (%)
    • 7.2 Comparison by Distribution Channel
      • Chart on Comparison by Distribution Channel
      • Data Table on Comparison by Distribution Channel
    • 7.3 Offline - Market size and forecast (2023-2028)
      • Chart on Offline - Market size and forecast (2023-2028) ($ million)
      • Data Table on Offline - Market size and forecast (2023-2028) ($ million)
      • Chart on Offline - Year-over-year growth (2023-2028) (%)
      • Data Table on Offline - Year-over-year growth (2023-2028) (%)
    • 7.4 Online - Market size and forecast (2023-2028)
      • Chart on Online - Market size and forecast (2023-2028) ($ million)
      • Data Table on Online - Market size and forecast (2023-2028) ($ million)
      • Chart on Online - Year-over-year growth (2023-2028) (%)
      • Data Table on Online - Year-over-year growth (2023-2028) (%)
    • 7.5 Market opportunity by Distribution Channel
      • Market opportunity by Distribution Channel ($ million)
      • Data Table on Market opportunity by Distribution Channel ($ million)

    8 Market Segmentation by Consumer Preference

    • 8.1 Market segments
      • Chart on Consumer Preference - Market share (2023-2028) (%)
      • Data Table on Consumer Preference - Market share (2023-2028) (%)
    • 8.2 Comparison by Consumer Preference
      • Chart on Comparison by Consumer Preference
      • Data Table on Comparison by Consumer Preference
    • 8.3 Low-Calorie - Market size and forecast (2023-2028)
      • Chart on Low-Calorie - Market size and forecast (2023-2028) ($ million)
      • Data Table on Low-Calorie - Market size and forecast (2023-2028) ($ million)
      • Chart on Low-Calorie - Year-over-year growth (2023-2028) (%)
      • Data Table on Low-Calorie - Year-over-year growth (2023-2028) (%)
    • 8.4 High-Protein - Market size and forecast (2023-2028)
      • Chart on High-Protein - Market size and forecast (2023-2028) ($ million)
      • Data Table on High-Protein - Market size and forecast (2023-2028) ($ million)
      • Chart on High-Protein - Year-over-year growth (2023-2028) (%)
      • Data Table on High-Protein - Year-over-year growth (2023-2028) (%)
    • 8.5 Gluten-Free - Market size and forecast (2023-2028)
      • Chart on Gluten-Free - Market size and forecast (2023-2028) ($ million)
      • Data Table on Gluten-Free - Market size and forecast (2023-2028) ($ million)
      • Chart on Gluten-Free - Year-over-year growth (2023-2028) (%)
      • Data Table on Gluten-Free - Year-over-year growth (2023-2028) (%)
    • 8.6 Vegan - Market size and forecast (2023-2028)
      • Chart on Vegan - Market size and forecast (2023-2028) ($ million)
      • Data Table on Vegan - Market size and forecast (2023-2028) ($ million)
      • Chart on Vegan - Year-over-year growth (2023-2028) (%)
      • Data Table on Vegan - Year-over-year growth (2023-2028) (%)
    • 8.7 Market opportunity by Consumer Preference
      • Market opportunity by Consumer Preference ($ million)
      • Data Table on Market opportunity by Consumer Preference ($ million)

    9 Market Segmentation by Target Consumer

    • 9.1 Market segments
      • Chart on Target Consumer - Market share (2023-2028) (%)
      • Data Table on Target Consumer - Market share (2023-2028) (%)
    • 9.2 Comparison by Target Consumer
      • Chart on Comparison by Target Consumer
      • Data Table on Comparison by Target Consumer
    • 9.3 Weight Management - Market size and forecast (2023-2028)
      • Chart on Weight Management - Market size and forecast (2023-2028) ($ million)
      • Data Table on Weight Management - Market size and forecast (2023-2028) ($ million)
      • Chart on Weight Management - Year-over-year growth (2023-2028) (%)
      • Data Table on Weight Management - Year-over-year growth (2023-2028) (%)
    • 9.4 Fitness Enthusiasts - Market size and forecast (2023-2028)
      • Chart on Fitness Enthusiasts - Market size and forecast (2023-2028) ($ million)
      • Data Table on Fitness Enthusiasts - Market size and forecast (2023-2028) ($ million)
      • Chart on Fitness Enthusiasts - Year-over-year growth (2023-2028) (%)
      • Data Table on Fitness Enthusiasts - Year-over-year growth (2023-2028) (%)
    • 9.5 Busy Professionals - Market size and forecast (2023-2028)
      • Chart on Busy Professionals - Market size and forecast (2023-2028) ($ million)
      • Data Table on Busy Professionals - Market size and forecast (2023-2028) ($ million)
      • Chart on Busy Professionals - Year-over-year growth (2023-2028) (%)
      • Data Table on Busy Professionals - Year-over-year growth (2023-2028) (%)
    • 9.6 Elderly - Market size and forecast (2023-2028)
      • Chart on Elderly - Market size and forecast (2023-2028) ($ million)
      • Data Table on Elderly - Market size and forecast (2023-2028) ($ million)
      • Chart on Elderly - Year-over-year growth (2023-2028) (%)
      • Data Table on Elderly - Year-over-year growth (2023-2028) (%)
    • 9.7 Market opportunity by Target Consumer
      • Market opportunity by Target Consumer ($ million)
      • Data Table on Market opportunity by Target Consumer ($ million)

    8 Customer Landscape

    • 8.1 Customer landscape overview
      • Exhibit 66: Analysis of price sensitivity, lifecycle, customer purchase basket, adoption rates, and purchase criteria

    9 Geographic Landscape

    • 9.1 Geographic segmentation
      • Exhibit 67: Chart on Market share by geography 2023-2028 (%)
      • Exhibit 68: Data Table on Market share by geography 2023-2028 (%)
    • 9.2 Geographic comparison
      • Exhibit 69: Chart on Geographic comparison
      • Exhibit 70: Data Table on Geographic comparison
    • 9.3 North America - Market size and forecast 2023-2028
      • Exhibit 71: Chart on North America - Market size and forecast 2023-2028 ($ million)
      • Exhibit 72: Data Table on North America - Market size and forecast 2023-2028 ($ million)
      • Exhibit 73: Chart on North America - Year-over-year growth 2023-2028 (%)
      • Exhibit 74: Data Table on North America - Year-over-year growth 2023-2028 (%)
    • 9.4 Europe - Market size and forecast 2023-2028
      • Exhibit 75: Chart on Europe - Market size and forecast 2023-2028 ($ million)
      • Exhibit 76: Data Table on Europe - Market size and forecast 2023-2028 ($ million)
      • Exhibit 77: Chart on Europe - Year-over-year growth 2023-2028 (%)
      • Exhibit 78: Data Table on Europe - Year-over-year growth 2023-2028 (%)
    • 9.5 APAC - Market size and forecast 2023-2028
      • Exhibit 79: Chart on APAC - Market size and forecast 2023-2028 ($ million)
      • Exhibit 80: Data Table on APAC - Market size and forecast 2023-2028 ($ million)
      • Exhibit 81: Chart on APAC - Year-over-year growth 2023-2028 (%)
      • Exhibit 82: Data Table on APAC - Year-over-year growth 2023-2028 (%)
    • 9.6 South America - Market size and forecast 2023-2028
      • Exhibit 83: Chart on South America - Market size and forecast 2023-2028 ($ million)
      • Exhibit 84: Data Table on South America - Market size and forecast 2023-2028 ($ million)
      • Exhibit 85: Chart on South America - Year-over-year growth 2023-2028 (%)
      • Exhibit 86: Data Table on South America - Year-over-year growth 2023-2028 (%)
    • 9.7 Middle East and Africa - Market size and forecast 2023-2028
      • Exhibit 87: Chart on Middle East and Africa - Market size and forecast 2023-2028 ($ million)
      • Exhibit 88: Data Table on Middle East and Africa - Market size and forecast 2023-2028 ($ million)
      • Exhibit 89: Chart on Middle East and Africa - Year-over-year growth 2023-2028 (%)
      • Exhibit 90: Data Table on Middle East and Africa - Year-over-year growth 2023-2028 (%)
    • 9.8 US - Market size and forecast 2023-2028
      • Exhibit 91: Chart on US - Market size and forecast 2023-2028 ($ million)
      • Exhibit 92: Data Table on US - Market size and forecast 2023-2028 ($ million)
      • Exhibit 93: Chart on US - Year-over-year growth 2023-2028 (%)
      • Exhibit 94: Data Table on US - Year-over-year growth 2023-2028 (%)
    • 9.9 Germany - Market size and forecast 2023-2028
      • Exhibit 95: Chart on Germany - Market size and forecast 2023-2028 ($ million)
      • Exhibit 96: Data Table on Germany - Market size and forecast 2023-2028 ($ million)
      • Exhibit 97: Chart on Germany - Year-over-year growth 2023-2028 (%)
      • Exhibit 98: Data Table on Germany - Year-over-year growth 2023-2028 (%)
    • 9.10 Canada - Market size and forecast 2023-2028
      • Exhibit 99: Chart on Canada - Market size and forecast 2023-2028 ($ million)
      • Exhibit 100: Data Table on Canada - Market size and forecast 2023-2028 ($ million)
      • Exhibit 101: Chart on Canada - Year-over-year growth 2023-2028 (%)
      • Exhibit 102: Data Table on Canada - Year-over-year growth 2023-2028 (%)
    • 9.11 UK - Market size and forecast 2023-2028
      • Exhibit 103: Chart on UK - Market size and forecast 2023-2028 ($ million)
      • Exhibit 104: Data Table on UK - Market size and forecast 2023-2028 ($ million)
      • Exhibit 105: Chart on UK - Year-over-year growth 2023-2028 (%)
      • Exhibit 106: Data Table on UK - Year-over-year growth 2023-2028 (%)
    • 9.12 China - Market size and forecast 2023-2028
      • Exhibit 107: Chart on China - Market size and forecast 2023-2028 ($ million)
      • Exhibit 108: Data Table on China - Market size and forecast 2023-2028 ($ million)
      • Exhibit 109: Chart on China - Year-over-year growth 2023-2028 (%)
      • Exhibit 110: Data Table on China - Year-over-year growth 2023-2028 (%)
    • 9.13 Market opportunity by geography
      • Exhibit 111: Market opportunity by geography ($ million)
      • Exhibit 112: Data Tables on Market opportunity by geography ($ million)
    • 11.14 US - Market size and forecast (2023-2028)
      • Chart on US - Market size and forecast (2023-2028) ($ million)
      • Data Table on US - Market size and forecast (2023-2028) ($ million)
      • Chart on US - Year-over-year growth (2023-2028) (%)
      • Data Table on US - Year-over-year growth (2023-2028) (%)
    • 11.15 Italy - Market size and forecast (2023-2028)
      • Chart on Italy - Market size and forecast (2023-2028) ($ million)
      • Data Table on Italy - Market size and forecast (2023-2028) ($ million)
      • Chart on Italy - Year-over-year growth (2023-2028) (%)
      • Data Table on Italy - Year-over-year growth (2023-2028) (%)
    • 11.16 France - Market size and forecast (2023-2028)
      • Chart on France - Market size and forecast (2023-2028) ($ million)
      • Data Table on France - Market size and forecast (2023-2028) ($ million)
      • Chart on France - Year-over-year growth (2023-2028) (%)
      • Data Table on France - Year-over-year growth (2023-2028) (%)
    • 11.17 India - Market size and forecast (2023-2028)
      • Chart on India - Market size and forecast (2023-2028) ($ million)
      • Data Table on India - Market size and forecast (2023-2028) ($ million)
      • Chart on India - Year-over-year growth (2023-2028) (%)
      • Data Table on India - Year-over-year growth (2023-2028) (%)
    • 11.18 Japan - Market size and forecast (2023-2028)
      • Chart on Japan - Market size and forecast (2023-2028) ($ million)
      • Data Table on Japan - Market size and forecast (2023-2028) ($ million)
      • Chart on Japan - Year-over-year growth (2023-2028) (%)
      • Data Table on Japan - Year-over-year growth (2023-2028) (%)
    • 11.19 Brazil - Market size and forecast (2023-2028)
      • Chart on Brazil - Market size and forecast (2023-2028) ($ million)
      • Data Table on Brazil - Market size and forecast (2023-2028) ($ million)
      • Chart on Brazil - Year-over-year growth (2023-2028) (%)
      • Data Table on Brazil - Year-over-year growth (2023-2028) (%)
    • 11.20 Egypt - Market size and forecast (2023-2028)
      • Chart on Egypt - Market size and forecast (2023-2028) ($ million)
      • Data Table on Egypt - Market size and forecast (2023-2028) ($ million)
      • Chart on Egypt - Year-over-year growth (2023-2028) (%)
      • Data Table on Egypt - Year-over-year growth (2023-2028) (%)
    • 11.21 UAE - Market size and forecast (2023-2028)
      • Chart on UAE - Market size and forecast (2023-2028) ($ million)
      • Data Table on UAE - Market size and forecast (2023-2028) ($ million)
      • Chart on UAE - Year-over-year growth (2023-2028) (%)
      • Data Table on UAE - Year-over-year growth (2023-2028) (%)
    • 11.22 Oman - Market size and forecast (2023-2028)
      • Chart on Oman - Market size and forecast (2023-2028) ($ million)
      • Data Table on Oman - Market size and forecast (2023-2028) ($ million)
      • Chart on Oman - Year-over-year growth (2023-2028) (%)
      • Data Table on Oman - Year-over-year growth (2023-2028) (%)
    • 11.23 Argentina - Market size and forecast (2023-2028)
      • Chart on Argentina - Market size and forecast (2023-2028) ($ million)
      • Data Table on Argentina - Market size and forecast (2023-2028) ($ million)
      • Chart on Argentina - Year-over-year growth (2023-2028) (%)
      • Data Table on Argentina - Year-over-year growth (2023-2028) (%)
    • 11.24 KSA - Market size and forecast (2023-2028)
      • Chart on KSA - Market size and forecast (2023-2028) ($ million)
      • Data Table on KSA - Market size and forecast (2023-2028) ($ million)
      • Chart on KSA - Year-over-year growth (2023-2028) (%)
      • Data Table on KSA - Year-over-year growth (2023-2028) (%)
    • 11.25 Rest of World (ROW) - Market size and forecast (2023-2028)
      • Chart on Rest of World (ROW) - Market size and forecast (2023-2028) ($ million)
      • Data Table on Rest of World (ROW) - Market size and forecast (2023-2028) ($ million)
      • Chart on Rest of World (ROW) - Year-over-year growth (2023-2028) (%)
      • Data Table on Rest of World (ROW) - Year-over-year growth (2023-2028) (%)

    10 Drivers, Challenges, and Trends

    • 10.1 Market drivers
      • 10.2 Market challenges
        • 10.3 Impact of drivers and challenges
          • Exhibit 113: Impact of drivers and challenges in 2023 and 2028
        • 10.4 Market trends

          11 Vendor Landscape

          • 11.1 Overview
            • 11.2 Vendor landscape
              • Exhibit 114: Overview on Criticality of inputs and Factors of differentiation
            • 11.3 Landscape disruption
              • Exhibit 115: Overview on factors of disruption
            • 11.4 Industry risks
              • Exhibit 116: Impact of key risks on business

            12 Vendor Analysis

            • 12.1 Vendors covered
              • Exhibit 117: Vendors covered
            • 12.2 Market positioning of vendors
              • Exhibit 118: Matrix on vendor position and classification
            • 12.3 Abbott Laboratories
              • Exhibit 119: Abbott Laboratories - Overview
              • Exhibit 120: Abbott Laboratories - Business segments
              • Exhibit 121: Abbott Laboratories - Key news
              • Exhibit 122: Abbott Laboratories - Key offerings
              • Exhibit 123: Abbott Laboratories - Segment focus
            • 12.4 Atkins Nutritionals Inc.
              • Exhibit 124: Atkins Nutritionals Inc. - Overview
              • Exhibit 125: Atkins Nutritionals Inc. - Product / Service
              • Exhibit 126: Atkins Nutritionals Inc. - Key offerings
            • 12.5 Blue Diamond Growers
              • Exhibit 127: Blue Diamond Growers - Overview
              • Exhibit 128: Blue Diamond Growers - Product / Service
              • Exhibit 129: Blue Diamond Growers - Key offerings
            • 12.6 Conagra Brands Inc.
              • Exhibit 130: Conagra Brands Inc. - Overview
              • Exhibit 131: Conagra Brands Inc. - Business segments
              • Exhibit 132: Conagra Brands Inc. - Key news
              • Exhibit 133: Conagra Brands Inc. - Key offerings
              • Exhibit 134: Conagra Brands Inc. - Segment focus
            • 12.7 Glanbia plc
              • Exhibit 135: Glanbia plc - Overview
              • Exhibit 136: Glanbia plc - Business segments
              • Exhibit 137: Glanbia plc - Key offerings
              • Exhibit 138: Glanbia plc - Segment focus
            • 12.8 Healthy N Fit International Inc.
              • Exhibit 139: Healthy N Fit International Inc. - Overview
              • Exhibit 140: Healthy N Fit International Inc. - Product / Service
              • Exhibit 141: Healthy N Fit International Inc. - Key offerings
            • 12.9 Herbalife International of America Inc.
              • Exhibit 142: Herbalife International of America Inc. - Overview
              • Exhibit 143: Herbalife International of America Inc. - Product / Service
              • Exhibit 144: Herbalife International of America Inc. - Key offerings
            • 12.10 ITOCHU Corp.
              • Exhibit 145: ITOCHU Corp. - Overview
              • Exhibit 146: ITOCHU Corp. - Business segments
              • Exhibit 147: ITOCHU Corp. - Key offerings
              • Exhibit 148: ITOCHU Corp. - Segment focus
            • 12.11 Kellogg Co.
              • Exhibit 149: Kellogg Co. - Overview
              • Exhibit 150: Kellogg Co. - Business segments
              • Exhibit 151: Kellogg Co. - Key news
              • Exhibit 152: Kellogg Co. - Key offerings
              • Exhibit 153: Kellogg Co. - Segment focus
            • 12.12 Natures Bounty
              • Exhibit 154: Natures Bounty - Overview
              • Exhibit 155: Natures Bounty - Product / Service
              • Exhibit 156: Natures Bounty - Key offerings
            • 12.13 Nestle SA
              • Exhibit 157: Nestle SA - Overview
              • Exhibit 158: Nestle SA - Business segments
              • Exhibit 159: Nestle SA - Key news
              • Exhibit 160: Nestle SA - Key offerings
              • Exhibit 161: Nestle SA - Segment focus
            • 12.14 Nutiva Inc.
              • Exhibit 162: Nutiva Inc. - Overview
              • Exhibit 163: Nutiva Inc. - Product / Service
              • Exhibit 164: Nutiva Inc. - Key offerings
            • 12.15 NutroActive Industries Pvt. Ltd.
              • Exhibit 165: NutroActive Industries Pvt. Ltd. - Overview
              • Exhibit 166: NutroActive Industries Pvt. Ltd. - Product / Service
              • Exhibit 167: NutroActive Industries Pvt. Ltd. - Key offerings
            • 12.16 The Kraft Heinz Co.
              • Exhibit 168: The Kraft Heinz Co. - Overview
              • Exhibit 169: The Kraft Heinz Co. - Business segments
              • Exhibit 170: The Kraft Heinz Co. - Key offerings
              • Exhibit 171: The Kraft Heinz Co. - Segment focus
            • 12.17 Unilever PLC
              • Exhibit 172: Unilever PLC - Overview
              • Exhibit 173: Unilever PLC - Business segments
              • Exhibit 174: Unilever PLC - Key news
              • Exhibit 175: Unilever PLC - Key offerings
              • Exhibit 176: Unilever PLC - Segment focus

            13 Appendix

            • 13.1 Scope of the report
              • 13.2 Inclusions and exclusions checklist
                • Exhibit 177: Inclusions checklist
                • Exhibit 178: Exclusions checklist
              • 13.3 Currency conversion rates for US$
                • Exhibit 179: Currency conversion rates for US$
              • 13.4 Research methodology
                • Exhibit 180: Research methodology
                • Exhibit 181: Validation techniques employed for market sizing
                • Exhibit 182: Information sources
              • 13.5 List of abbreviations
                • Exhibit 183: List of abbreviations

              Research Methodology

              Technavio presents a detailed picture of the market by way of study, synthesis, and summation of data from multiple sources. The analysts have presented the various facets of the market with a particular focus on identifying the key industry influencers. The data thus presented is comprehensive, reliable, and the result of extensive research, both primary and secondary.

              INFORMATION SOURCES

              Primary sources

              • Manufacturers and suppliers
              • Channel partners
              • Industry experts
              • Strategic decision makers

              Secondary sources

              • Industry journals and periodicals
              • Government data
              • Financial reports of key industry players
              • Historical data
              • Press releases

              DATA ANALYSIS

              Data Synthesis

              • Collation of data
              • Estimation of key figures
              • Analysis of derived insights

              Data Validation

              • Triangulation with data models
              • Reference against proprietary databases
              • Corroboration with industry experts

              REPORT WRITING

              Qualitative

              • Market drivers
              • Market challenges
              • Market trends
              • Five forces analysis

              Quantitative

              • Market size and forecast
              • Market segmentation
              • Geographical insights
              • Competitive landscape

              Interested in this report?

              Get your sample now to see our research methodology and insights!

              Download Now

              Frequently Asked Questions

              Meal Replacement market growth will increase by $ 5794.79 mn during 2024-2028.

              The Meal Replacement market is expected to grow at a CAGR of 6.94% during 2024-2028.

              Meal Replacement market is segmented by Product( Powdered products, Edible bars, Ready-to-drink, Others) Distribution Channel( Offline, Online, APAC, South America, MEA)

              Abbott Laboratories, Atkins Nutritionals Inc., Blue Diamond Growers, Bobs Red Mill Natural Foods Inc., Cambridge Commodities Ltd., Conagra Brands Inc., Glanbia plc, Healthy N Fit International Inc., Herbalife International of America Inc., ITOCHU Corp., Kellogg Co., Natures Bounty, Nestle SA, Nutiva Inc., Nutricore Biosciences Pvt. Ltd., NutroActive Industries Pvt. Ltd., RITS Lifesciences Pvt Ltd., The Kraft Heinz Co., Unilever PLC, Zoic Pharmaceuticals Pvt. Ltd. are a few of the key vendors in the Meal Replacement market.

              North America will register the highest growth rate of 37% among the other regions. Therefore, the Meal Replacement market in North America is expected to garner significant business opportunities for the vendors during the forecast period.

              US, Canada, Germany, UK, Italy, France, China, India, Japan, Brazil, Egypt, UAE, Oman, Argentina, KSA, UAE, Brazil, Rest of World (ROW)

              • Health benefits associated with meal replacement productsThe modern lifestyle has led to considerable changes in the dietary habits of people across the world. Consumers are becoming more health-conscious and seeking food products with more nutritional content. The hectic lifestyle of consumers is also increasing the demand for meal replacement products. Women across the world are unable to spend time on cooking due to increased professional obligations. Moreover is the driving factor this market.
              • the rise in the number of fitness centers and clubs positively impacts the demand for meal replacement products with high protein content is the driving factor this market.
              • which helps repair muscles. Meal replacement products also help in reducing weight. It is a great source of plant-based proteins is the driving factor this market.
              • vitamins is the driving factor this market.
              • minerals is the driving factor this market.
              • and dietary fiber. Health-conscious consumers are demanding food and beverages that contain the essential nutrients. Thus is the driving factor this market.
              • the demand for meal replacement products is expected to increase is the driving factor this market.
              • which will drive the growth of the global meal replacement market during the forecast period. is the driving factor this market.

              The Meal Replacement market vendors should focus on grabbing business opportunities from the Powdered products segment as it accounted for the largest market share in the base year.
              RIA - Research AI Assistant
              Ask RIA