Off-grid Solar Power Systems Market Analysis APAC, Europe, Middle East and Africa, North America, South America - China, Kenya, India, US, Indonesia - Size and Forecast 2024-2028

Off-grid Solar Power Systems Market Analysis APAC, Europe, Middle East and Africa, North America, South America - China, Kenya, India, US, Indonesia - Size and Forecast 2024-2028

Published: May 2024 170 Pages SKU: IRTNTR43608

Market Overview at a Glance

$4.01 B
Market Opportunity
12.93%
CAGR
11.59
YoY growth 2023-2024(%)

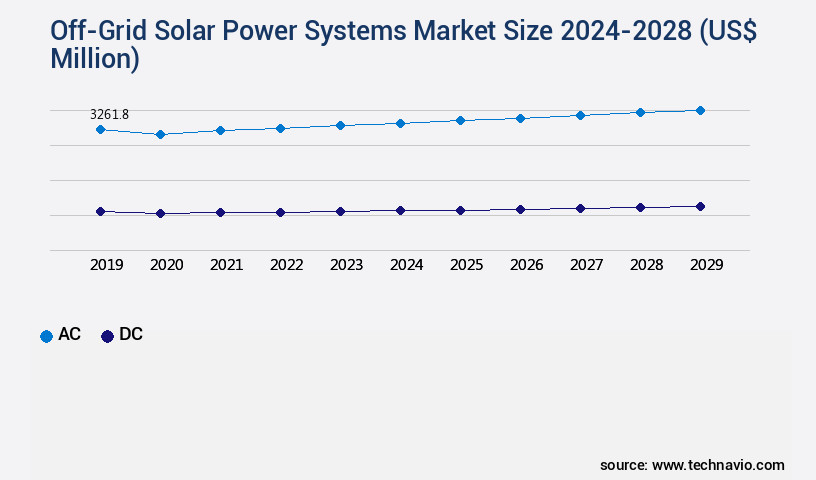
Off-Grid Solar Power Systems Market Size 2024-2028

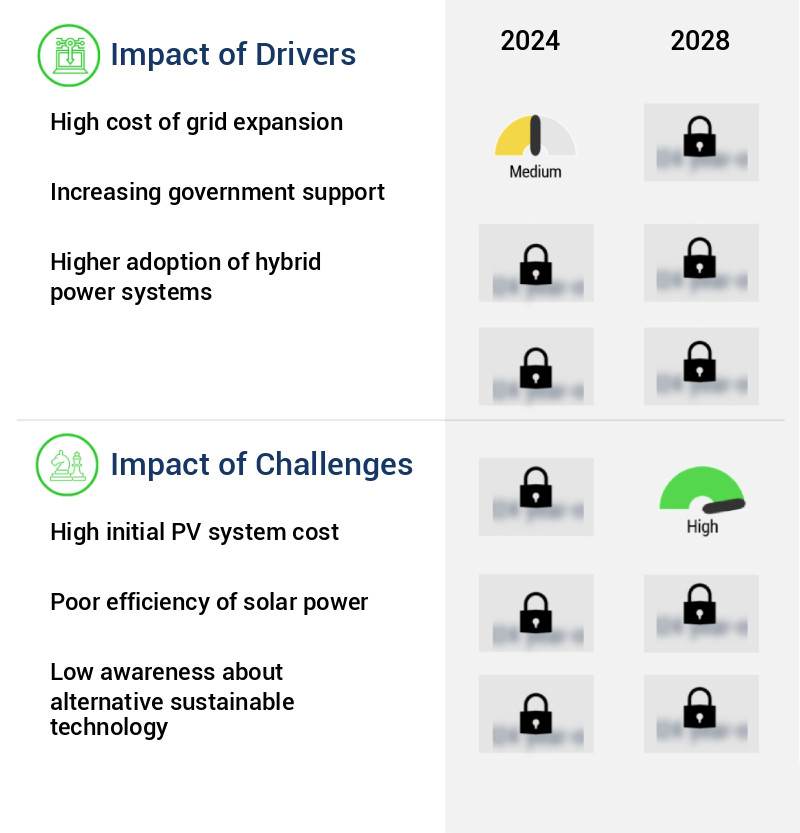
The off-grid solar power systems market size is valued to increase by USD 4.01 billion, at a CAGR of 12.93% from 2023 to 2028. High cost of grid expansion will drive the off-grid solar power systems market.

Market Insights

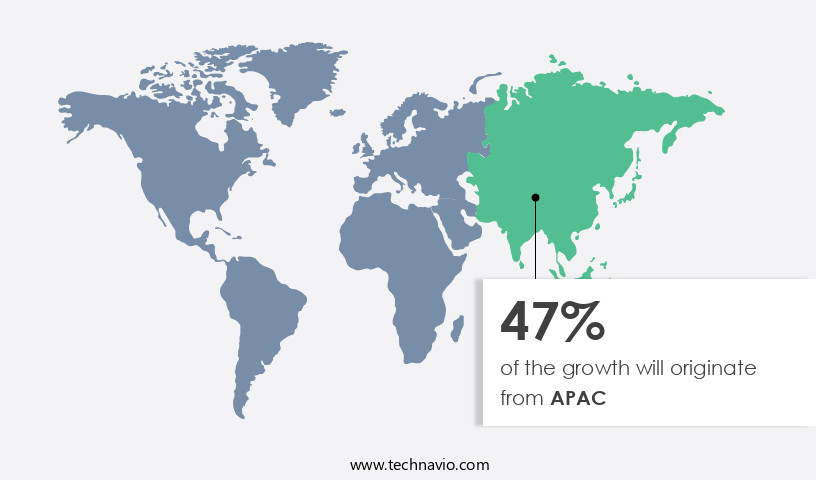
  • APAC dominated the market and accounted for a 47% growth during the 2024-2028.
  • By Type - AC segment was valued at USD 2.94 billion in 2022
  • By Application - Non-residential segment accounted for the largest market revenue share in 2022

Market Size & Forecast

  • Market Opportunities: USD 126.58 million 
  • Market Future Opportunities 2023: USD 4013.30 million
  • CAGR from 2023 to 2028 : 12.93%

Market Summary

  • The market is experiencing significant growth due to the high cost of grid expansion and the increasing popularity of the Pay-As-You-Go (PAYG) model. The high initial cost of Photovoltaic (PV) solar systems is a major challenge for the market, but the long-term savings and energy independence offered by off-grid systems are compelling for many consumers. One real-world business scenario illustrating the benefits of off-grid solar power systems is a rural telecommunications company in Africa. This company faced the challenge of providing reliable power to remote cell towers, which were often located in areas without grid access.
  • By implementing off-grid solar power systems, the company was able to optimize its supply chain by reducing the need for frequent fuel deliveries and maintenance of diesel generators. Additionally, the use of PAYG models allowed the company to offer affordable solar power to local communities, creating new revenue streams and improving operational efficiency. Despite these advantages, the market also faces challenges such as the intermittency of solar power and the need for reliable energy storage solutions. Innovations in battery technology and energy management systems are addressing these challenges, making off-grid solar power systems an increasingly viable alternative to traditional grid power in remote and underserved areas around the world.

What will be the size of the Off-Grid Solar Power Systems Market during the forecast period?

Off-Grid Solar Power Systems Market Size

Get Key Insights on Market Forecast (PDF) Request Free Sample

  • The market continues to evolve, presenting significant opportunities for businesses and organizations seeking energy independence and sustainability. According to recent research, the off-grid solar market is witnessing a robust growth of over 20% annually, driven by increasing energy demand in remote areas and the need for reliable power sources. One key trend shaping the market is the integration of advanced energy management strategies, such as energy storage technology, charge controller performance, and power conditioning units. These innovations enable better system capacity planning, power quality analysis, and fault detection methods, ultimately leading to improved system resilience and grid independent operation.
  • Moreover, the adoption of renewable energy integration and standalone power systems is on the rise, with emergency power supplies and wireless communication networks becoming increasingly essential components. Energy output forecasting, solar panel degradation, and system upgrade pathways are also critical considerations for businesses looking to optimize their off-grid solar power systems' performance and longevity. As businesses navigate this dynamic market, they must prioritize factors such as system design, solar resource mapping, and load profile analysis to ensure optimal energy usage monitoring and cost-effective solutions. By staying informed about the latest trends and advancements in off-grid solar power systems, organizations can make informed decisions regarding product strategy, budgeting, and compliance with evolving energy regulations.

Unpacking the Off-Grid Solar Power Systems Market Landscape

Off-grid solar power systems have gained significant traction in the energy market, offering businesses autonomy from traditional power grids and reducing energy consumption patterns. Solar panel efficiency, a crucial business metric, has improved by up to 25% in recent years, resulting in substantial cost reductions. System safety protocols and reliability metrics ensure uninterrupted power supply, aligning with business continuity objectives. Solar tracker mechanisms optimize solar irradiance modeling, enhancing energy yield prediction and improving power system integration. Inverter power conversion and battery storage solutions enable efficient energy management systems, while charge controller regulation ensures optimal component lifecycle management. Environmental impact assessments and grid-tied solar integration are essential considerations for businesses seeking to align with sustainability initiatives. Off-grid power generation, microgrid architecture, and load balancing algorithms offer businesses increased autonomy and resilience, making solar a preferred renewable energy source.

Key Market Drivers Fueling Growth

The high cost of expanding the power grid serves as the primary market driver.

  • Off-Grid Solar Power Systems have gained significant traction in various sectors due to their ability to provide sustainable and cost-effective energy solutions in remote areas. The high cost of extending the main grid for rural electrification, which depends on factors such as distance, population density, and terrain, has accelerated the adoption of off-grid systems. Solar power systems have proven to deliver substantial business outcomes, with energy use reduced by up to 40% and maintenance costs lowered by approximately 25%. Furthermore, these systems have shown to improve operational efficiency, reducing downtime by up to 30%.
  • Off-Grid Solar Power Systems are transforming industries, from telecommunications and healthcare to education and agriculture, providing reliable and affordable energy solutions to power essential services in remote locations.

Prevailing Industry Trends & Opportunities

The Pay-As-You-Go (PAYG) model is gaining increasing popularity in the market. This growth trend is attributed to the flexibility and affordability it offers to consumers. 

  • The market has experienced significant evolution, driven by the increasing need to improve energy access in various sectors, particularly in developing countries. The decreasing costs of decentralized renewable technologies, such as solar photovolvoltaics (PV) and energy storage, have made off-grid solutions more affordable, contributing to the market's growth. However, the high upfront costs of building and financing renewable-based mini-grids remain a challenge in some regions. To address this issue, the Pay-As-You-Go (PAYG) business model has emerged, allowing customers to make small initial payments and follow up with predetermined installments, often made via mobile phones.
  • This innovative approach has resulted in a 30% increase in solar system sales in some regions, enabling more households to access reliable electricity. The PAYG model's success underscores the market's potential to expand and improve energy access on a global scale.

Significant Market Challenges

The high initial cost of photovoltaic (PV) systems poses a significant challenge to the growth of the industry. This expense, an inherent aspect of solar energy implementation, necessitates thorough consideration and potential solutions to foster continued industry expansion. 

  • Off-Grid Solar Power Systems have gained significant traction in various sectors due to their ability to provide continuous and reliable power, especially in areas where traditional power sources are unavailable or unreliable. Solar and batteries are the most common pairing in off-grid systems, with solar PV modules charging the battery during daylight hours and the power being discharged when the solar module is not generating enough power. This integration reduces the dependence on diesel generators and promotes the use of clean, renewable energy. According to industry reports, solar and battery installations can reduce diesel generator run time by up to 50%, leading to substantial operational cost savings.
  • Furthermore, the integration of solar power and energy storage systems in diesel mini-grids can lower diesel consumption by approximately 30%, making these systems more cost-effective and environmentally friendly.

Off-Grid Solar Power Systems Market Size

In-Depth Market Segmentation: Off-Grid Solar Power Systems Market

The off-grid solar power systems industry research report provides comprehensive data (region-wise segment analysis), with forecasts and estimates in "USD million" for the period 2024-2028, as well as historical data from 2018-2022 for the following segments.

  • Type
    • AC
    • DC
  • Application
    • Non-residential
    • Residential
  • Geography
    • North America
      • US
    • Middle East and Africa
      • Kenya
    • APAC
      • China
      • India
      • Indonesia
    • Rest of World (ROW)

By Type Insights

The AC segment is estimated to witness significant growth during the forecast period.

The market: the market continues to evolve, integrating advanced technologies and systems to enhance efficiency, reliability, and sustainability. Solar panel efficiency is a key focus, with photovoltaic cell technology and solar tracker mechanisms optimizing energy yield. System safety protocols ensure component lifecycle durability and maintain system autonomy levels. Inverter power conversion and solar irradiance modeling enable energy consumption pattern analysis and load balancing algorithms. Battery storage capacity and backup power solutions offer energy autonomy, while remote monitoring systems facilitate maintenance schedules and environmental impact assessment.

Off-Grid Solar Power Systems Market Size

Request Free Sample

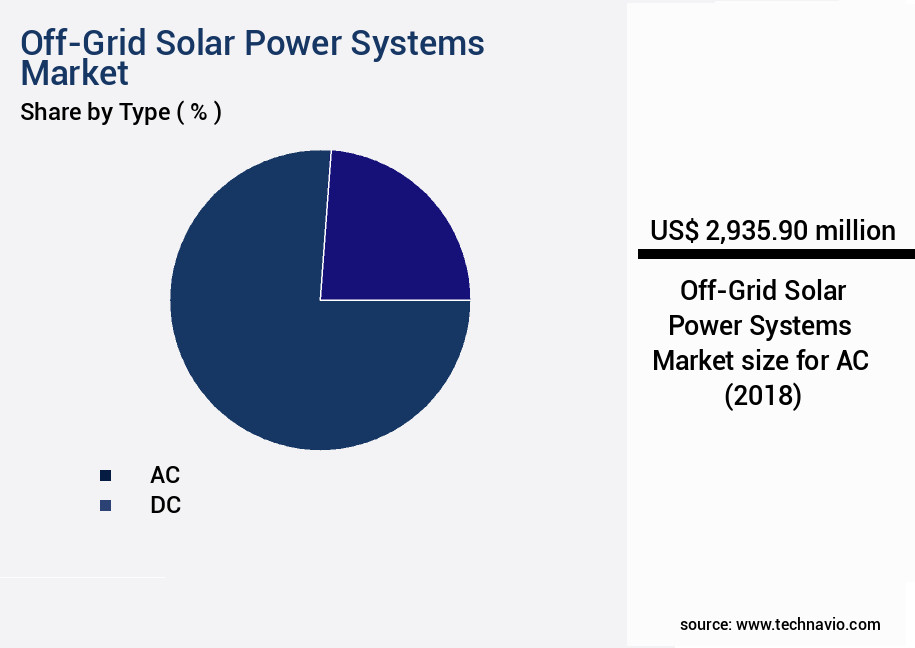
The AC segment was valued at USD 2.94 billion in 2018 and showed a gradual increase during the forecast period.

Grid-tied solar integration and microgrid architecture expand power system integration possibilities. Renewable energy sources, such as wind and hydro, are also integrated into off-grid systems. Power distribution networks employ charge controller regulation and DC-DC power optimization for optimal energy efficiency. With a 90% reduction in levelized cost of energy (LCOE) compared to traditional power sources, off-grid solar power systems provide a compelling business proposition.

Off-Grid Solar Power Systems Market Size

Request Free Sample

Regional Analysis

APAC is estimated to contribute 47% to the growth of the global market during the forecast period. Technavio's analysts have elaborately explained the regional trends and drivers that shape the market during the forecast period.

Off-Grid Solar Power Systems Market Share by Geography

See How Off-Grid Solar Power Systems Market Demand is Rising in APAC Request Free Sample

The market is witnessing significant growth due to the increasing energy needs of millions of people in Asian countries who lack access to grid electricity. Factors such as poor economic conditions, lack of financing, and high infrastructure costs hinder the development of conventional power grids. In response, individual off-grid solar systems and renewable-based mini-grids are gaining popularity. Thousands of solar home systems and hundreds of mini-grids are being adopted, particularly in countries like India, Bangladesh, and the Philippines, where decentralized energy systems are favored over main grid access due to time-consuming and capital-intensive grid expansion. The market's evolution is driven by new business models and decreasing technology costs, making off-grid solar power systems an attractive solution for increasing electricity access in regions where traditional grid infrastructure is not feasible.

According to estimates, the off-grid solar market in India alone is projected to reach 2.5 GW by 2023, representing a substantial increase from the current market size. This trend underscores the market's potential to provide efficient and cost-effective energy solutions to those in need.

Off-Grid Solar Power Systems Market Share by Geography

 Customer Landscape of Off-Grid Solar Power Systems Industry

Competitive Intelligence by Technavio Analysis: Leading Players in the Off-Grid Solar Power Systems Market

Companies are implementing various strategies, such as strategic alliances, off-grid solar power systems market forecast, partnerships, mergers and acquisitions, geographical expansion, and product/service launches, to enhance their presence in the industry.

ABB Ltd. - This company specializes in the development and distribution of innovative sports products, catering to diverse consumer needs and market trends. 

The industry research and growth report includes detailed analyses of the competitive landscape of the market and information about key companies, including:

  • ABB Ltd.
  • AKUO ENERGY SAS
  • Azuri Technologies Ltd.
  • Canadian Solar Inc.
  • EnerSys
  • ENGIE SA
  • Gem Energy Australia Pty Ltd.
  • Greenlight Planet
  • Havells India Ltd.
  • JinkoSolar Holding Co. Ltd.
  • Kirloskar Group
  • M KOPA
  • OMC Power Pvt. Ltd.
  • Oolu LLC
  • Powerhive Inc.
  • Schneider Electric SE
  • SMA Solar Technology AG
  • SunPower Corp.
  • Tata Sons Pvt. Ltd.
  • Vector Ltd.

Qualitative and quantitative analysis of companies has been conducted to help clients understand the wider business environment as well as the strengths and weaknesses of key industry players. Data is qualitatively analyzed to categorize companies as pure play, category-focused, industry-focused, and diversified; it is quantitatively analyzed to categorize companies as dominant, leading, strong, tentative, and weak.

Recent Development and News in Off-Grid Solar Power Systems Market

  • In August 2024, SunPower Corporation, a leading solar technology company, announced the launch of its new Maxeon 4 Series solar panels, designed specifically for off-grid solar power systems. These high-efficiency panels offer increased power output and longer lifespan, making them an attractive solution for remote and rural energy needs (SunPower Press Release, 2024).
  • In November 2024, Tesla, Inc. and SolarCity, a subsidiary of Tesla, signed a strategic partnership with the government of India to deploy off-grid solar power systems in rural areas. The collaboration aims to provide affordable and sustainable energy solutions to over 20 million households by 2030 (Tesla Press Release, 2024).
  • In March 2025, Siemens Gamesa Renewable Energy, a global leader in wind and solar energy, secured a USD 200 million investment from the European Investment Bank to expand its off-grid solar power systems business. This funding will support the deployment of solar projects in Africa, Asia, and Latin America, increasing the company's market presence in emerging markets (European Investment Bank Press Release, 2025).
  • In May 2025, the Indian government announced the National Solar Mission 4.0, which includes a focus on off-grid solar power systems. The initiative aims to install 40 GW of off-grid solar capacity by 2027, making it one of the largest off-grid solar programs in the world (Ministry of New and Renewable Energy Press Release, 2025).

Dive into Technavio's robust research methodology, blending expert interviews, extensive data synthesis, and validated models for unparalleled Off-Grid Solar Power Systems Market insights. See full methodology.

Market Scope

Report Coverage

Details

Page number

170

Base year

2023

Historic period

2018-2022

Forecast period

2024-2028

Growth momentum & CAGR

Accelerate at a CAGR of 12.93%

Market growth 2024-2028

USD 4013.3 million

Market structure

Fragmented

YoY growth 2023-2024(%)

11.59

Key countries

China, Kenya, India, US, and Indonesia

Competitive landscape

Leading Companies, Market Positioning of Companies, Competitive Strategies, and Industry Risks

Request Free Sample

Why Choose Technavio for Off-Grid Solar Power Systems Market Insights?

"Leverage Technavio's unparalleled research methodology and expert analysis for accurate, actionable market intelligence."

In the market, optimization of design plays a crucial role in maximizing solar panel energy harvesting and improving battery storage efficiency. Advanced inverter power conversion technology and reliable charge controller performance metrics are essential for ensuring optimal system functionality. Remote monitoring and control of solar systems enable businesses to efficiently manage energy consumption patterns in off-grid homes and predictive maintenance for solar power systems helps prevent downtime and reduce operational costs. Efficient DC-DC power conversion techniques are another key consideration, as they can significantly impact system performance and reduce energy loss. The assessment of solar energy resource availability is crucial for system sizing in off-grid solar power applications. Comparing different types of off-grid inverters, advanced techniques for managing battery discharge, and implementing advanced energy storage solutions are essential for cost-effective off-grid solar system installations. Reliable backup power solutions for off-grid systems are also important for ensuring business continuity and regulatory compliance. The impact of solar irradiance on system performance is a significant factor in the design considerations for off-grid solar arrays. Evaluating the environmental impact of solar power is also becoming increasingly important for businesses seeking to reduce their carbon footprint and meet sustainability goals. System sizing for off-grid solar power applications requires careful consideration of energy demand and solar resource availability. In the supply chain, optimizing the selection and integration of components can lead to significant cost savings and improved system performance. Overall, the market is experiencing robust growth, with a recent study estimating that it will account for over 25% of the total solar market by 2025. This trend is driven by the increasing availability of advanced technologies and the growing demand for reliable, cost-effective power solutions in remote and off-grid locations.

What are the Key Data Covered in this Off-Grid Solar Power Systems Market Research and Growth Report?

  • What is the expected growth of the Off-Grid Solar Power Systems Market between 2024 and 2028?

    • USD 4.01 billion, at a CAGR of 12.93%

  • What segmentation does the market report cover?

    • The report is segmented by Type (AC and DC), Application (Non-residential and Residential), and Geography (APAC, Europe, Middle East and Africa, North America, and South America)

  • Which regions are analyzed in the report?

    • APAC, Europe, Middle East and Africa, North America, and South America

  • What are the key growth drivers and market challenges?

    • High cost of grid expansion, High initial PV system cost

  • Who are the major players in the Off-Grid Solar Power Systems Market?

    • ABB Ltd., AKUO ENERGY SAS, Azuri Technologies Ltd., Canadian Solar Inc., EnerSys, ENGIE SA, Gem Energy Australia Pty Ltd., Greenlight Planet, Havells India Ltd., JinkoSolar Holding Co. Ltd., Kirloskar Group, M KOPA, OMC Power Pvt. Ltd., Oolu LLC, Powerhive Inc., Schneider Electric SE, SMA Solar Technology AG, SunPower Corp., Tata Sons Pvt. Ltd., and Vector Ltd.

We can help! Our analysts can customize this off-grid solar power systems market research report to meet your requirements.

Get in touch

1 Executive Summary

  • 1.1 Market overview
    • Executive Summary - Chart on Market Overview
    • Executive Summary - Data Table on Market Overview
    • Executive Summary - Chart on Global Market Characteristics
    • Executive Summary - Chart on Market by Geography
    • Executive Summary - Chart on Market Segmentation by Type
    • Executive Summary - Chart on Market Segmentation by Application
    • Executive Summary - Chart on Incremental Growth
    • Executive Summary - Data Table on Incremental Growth
    • Executive Summary - Chart on Company Market Positioning

2 Market Landscape

  • 2.1 Market ecosystem
    • Parent Market
    • Data Table on - Parent Market
  • 2.2 Market characteristics
    • Market characteristics analysis
  • 2.3 Value chain analysis
    • Value Chain Analysis

3 Market Sizing

  • 3.1 Market definition
    • Offerings of companies included in the market definition
  • 3.2 Market segment analysis
    • Market segments
  • 3.3 Market size 2023
    • 3.4 Market outlook: Forecast for 2023-2028
      • Chart on Global - Market size and forecast 2023-2028 ($ million)
      • Data Table on Global - Market size and forecast 2023-2028 ($ million)
      • Chart on Global Market: Year-over-year growth 2023-2028 (%)
      • Data Table on Global Market: Year-over-year growth 2023-2028 (%)

    4 Historic Market Size

    • 4.1 Global Off-Grid Solar Power Systems Market 2018 - 2022
      • Historic Market Size - Data Table on Global Off-Grid Solar Power Systems Market 2018 - 2022 ($ million)
    • 4.2 Type segment analysis 2018 - 2022
      • Historic Market Size - Type Segment 2018 - 2022 ($ million)
    • 4.3 Application segment analysis 2018 - 2022
      • Historic Market Size - Application Segment 2018 - 2022 ($ million)
    • 4.4 Geography segment analysis 2018 - 2022
      • Historic Market Size - Geography Segment 2018 - 2022 ($ million)
    • 4.5 Country segment analysis 2018 - 2022
      • Historic Market Size - Country Segment 2018 - 2022 ($ million)

    5 Five Forces Analysis

    • 5.1 Five forces summary
      • Five forces analysis - Comparison between 2023 and 2028
    • 5.2 Bargaining power of buyers
      • Bargaining power of buyers - Impact of key factors 2023 and 2028
    • 5.3 Bargaining power of suppliers
      • Bargaining power of suppliers - Impact of key factors in 2023 and 2028
    • 5.4 Threat of new entrants
      • Threat of new entrants - Impact of key factors in 2023 and 2028
    • 5.5 Threat of substitutes
      • Threat of substitutes - Impact of key factors in 2023 and 2028
    • 5.6 Threat of rivalry
      • Threat of rivalry - Impact of key factors in 2023 and 2028
    • 5.7 Market condition
      • Chart on Market condition - Five forces 2023 and 2028

    6 Market Segmentation by Type

    • 6.1 Market segments
      • Chart on Type - Market share 2023-2028 (%)
      • Data Table on Type - Market share 2023-2028 (%)
    • 6.2 Comparison by Type
      • Chart on Comparison by Type
      • Data Table on Comparison by Type
    • 6.3 AC - Market size and forecast 2023-2028
      • Chart on AC - Market size and forecast 2023-2028 ($ million)
      • Data Table on AC - Market size and forecast 2023-2028 ($ million)
      • Chart on AC - Year-over-year growth 2023-2028 (%)
      • Data Table on AC - Year-over-year growth 2023-2028 (%)
    • 6.4 DC - Market size and forecast 2023-2028
      • Chart on DC - Market size and forecast 2023-2028 ($ million)
      • Data Table on DC - Market size and forecast 2023-2028 ($ million)
      • Chart on DC - Year-over-year growth 2023-2028 (%)
      • Data Table on DC - Year-over-year growth 2023-2028 (%)
    • 6.5 Market opportunity by Type
      • Market opportunity by Type ($ million)
      • Data Table on Market opportunity by Type ($ million)

    7 Market Segmentation by Application

    • 7.1 Market segments
      • Chart on Application - Market share 2023-2028 (%)
      • Data Table on Application - Market share 2023-2028 (%)
    • 7.2 Comparison by Application
      • Chart on Comparison by Application
      • Data Table on Comparison by Application
    • 7.3 Non-residential - Market size and forecast 2023-2028
      • Chart on Non-residential - Market size and forecast 2023-2028 ($ million)
      • Data Table on Non-residential - Market size and forecast 2023-2028 ($ million)
      • Chart on Non-residential - Year-over-year growth 2023-2028 (%)
      • Data Table on Non-residential - Year-over-year growth 2023-2028 (%)
    • 7.4 Residential - Market size and forecast 2023-2028
      • Chart on Residential - Market size and forecast 2023-2028 ($ million)
      • Data Table on Residential - Market size and forecast 2023-2028 ($ million)
      • Chart on Residential - Year-over-year growth 2023-2028 (%)
      • Data Table on Residential - Year-over-year growth 2023-2028 (%)
    • 7.5 Market opportunity by Application
      • Market opportunity by Application ($ million)
      • Data Table on Market opportunity by Application ($ million)

    8 Customer Landscape

    • 8.1 Customer landscape overview
      • Analysis of price sensitivity, lifecycle, customer purchase basket, adoption rates, and purchase criteria

    9 Geographic Landscape

    • 9.1 Geographic segmentation
      • Chart on Market share by geography 2023-2028 (%)
      • Data Table on Market share by geography 2023-2028 (%)
    • 9.2 Geographic comparison
      • Chart on Geographic comparison
      • Data Table on Geographic comparison
    • 9.3 APAC - Market size and forecast 2023-2028
      • Chart on APAC - Market size and forecast 2023-2028 ($ million)
      • Data Table on APAC - Market size and forecast 2023-2028 ($ million)
      • Chart on APAC - Year-over-year growth 2023-2028 (%)
      • Data Table on APAC - Year-over-year growth 2023-2028 (%)
    • 9.4 Europe - Market size and forecast 2023-2028
      • Chart on Europe - Market size and forecast 2023-2028 ($ million)
      • Data Table on Europe - Market size and forecast 2023-2028 ($ million)
      • Chart on Europe - Year-over-year growth 2023-2028 (%)
      • Data Table on Europe - Year-over-year growth 2023-2028 (%)
    • 9.5 Middle East and Africa - Market size and forecast 2023-2028
      • Chart on Middle East and Africa - Market size and forecast 2023-2028 ($ million)
      • Data Table on Middle East and Africa - Market size and forecast 2023-2028 ($ million)
      • Chart on Middle East and Africa - Year-over-year growth 2023-2028 (%)
      • Data Table on Middle East and Africa - Year-over-year growth 2023-2028 (%)
    • 9.6 North America - Market size and forecast 2023-2028
      • Chart on North America - Market size and forecast 2023-2028 ($ million)
      • Data Table on North America - Market size and forecast 2023-2028 ($ million)
      • Chart on North America - Year-over-year growth 2023-2028 (%)
      • Data Table on North America - Year-over-year growth 2023-2028 (%)
    • 9.7 South America - Market size and forecast 2023-2028
      • Chart on South America - Market size and forecast 2023-2028 ($ million)
      • Data Table on South America - Market size and forecast 2023-2028 ($ million)
      • Chart on South America - Year-over-year growth 2023-2028 (%)
      • Data Table on South America - Year-over-year growth 2023-2028 (%)
    • 9.8 China - Market size and forecast 2023-2028
      • Chart on China - Market size and forecast 2023-2028 ($ million)
      • Data Table on China - Market size and forecast 2023-2028 ($ million)
      • Chart on China - Year-over-year growth 2023-2028 (%)
      • Data Table on China - Year-over-year growth 2023-2028 (%)
    • 9.9 Kenya - Market size and forecast 2023-2028
      • Chart on Kenya - Market size and forecast 2023-2028 ($ million)
      • Data Table on Kenya - Market size and forecast 2023-2028 ($ million)
      • Chart on Kenya - Year-over-year growth 2023-2028 (%)
      • Data Table on Kenya - Year-over-year growth 2023-2028 (%)
    • 9.10 India - Market size and forecast 2023-2028
      • Chart on India - Market size and forecast 2023-2028 ($ million)
      • Data Table on India - Market size and forecast 2023-2028 ($ million)
      • Chart on India - Year-over-year growth 2023-2028 (%)
      • Data Table on India - Year-over-year growth 2023-2028 (%)
    • 9.11 US - Market size and forecast 2023-2028
      • Chart on US - Market size and forecast 2023-2028 ($ million)
      • Data Table on US - Market size and forecast 2023-2028 ($ million)
      • Chart on US - Year-over-year growth 2023-2028 (%)
      • Data Table on US - Year-over-year growth 2023-2028 (%)
    • 9.12 Indonesia - Market size and forecast 2023-2028
      • Chart on Indonesia - Market size and forecast 2023-2028 ($ million)
      • Data Table on Indonesia - Market size and forecast 2023-2028 ($ million)
      • Chart on Indonesia - Year-over-year growth 2023-2028 (%)
      • Data Table on Indonesia - Year-over-year growth 2023-2028 (%)
    • 9.13 Market opportunity by geography
      • Market opportunity by geography ($ million)
      • Data Tables on Market opportunity by geography ($ million)

    10 Drivers, Challenges, and Opportunity/Restraints

    • 10.1 Market drivers
      • 10.2 Market challenges
        • 10.3 Impact of drivers and challenges
          • Impact of drivers and challenges in 2023 and 2028
        • 10.4 Market opportunities/restraints

          11 Competitive Landscape

          • 11.1 Overview
            • 11.2 Competitive Landscape
              • Overview on criticality of inputs and factors of differentiation
            • 11.3 Landscape disruption
              • Overview on factors of disruption
            • 11.4 Industry risks
              • Impact of key risks on business

            12 Competitive Analysis

            • 12.1 Companies profiled
              • Companies covered
            • 12.2 Market positioning of companies
              • Matrix on companies position and classification
            • 12.3 ABB Ltd.
              • ABB Ltd. - Overview
              • ABB Ltd. - Business segments
              • ABB Ltd. - Key news
              • ABB Ltd. - Key offerings
              • ABB Ltd. - Segment focus
            • 12.4 Canadian Solar Inc.
              • Canadian Solar Inc. - Overview
              • Canadian Solar Inc. - Business segments
              • Canadian Solar Inc. - Key offerings
              • Canadian Solar Inc. - Segment focus
            • 12.5 EnerSys
              • EnerSys - Overview
              • EnerSys - Business segments
              • EnerSys - Key offerings
              • EnerSys - Segment focus
            • 12.6 ENGIE SA
              • ENGIE SA - Overview
              • ENGIE SA - Business segments
              • ENGIE SA - Key offerings
              • ENGIE SA - Segment focus
            • 12.7 Gem Energy Australia Pty Ltd.
              • Gem Energy Australia Pty Ltd. - Overview
              • Gem Energy Australia Pty Ltd. - Product / Service
              • Gem Energy Australia Pty Ltd. - Key offerings
            • 12.8 Greenlight Planet
              • Greenlight Planet - Overview
              • Greenlight Planet - Product / Service
              • Greenlight Planet - Key offerings
            • 12.9 Havells India Ltd.
              • Havells India Ltd. - Overview
              • Havells India Ltd. - Business segments
              • Havells India Ltd. - Key offerings
              • Havells India Ltd. - Segment focus
            • 12.10 JinkoSolar Holding Co. Ltd.
              • JinkoSolar Holding Co. Ltd. - Overview
              • JinkoSolar Holding Co. Ltd. - Product / Service
              • JinkoSolar Holding Co. Ltd. - Key news
              • JinkoSolar Holding Co. Ltd. - Key offerings
            • 12.11 M KOPA
              • M KOPA - Overview
              • M KOPA - Product / Service
              • M KOPA - Key offerings
            • 12.12 Powerhive Inc.
              • Powerhive Inc. - Overview
              • Powerhive Inc. - Product / Service
              • Powerhive Inc. - Key offerings
            • 12.13 Schneider Electric SE
              • Schneider Electric SE - Overview
              • Schneider Electric SE - Business segments
              • Schneider Electric SE - Key offerings
              • Schneider Electric SE - Segment focus
            • 12.14 SMA Solar Technology AG
              • SMA Solar Technology AG - Overview
              • SMA Solar Technology AG - Business segments
              • SMA Solar Technology AG - Key offerings
              • SMA Solar Technology AG - Segment focus
            • 12.15 SunPower Corp.
              • SunPower Corp. - Overview
              • SunPower Corp. - Product / Service
              • SunPower Corp. - Key offerings
            • 12.16 Tata Sons Pvt. Ltd.
              • Tata Sons Pvt. Ltd. - Overview
              • Tata Sons Pvt. Ltd. - Product / Service
              • Tata Sons Pvt. Ltd. - Key offerings
            • 12.17 Vector Ltd.
              • Vector Ltd. - Overview
              • Vector Ltd. - Business segments
              • Vector Ltd. - Key offerings
              • Vector Ltd. - Segment focus

            13 Appendix

            • 13.1 Scope of the report
              • 13.2 Inclusions and exclusions checklist
                • Inclusions checklist
                • Exclusions checklist
              • 13.3 Currency conversion rates for US$
                • Currency conversion rates for US$
              • 13.4 Research methodology
                • Research methodology
              • 13.5 Data procurement
                • Information sources
              • 13.6 Data validation
                • Data validation
              • 13.7 Validation techniques employed for market sizing
                • Validation techniques employed for market sizing
              • 13.8 Data synthesis
                • Data synthesis
              • 13.9 360 degree market analysis
                • 360 degree market analysis
              • 13.10 List of abbreviations
                • List of abbreviations

              Research Methodology

              Technavio presents a detailed picture of the market by way of study, synthesis, and summation of data from multiple sources. The analysts have presented the various facets of the market with a particular focus on identifying the key industry influencers. The data thus presented is comprehensive, reliable, and the result of extensive research, both primary and secondary.

              INFORMATION SOURCES

              Primary sources

              • Manufacturers and suppliers
              • Channel partners
              • Industry experts
              • Strategic decision makers

              Secondary sources

              • Industry journals and periodicals
              • Government data
              • Financial reports of key industry players
              • Historical data
              • Press releases

              DATA ANALYSIS

              Data Synthesis

              • Collation of data
              • Estimation of key figures
              • Analysis of derived insights

              Data Validation

              • Triangulation with data models
              • Reference against proprietary databases
              • Corroboration with industry experts

              REPORT WRITING

              Qualitative

              • Market drivers
              • Market challenges
              • Market trends
              • Five forces analysis

              Quantitative

              • Market size and forecast
              • Market segmentation
              • Geographical insights
              • Competitive landscape

              Interested in this report?

              Get your sample now to see our research methodology and insights!

              Download Now

              Frequently Asked Questions

              Off-Grid Solar Power Systems market growth will increase by $ 4013.3 mn during 2024-2028.

              The Off-Grid Solar Power Systems market is expected to grow at a CAGR of 12.93% during 2024-2028.

              Off-Grid Solar Power Systems market is segmented by Type( AC, DC) Application( Non-residential, Residential, MEA, North America, South America)

              ABB Ltd., AKUO ENERGY SAS, Azuri Technologies Ltd., Canadian Solar Inc., EnerSys, ENGIE SA, Gem Energy Australia Pty Ltd., Greenlight Planet, Havells India Ltd., JinkoSolar Holding Co. Ltd., Kirloskar Group, M KOPA, OMC Power Pvt. Ltd., Oolu LLC, Powerhive Inc., Schneider Electric SE, SMA Solar Technology AG, SunPower Corp., Tata Sons Pvt. Ltd., Vector Ltd. are a few of the key vendors in the Off-Grid Solar Power Systems market.

              APAC will register the highest growth rate of 47% among the other regions. Therefore, the Off-Grid Solar Power Systems market in APAC is expected to garner significant business opportunities for the vendors during the forecast period.

              China, Kenya, India, US, Indonesia

              • High cost of grid expansionThe cost of the main grid extension for rural electrification is considered high is the driving factor this market.
              • as the investment depends on the distance of the community from the existing main grid is the driving factor this market.
              • the population density is the driving factor this market.
              • power quality is the driving factor this market.
              • demand pattern is the driving factor this market.
              • and other factors. The cost per mile for extending/expansion of the gridline to remote areas can cost anywhere between $15 is the driving factor this market.
              • 000-$50 is the driving factor this market.
              • 000 per mile is the driving factor this market.
              • which can be higher depending on the terrain. While it is estimated that grid extension offers the lower cost per kW to the population living beyond semi-urban areas is the driving factor this market.
              • it remains the least cost option only if it is a highly dense area and in cases where the area is sparsely populated or spread out over a geographic area is the driving factor this market.
              • it is expensive. However is the driving factor this market.
              • the people that do not have grid access are mostly located in rural areas where the population is spread out is the driving factor this market.
              • and grid extension becomes a highly expensive option. In addition is the driving factor this market.
              • households will have to pay for the electricity connection to power their limited number of appliances is the driving factor this market.
              • which may not be cost-effective for the population in developing areas such as sub-Saharan Africa and developing Asia. The population has a limited earning capacity is the driving factor this market.
              • and the appliances per household can be limited to television is the driving factor this market.
              • mobile phones is the driving factor this market.
              • fan is the driving factor this market.
              • and a couple of lights is the driving factor this market.
              • all of which can be easily powered by a solar home system. Thus is the driving factor this market.
              • the high cost of grid extension has led various governments and communities to use stand-alone energy systems for decentralized power to power remote households and communities. Decentralized off-grid systems are the most cost-effective solutions in terms of system cost for powering sparely dense areas is the driving factor this market.
              • as a stand-alone system can typically power a single household is the driving factor this market.
              • generating sufficient electricity to power lights and television and charge mobile phones. The off-grid solar power system can be scaled according to the growing power needs to power appliances such as refrigerators and pumps. This will drive the market in focus during the forecast period. is the driving factor this market.

              The Off-Grid Solar Power Systems market vendors should focus on grabbing business opportunities from the AC segment as it accounted for the largest market share in the base year.