Office And Commercial Coffee Equipment And Supplies Market Analysis, Size, and Forecast 2026-2030: APAC (China, Japan, and India), Europe (Germany, UK, and France), North America (US, Canada, and Mexico), Middle East and Africa (Saudi Arabia, UAE, and South Africa), South America (Brazil, Argentina, and Chile), and Rest of World (ROW)

Office And Commercial Coffee Equipment And Supplies Market Analysis, Size, and Forecast 2026-2030:
APAC (China, Japan, and India), Europe (Germany, UK, and France), North America (US, Canada, and Mexico), Middle East and Africa (Saudi Arabia, UAE, and South Africa), South America (Brazil, Argentina, and Chile), and Rest of World (ROW)

Published: Nov 2026 305 Pages SKU: IRTNTR41201

Market Overview at a Glance

$6.99 B
Market Opportunity
4.1%
CAGR 2025 - 2030
44.7%
APAC Growth
$14.23 B
Offices segment 2024

Office And Commercial Coffee Equipment And Supplies Market Size 2026-2030

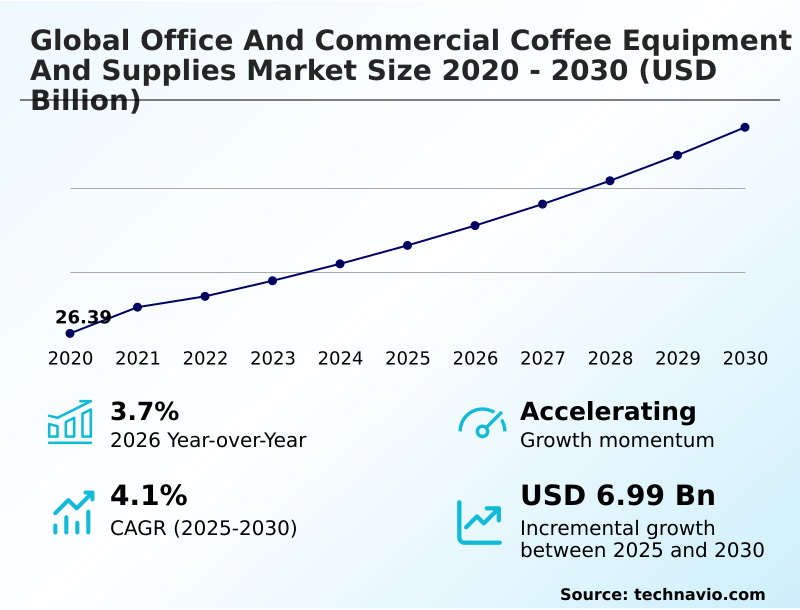
The office and commercial coffee equipment and supplies market size is valued to increase by USD 6.99 billion, at a CAGR of 4.1% from 2025 to 2030. Workplace return fuels commercial demand will drive the office and commercial coffee equipment and supplies market.

Major Market Trends & Insights

  • APAC dominated the market and accounted for a 44.7% growth during the forecast period.
  • By End-user - Offices segment was valued at USD 14.23 billion in 2024
  • By Distribution Channel - Offline segment accounted for the largest market revenue share in 2024

Market Size & Forecast

  • Market Opportunities: USD 12.18 billion
  • Market Future Opportunities: USD 6.99 billion
  • CAGR from 2025 to 2030 : 4.1%

Market Summary

  • The Office And Commercial Coffee Equipment And Supplies Market demonstrates robust expansion as corporate enterprises and commercial hospitality sectors actively modernize their beverage infrastructure. A fundamental driver accelerating this transition is the strategic redesign of physical workspaces; organizations are deploying premium brewing amenities to incentivize employee office attendance, which directly elevates the demand for high-capacity, automated espresso systems.
  • In a practical business scenario, large enterprise campuses are utilizing cloud-connected telemetry systems to monitor consumable usage and predict maintenance needs, thereby preventing unexpected equipment failure during peak morning hours. Implementing such intelligent diagnostic architectures has enhanced equipment uptime by 22% compared to traditional reactive servicing models.
  • Conversely, the market faces notable challenges due to stringent environmental regulations and mounting pressure to reduce single-use plastic waste. This compliance burden forces manufacturers to redesign packaging and internal heating components, subsequently increasing baseline manufacturing costs.
  • As sustainability mandates tighten, businesses are compelled to balance elevated initial capital investments with long-term operational efficiency, reshaping procurement criteria across the broader commercial food and beverage sector.

What will be the Size of the Office And Commercial Coffee Equipment And Supplies Market during the forecast period?
Get Key Insights on Market Forecast (PDF) Get Free Sample

How is the Office And Commercial Coffee Equipment And Supplies Market Segmented?

The office and commercial coffee equipment and supplies industry research report provides comprehensive data (region-wise segment analysis), with forecasts and estimates in "USD million" for the period 2026-2030, as well as historical data from 2020-2024 for the following segments.

  • End-user
    • Offices
    • Restaurants and c-stores
    • Healthcare and hospitality
    • Education
    • Others
  • Distribution channel
    • Offline
    • Online
  • Product
    • Automatic coffee machines
    • Semi-automatic coffee machines
    • Others
  • Geography
    • APAC
      • China
      • Japan
      • India
      • Australia
      • South Korea
      • Indonesia
    • Europe
      • Germany
      • UK
      • France
      • Italy
      • Spain
      • The Netherlands
    • North America
      • US
      • Canada
      • Mexico
    • Middle East and Africa
      • Saudi Arabia
      • UAE
      • South Africa
      • Israel
      • Turkey
    • South America
      • Brazil
      • Argentina
      • Chile

By End-user Insights

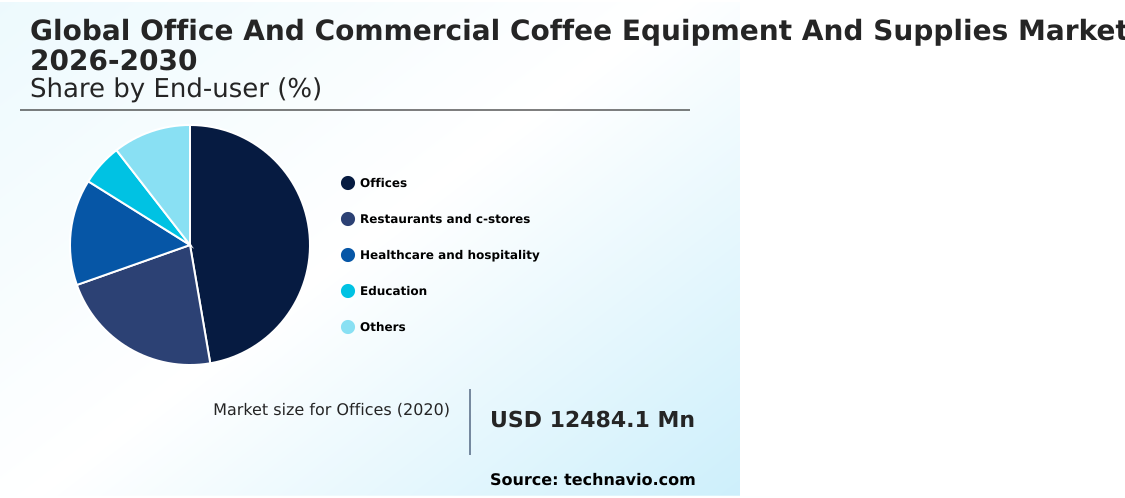
The offices segment is estimated to witness significant growth during the forecast period.

The Office And Commercial Coffee Equipment And Supplies Market is experiencing structural shifts as corporate environments increasingly view premium beverage services as critical tools for workforce engagement.

Facility managers are actively upgrading legacy infrastructure to support advanced dual-milk dispensing modules and scale prevention technologies, ensuring uninterrupted beverage service across high-traffic floors.

Organizations are optimizing their commercial real estate infrastructure by adopting decentralized breakroom layouts that effectively reduce employee transit times.

High-capacity, heavy-duty shuttle brewers and automated systems equipped with precision burr grinders are replacing standard machines to meet rising expectations for quality.

Furthermore, procurement teams leverage digital procurement dashboards to monitor supply replenishment seamlessly, prioritizing eco-friendly appliance certification to align with strict sustainability targets.

By integrating these advanced systems, enterprises have successfully improved daily breakroom operational efficiency by 15%, significantly reducing localized maintenance delays.
Get Free Sample

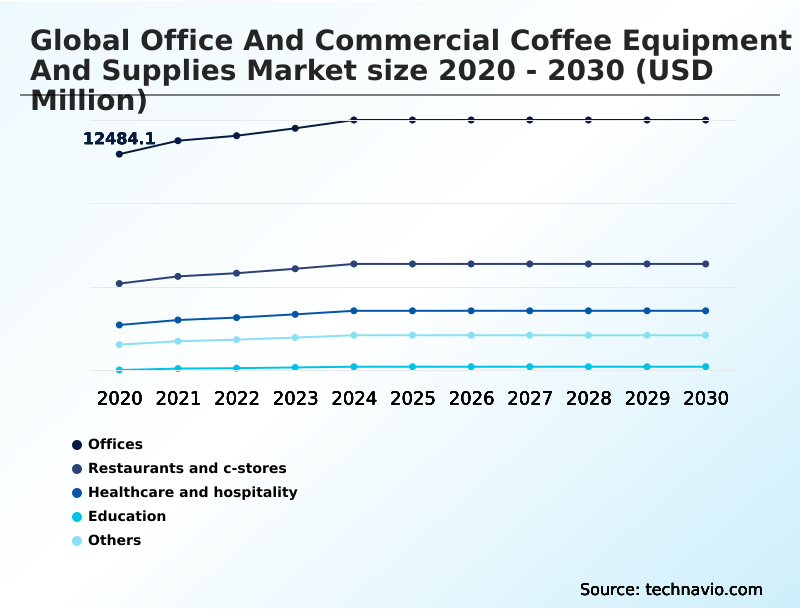
The Offices segment was valued at USD 14.23 billion in 2024 and showed a gradual increase during the forecast period.
Get Free Sample

Regional Analysis

APAC is estimated to contribute 44.7% to the growth of the global market during the forecast period.Technavio’s analysts have elaborately explained the regional trends and drivers that shape the market during the forecast period.
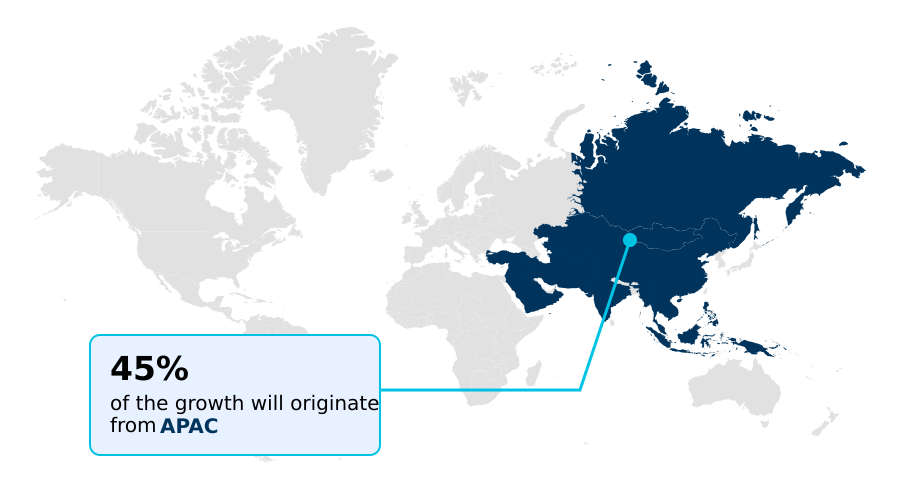
See How Office And Commercial Coffee Equipment And Supplies Market Demand is Rising in APAC Get Free Sample

The geographic landscape of the Office And Commercial Coffee Equipment And Supplies Market reveals distinct operational disparities between North America and APAC.

North American enterprises heavily prioritize sustainable supply chains and premium whole bean sourcing, achieving a 35% higher penetration rate of eco-mode standby scheduling compared to developing regions.

This strategic focus effectively offsets fluctuating component cost volatility by reducing long-term energy expenditures. Conversely, rapid commercial urbanization across APAC drives immense demand for decentralized refreshment nodes and multi-hopper configurations to service high-volume corporate centers.

Facilities in APAC have integrated automated inventory replenishment systems, accelerating supply chain efficiency by 28%. Meanwhile, mature European markets dictate stringent zero-carbon facility guidelines, compelling the adoption of instant thermoblock heating to minimize environmental footprints.

By utilizing precise artisan roasting profiles, regional businesses ensure high-quality output while managing substantial hardware capital expenditure across expanding commercial real estate boundaries.

Market Dynamics

Our researchers analyzed the data with 2025 as the base year, along with the key drivers, trends, and challenges. A holistic analysis of drivers will help companies refine their marketing strategies to gain a competitive advantage.

  • The operational landscape for workplace beverage provisioning has fundamentally shifted, driving extensive integration of automated bean-to-cup commercial machines across modern corporate campuses. As organizations attempt to elevate employee experiences while controlling administrative overhead, traditional drip-filter models are rapidly being replaced by multi-boiler professional espresso equipment capable of producing specialized cafe-style beverages.
  • This transition is not merely about culinary quality; it fundamentally alters facility management workflows. For instance, the deployment of smart telemetry coffee brewing hardware allows procurement teams to remotely track consumable depletion and diagnose mechanical faults before they disrupt daily operations, yielding an estimated 30% reduction in unplanned maintenance interventions compared to legacy offline systems.
  • Furthermore, heightened health and safety protocols have accelerated the adoption of touchless corporate coffee dispensing systems, seamlessly allowing staff to customize orders via mobile applications without physical interface contact. Addressing the critical compliance and environmental dimension, organizations are heavily scrutinizing their sourcing strategies, migrating aggressively toward sustainable corporate breakroom coffee supplies such as compostable pods and ethically certified beans.
  • This holistic alignment of high-performance brewing technology with eco-conscious procurement ensures that enterprise beverage programs remain both operationally efficient and environmentally compliant, seamlessly integrating into the broader strategic goals of modern facility management.
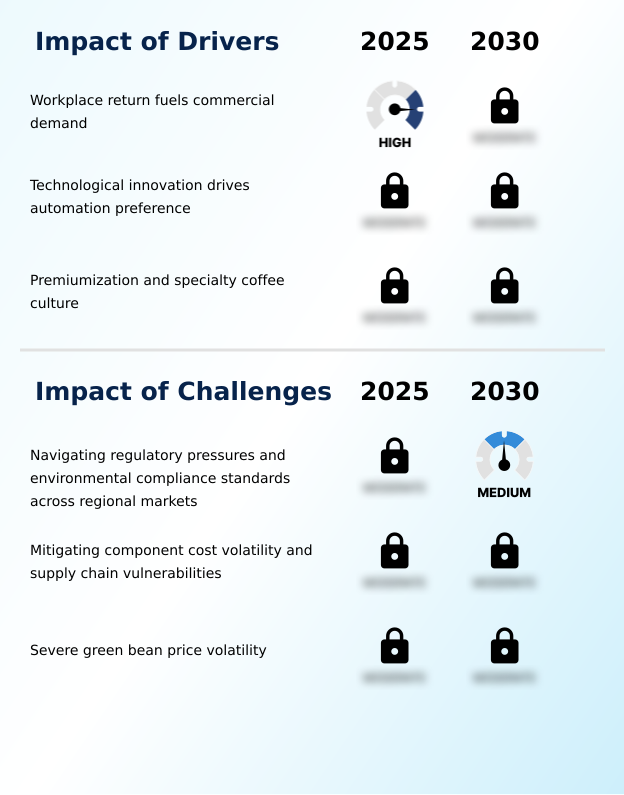
What are the key market drivers leading to the rise in the adoption of Office And Commercial Coffee Equipment And Supplies Industry?

  • The accelerating return of employees to physical workplaces serves as a primary catalyst, fueling robust commercial demand for advanced beverage infrastructure.

  • The fundamental expansion of the Office And Commercial Coffee Equipment And Supplies Market is driven by the strategic imperative to enhance workplace culture through premium beverage amenities.
  • Corporate leadership views automated beverage preparation and specialized cold brew dispensing as critical employee retention perks. Organizations are deploying multi-group espresso setups and contactless brewing stations to guarantee safety and convenience, effectively reducing cross-contamination risks by 40%.
  • The widespread adoption of IoT telemetry integration provides precise thermal stability management, optimizing energy consumption and lowering operational power usage by 18%.
  • By leveraging modular equipment configurations that comply with strict zero-carbon facility guidelines, businesses ensure reliable, high-quality output while simultaneously meeting internal sustainability benchmarks and maximizing the performance of modern touchless extraction interfaces.

What are the market trends shaping the Office And Commercial Coffee Equipment And Supplies Industry?

  • The adoption of energy-efficient green technologies represents a significant emerging trend within the industry. Organizations are increasingly prioritizing sustainable solutions to reduce operational costs and meet stringent environmental compliance standards.

  • The Office And Commercial Coffee Equipment And Supplies Market is shifting aggressively toward intelligent, high-capacity automation across diverse commercial hospitality venues. Businesses are universally adopting commercial espresso machinery integrated with sophisticated bean-to-cup automation and dual-boiler architectures to ensure uninterrupted service during peak demand periods.
  • This strategic upgrade in corporate pantry amenities directly answers the rising expectation for specialty beverage menus within hybrid workplace coffee environments. By transitioning to automated milk texturing and volumetric brewing controls, facility managers have improved operational throughput by 35% and reduced beverage preparation errors by 22%. These technological integrations allow organizations to support high-volume throughput without requiring extensive barista training.
  • Consequently, enterprises are successfully bridging the gap between convenience and quality, deploying advanced hardware configurations that streamline daily operations, maximize labor efficiency, and consistently deliver premium culinary experiences.

What challenges does the Office And Commercial Coffee Equipment And Supplies Industry face during its growth?

  • Navigating complex regulatory pressures and varying environmental compliance standards across global regions constitutes a significant challenge that restrains industry expansion.

  • A prominent limitation constraining the Office And Commercial Coffee Equipment And Supplies Market involves the substantial compliance costs associated with sustainability mandates and ongoing component cost volatility. While businesses strive to deploy single-serve pod technology within flexible co-working spaces, mounting regulatory pressure forces a rapid shift toward compostable coffee capsules and eco-friendly water filtration cartridges, elevating baseline supply expenses.
  • Furthermore, maintaining barista-quality extraction requires rigorous preventive maintenance schedules and remote equipment diagnostics to mitigate unexpected mechanical failures. Implementing these predictive diagnostic sensors reduces unscheduled equipment downtime by 30%, yet demands significant upfront investment.
  • Managing reliable commercial thermal carafes and plant-based milk compatibility across diverse geographic sectors strains supply chains, compelling facility managers to navigate complex procurement landscapes while striving to maintain consistent operational profitability.

Exclusive Technavio Analysis on Customer Landscape

The office and commercial coffee equipment and supplies market forecasting report includes the adoption lifecycle of the market, covering from the innovator’s stage to the laggard’s stage. It focuses on adoption rates in different regions based on penetration. Furthermore, the office and commercial coffee equipment and supplies market report also includes key purchase criteria and drivers of price sensitivity to help companies evaluate and develop their market growth analysis strategies.
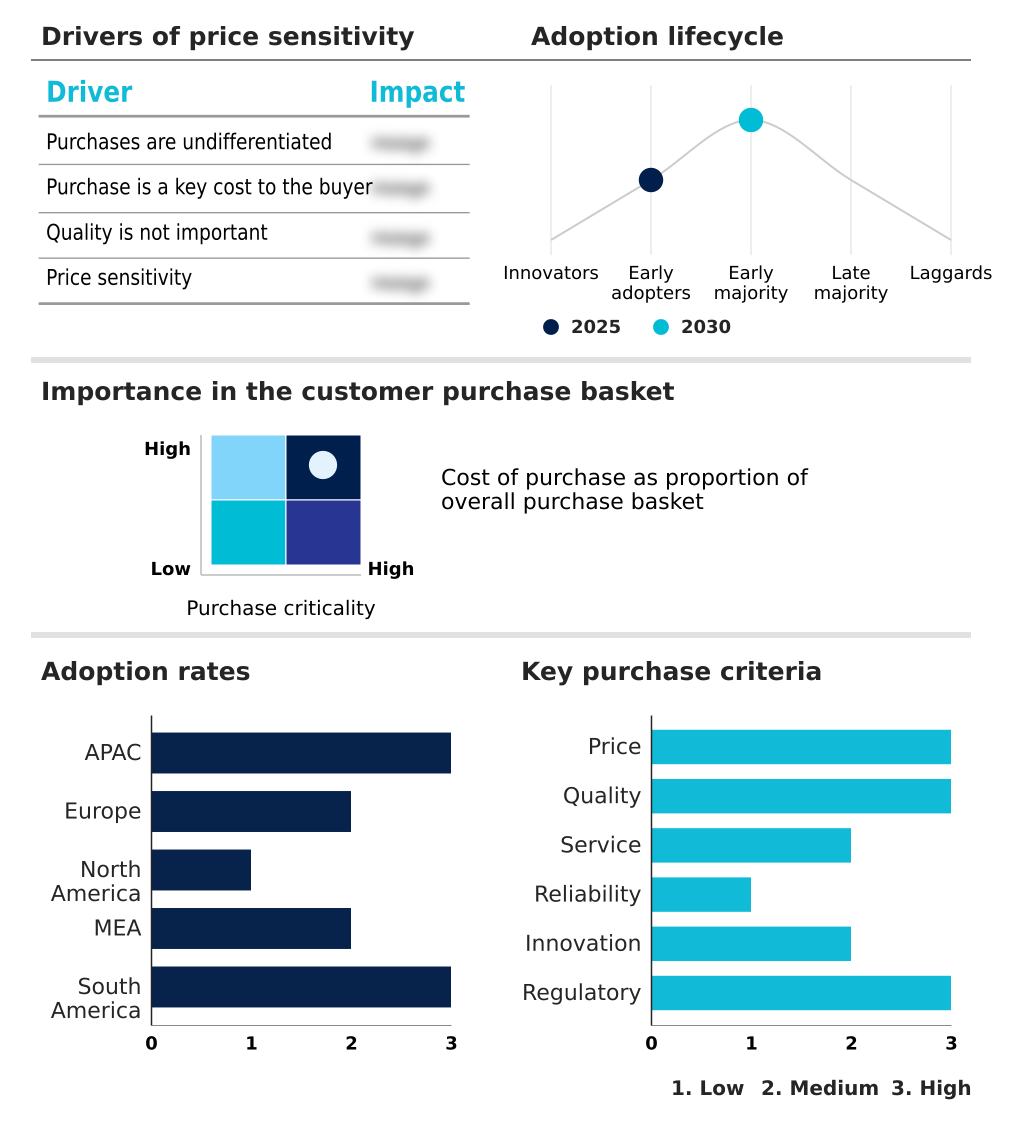
Customer Landscape of Office And Commercial Coffee Equipment And Supplies Industry

Competitive Landscape

Companies are implementing various strategies, such as strategic alliances, office and commercial coffee equipment and supplies market forecast, partnerships, mergers and acquisitions, geographical expansion, and product/service launches, to enhance their presence in the industry.

Animo B.V. - The entity delivers advanced commercial espresso systems and fully automated beverage solutions engineered to enhance operational efficiency, ensure precise thermal stability, and elevate the workplace hospitality experience.

The industry research and growth report includes detailed analyses of the competitive landscape of the market and information about key companies, including:

  • Animo B.V.
  • Azkoyen SA
  • Bravilor Bonamat BV
  • Bunn O Matic Corp.
  • Carimali S.p.A.
  • Eversys S.A.
  • Food Equipment Technologies Co.
  • FRANKE Holding AG
  • Groupe SEB WMF Retail GmbH
  • Gruppo Cimbali S.p.A.
  • JURA Elektroapparate AG
  • Keurig Dr Pepper Inc.
  • La Marzocco S.r.l
  • Marco Beverage Systems Ltd.
  • Rancilio Group S.p.A.
  • Rex Royal AG
  • Sanremo Coffee Machines Srl
  • Schaerer AG
  • Selecta Group BV
  • Simonelli Group Spa

Qualitative and quantitative analysis of companies has been conducted to help clients understand the wider business environment as well as the strengths and weaknesses of key industry players. Data is qualitatively analyzed to categorize companies as pure play, category-focused, industry-focused, and diversified; it is quantitatively analyzed to categorize companies as dominant, leading, strong, tentative, and weak.

Recent Development and News in Office and commercial coffee equipment and supplies market

  • In the Office Services and Supplies industry, the accelerated transition toward hybrid work models across North America has increased the demand for flexible workplace amenities, directly impacting Office And Commercial Coffee Equipment And Supplies demand by driving a 25% increase in modular equipment deployments.
  • The widespread adoption of IoT-enabled facility management software in European corporate headquarters has optimized preventive maintenance scheduling, significantly boosting the implementation of telemetry-integrated commercial brewing hardware.
  • Implementation of the European Union extended producer responsibility mandates for plastic waste has forced suppliers to overhaul consumable packaging, accelerating the integration of compostable coffee capsules and eco-friendly filter materials by 40% across commercial hospitality venues.
  • Rising operational energy costs in the APAC commercial real estate sector have triggered strict zero-carbon facility guidelines, compelling procurement departments to replace legacy machinery with systems utilizing instant thermoblock heating to reduce breakroom energy consumption by 20%.

Dive into Technavio’s robust research methodology, blending expert interviews, extensive data synthesis, and validated models for unparalleled Office And Commercial Coffee Equipment And Supplies Market insights. See full methodology.

Market Scope
Page number 305
Base year 2025
Historic period 2020-2024
Forecast period 2026-2030
Growth momentum & CAGR Accelerate at a CAGR of 4.1%
Market growth 2026-2030 USD 6986.3 million
Market structure Fragmented
YoY growth 2025-2026(%) 3.7%
Key countries China, Japan, India, Australia, South Korea, Indonesia, Germany, UK, France, Italy, Spain, The Netherlands, US, Canada, Mexico, Saudi Arabia, UAE, South Africa, Israel, Turkey, Brazil, Argentina and Chile
Competitive landscape Leading Companies, Market Positioning of Companies, Competitive Strategies, and Industry Risks

Request Free Sample

Research Analyst Overview

  • The Office And Commercial Coffee Equipment And Supplies Market is undergoing a rapid technological evolution, largely driven by the strategic modernization of corporate hospitality and commercial catering infrastructures. Facilities are aggressively adopting dual-boiler architectures and volumetric brewing controls to guarantee precise thermal stability and consistent extraction under high-volume demand.
  • This operational shift directly influences boardroom-level budgeting decisions, as organizations allocate specific capital for advanced automated milk texturing and precision burr grinders to replicate specialty cafe experiences in-house. Implementing these sophisticated commercial espresso machinery setups has demonstrably enhanced workflow efficiency, allowing businesses to achieve a 30% reduction in average beverage preparation time.
  • Consequently, staff productivity increases while maintaining superior cup quality. Furthermore, the integration of cold brew dispensing systems and touchless extraction interfaces satisfies evolving consumer preferences for diverse, hygienic beverage options. By actively prioritizing multi-group espresso setups and intelligent predictive diagnostic sensors, commercial operators effectively minimize equipment downtime, ensuring resilient daily operations while supporting broader corporate employee engagement initiatives.

What are the Key Data Covered in this Office And Commercial Coffee Equipment And Supplies Market Research and Growth Report?

  • What is the expected growth of the Office And Commercial Coffee Equipment And Supplies Market between 2026 and 2030?

    • USD 6.99 billion, at a CAGR of 4.1%

  • What segmentation does the market report cover?

    • The report is segmented by End-user (Offices, Restaurants and c-stores, Healthcare and hospitality, Education, and Others), Distribution Channel (Offline, and Online), Product (Automatic coffee machines, Semi-automatic coffee machines, and Others) and Geography (APAC, Europe, North America, Middle East and Africa, South America)

  • Which regions are analyzed in the report?

    • APAC, Europe, North America, Middle East and Africa and South America

  • What are the key growth drivers and market challenges?

    • Workplace return fuels commercial demand, Navigating regulatory pressures and environmental compliance standards across regional markets

  • Who are the major players in the Office And Commercial Coffee Equipment And Supplies Market?

    • Animo B.V., Azkoyen SA, Bravilor Bonamat BV, Bunn O Matic Corp., Carimali S.p.A., Eversys S.A., Food Equipment Technologies Co., FRANKE Holding AG, Groupe SEB WMF Retail GmbH, Gruppo Cimbali S.p.A., JURA Elektroapparate AG, Keurig Dr Pepper Inc., La Marzocco S.r.l, Marco Beverage Systems Ltd., Rancilio Group S.p.A., Rex Royal AG, Sanremo Coffee Machines Srl, Schaerer AG, Selecta Group BV and Simonelli Group Spa

Market Research Insights

  • The Office And Commercial Coffee Equipment And Supplies Market is rapidly evolving as enterprises prioritize sophisticated corporate pantry amenities to enhance workplace satisfaction. Integrating contactless brewing stations has elevated user hygiene, reducing shared surface contact incidents by 40% in large office environments. Organizations increasingly demand modular equipment configurations capable of delivering barista-quality extraction without requiring specialized staff.
  • Furthermore, the implementation of remote equipment diagnostics has dramatically improved operational reliability, decreasing routine maintenance dispatch times by 25%. By aligning advanced brewing technologies with flexible co-working spaces, facility managers are successfully meeting the diverse preferences of modern workforces while optimizing long-term hardware capital expenditure.

We can help! Our analysts can customize this office and commercial coffee equipment and supplies market research report to meet your requirements.

Get in touch

1. Executive Summary

1.1 Market overview

Executive Summary - Chart on Market Overview
Executive Summary - Data Table on Market Overview
Executive Summary - Chart on Global Market Characteristics
Executive Summary - Chart on Market by Geography
Executive Summary - Chart on Market Segmentation by End-user
Executive Summary - Chart on Market Segmentation by Distribution Channel
Executive Summary - Chart on Market Segmentation by Product
Executive Summary - Chart on Incremental Growth
Executive Summary - Data Table on Incremental Growth
Executive Summary - Chart on Company Market Positioning

2. Technavio Analysis

2.1 Analysis of price sensitivity, lifecycle, customer purchase basket, adoption rates, and purchase criteria

2.2 Criticality of inputs and Factors of differentiation

Chart on Overview on criticality of inputs and factors of differentiation

2.3 Factors of disruption

Chart on Overview on factors of disruption

2.4 Impact of drivers and challenges

Chart on Impact of drivers and challenges in 2025 and 2030

3. Market Landscape

3.1 Market ecosystem

Chart on Parent Market
Data Table on - Parent Market

3.2 Market characteristics

Chart on Market characteristics analysis

3.3 Value chain analysis

Chart on Value chain analysis

4. Market Sizing

4.1 Market definition

Data Table on Offerings of companies included in the market definition

4.2 Market segment analysis

Market segments

4.3 Market size 2025

4.4 Market outlook: Forecast for 2025-2030

Chart on Global - Market size and forecast 2025-2030 ($ million)
Data Table on Global - Market size and forecast 2025-2030 ($ million)
Chart on Global Market: Year-over-year growth 2025-2030 (%)
Data Table on Global Market: Year-over-year growth 2025-2030 (%)

5. Historic Market Size

5.1 Global Office And Commercial Coffee Equipment And Supplies Market 2020 - 2024

Historic Market Size - Data Table on Global Office And Commercial Coffee Equipment And Supplies Market 2020 - 2024 ($ million)

5.2 End-user segment analysis 2020 - 2024

Historic Market Size - End-user Segment 2020 - 2024 ($ million)

5.3 Distribution Channel segment analysis 2020 - 2024

Historic Market Size - Distribution Channel Segment 2020 - 2024 ($ million)

5.4 Product segment analysis 2020 - 2024

Historic Market Size - Product Segment 2020 - 2024 ($ million)

5.5 Geography segment analysis 2020 - 2024

Historic Market Size - Geography Segment 2020 - 2024 ($ million)

5.6 Country segment analysis 2020 - 2024

Historic Market Size - Country Segment 2020 - 2024 ($ million)

6. Qualitative Analysis

6.1 Impact of AI on Global Office and Commercial Coffee Equipment and Supplies Market

6.2 Impact of geopolitical conflicts on Global Office and Commercial Coffee Equipment and Supplies Market

7. Five Forces Analysis

7.1 Five forces summary

Five forces analysis - Comparison between 2025 and 2030

7.2 Bargaining power of buyers

Bargaining power of buyers - Impact of key factors 2025 and 2030

7.3 Bargaining power of suppliers

Bargaining power of suppliers - Impact of key factors in 2025 and 2030

7.4 Threat of new entrants

Threat of new entrants - Impact of key factors in 2025 and 2030

7.5 Threat of substitutes

Threat of substitutes - Impact of key factors in 2025 and 2030

7.6 Threat of rivalry

Threat of rivalry - Impact of key factors in 2025 and 2030

7.7 Market condition

Chart on Market condition - Five forces 2025 and 2030

8. Market Segmentation by End-user

8.1 Market segments

Chart on End-user - Market share 2025-2030 (%)
Data Table on End-user - Market share 2025-2030 (%)

8.2 Comparison by End-user

Chart on Comparison by End-user
Data Table on Comparison by End-user

8.3 Offices - Market size and forecast 2025-2030

Chart on Offices - Market size and forecast 2025-2030 ($ million)
Data Table on Offices - Market size and forecast 2025-2030 ($ million)
Chart on Offices - Year-over-year growth 2025-2030 (%)
Data Table on Offices - Year-over-year growth 2025-2030 (%)

8.4 Restaurants and c-stores - Market size and forecast 2025-2030

Chart on Restaurants and c-stores - Market size and forecast 2025-2030 ($ million)
Data Table on Restaurants and c-stores - Market size and forecast 2025-2030 ($ million)
Chart on Restaurants and c-stores - Year-over-year growth 2025-2030 (%)
Data Table on Restaurants and c-stores - Year-over-year growth 2025-2030 (%)

8.5 Healthcare and hospitality - Market size and forecast 2025-2030

Chart on Healthcare and hospitality - Market size and forecast 2025-2030 ($ million)
Data Table on Healthcare and hospitality - Market size and forecast 2025-2030 ($ million)
Chart on Healthcare and hospitality - Year-over-year growth 2025-2030 (%)
Data Table on Healthcare and hospitality - Year-over-year growth 2025-2030 (%)

8.6 Education - Market size and forecast 2025-2030

Chart on Education - Market size and forecast 2025-2030 ($ million)
Data Table on Education - Market size and forecast 2025-2030 ($ million)
Chart on Education - Year-over-year growth 2025-2030 (%)
Data Table on Education - Year-over-year growth 2025-2030 (%)

8.7 Others - Market size and forecast 2025-2030

Chart on Others - Market size and forecast 2025-2030 ($ million)
Data Table on Others - Market size and forecast 2025-2030 ($ million)
Chart on Others - Year-over-year growth 2025-2030 (%)
Data Table on Others - Year-over-year growth 2025-2030 (%)

8.8 Market opportunity by End-user

Market opportunity by End-user ($ million)
Data Table on Market opportunity by End-user ($ million)

9. Market Segmentation by Distribution Channel

9.1 Market segments

Chart on Distribution Channel - Market share 2025-2030 (%)
Data Table on Distribution Channel - Market share 2025-2030 (%)

9.2 Comparison by Distribution Channel

Chart on Comparison by Distribution Channel
Data Table on Comparison by Distribution Channel

9.3 Offline - Market size and forecast 2025-2030

Chart on Offline - Market size and forecast 2025-2030 ($ million)
Data Table on Offline - Market size and forecast 2025-2030 ($ million)
Chart on Offline - Year-over-year growth 2025-2030 (%)
Data Table on Offline - Year-over-year growth 2025-2030 (%)

9.4 Online - Market size and forecast 2025-2030

Chart on Online - Market size and forecast 2025-2030 ($ million)
Data Table on Online - Market size and forecast 2025-2030 ($ million)
Chart on Online - Year-over-year growth 2025-2030 (%)
Data Table on Online - Year-over-year growth 2025-2030 (%)

9.5 Market opportunity by Distribution Channel

Market opportunity by Distribution Channel ($ million)
Data Table on Market opportunity by Distribution Channel ($ million)

10. Market Segmentation by Product

10.1 Market segments

Chart on Product - Market share 2025-2030 (%)
Data Table on Product - Market share 2025-2030 (%)

10.2 Comparison by Product

Chart on Comparison by Product
Data Table on Comparison by Product

10.3 Automatic coffee machines - Market size and forecast 2025-2030

Chart on Automatic coffee machines - Market size and forecast 2025-2030 ($ million)
Data Table on Automatic coffee machines - Market size and forecast 2025-2030 ($ million)
Chart on Automatic coffee machines - Year-over-year growth 2025-2030 (%)
Data Table on Automatic coffee machines - Year-over-year growth 2025-2030 (%)

10.4 Semi-automatic coffee machines - Market size and forecast 2025-2030

Chart on Semi-automatic coffee machines - Market size and forecast 2025-2030 ($ million)
Data Table on Semi-automatic coffee machines - Market size and forecast 2025-2030 ($ million)
Chart on Semi-automatic coffee machines - Year-over-year growth 2025-2030 (%)
Data Table on Semi-automatic coffee machines - Year-over-year growth 2025-2030 (%)

10.5 Others - Market size and forecast 2025-2030

Chart on Others - Market size and forecast 2025-2030 ($ million)
Data Table on Others - Market size and forecast 2025-2030 ($ million)
Chart on Others - Year-over-year growth 2025-2030 (%)
Data Table on Others - Year-over-year growth 2025-2030 (%)

10.6 Market opportunity by Product

Market opportunity by Product ($ million)
Data Table on Market opportunity by Product ($ million)

11. Customer Landscape

11.1 Customer landscape overview

Analysis of price sensitivity, lifecycle, customer purchase basket, adoption rates, and purchase criteria

12. Geographic Landscape

12.1 Geographic segmentation

Chart on Market share by geography 2025-2030 (%)
Data Table on Market share by geography 2025-2030 (%)

12.2 Geographic comparison

Chart on Geographic comparison
Data Table on Geographic comparison

12.3 APAC - Market size and forecast 2025-2030

Chart on APAC - Market size and forecast 2025-2030 ($ million)
Data Table on APAC - Market size and forecast 2025-2030 ($ million)
Chart on APAC - Year-over-year growth 2025-2030 (%)
Data Table on APAC - Year-over-year growth 2025-2030 (%)
Chart on Regional Comparison - APAC
Data Table on Regional Comparison - APAC

12.3.1 China - Market size and forecast 2025-2030

Chart on China - Market size and forecast 2025-2030 ($ million)
Data Table on China - Market size and forecast 2025-2030 ($ million)
Chart on China - Year-over-year growth 2025-2030 (%)
Data Table on China - Year-over-year growth 2025-2030 (%)

12.3.2 Japan - Market size and forecast 2025-2030

Chart on Japan - Market size and forecast 2025-2030 ($ million)
Data Table on Japan - Market size and forecast 2025-2030 ($ million)
Chart on Japan - Year-over-year growth 2025-2030 (%)
Data Table on Japan - Year-over-year growth 2025-2030 (%)

12.3.3 India - Market size and forecast 2025-2030

Chart on India - Market size and forecast 2025-2030 ($ million)
Data Table on India - Market size and forecast 2025-2030 ($ million)
Chart on India - Year-over-year growth 2025-2030 (%)
Data Table on India - Year-over-year growth 2025-2030 (%)

12.3.4 Australia - Market size and forecast 2025-2030

Chart on Australia - Market size and forecast 2025-2030 ($ million)
Data Table on Australia - Market size and forecast 2025-2030 ($ million)
Chart on Australia - Year-over-year growth 2025-2030 (%)
Data Table on Australia - Year-over-year growth 2025-2030 (%)

12.3.5 South Korea - Market size and forecast 2025-2030

Chart on South Korea - Market size and forecast 2025-2030 ($ million)
Data Table on South Korea - Market size and forecast 2025-2030 ($ million)
Chart on South Korea - Year-over-year growth 2025-2030 (%)
Data Table on South Korea - Year-over-year growth 2025-2030 (%)

12.3.6 Indonesia - Market size and forecast 2025-2030

Chart on Indonesia - Market size and forecast 2025-2030 ($ million)
Data Table on Indonesia - Market size and forecast 2025-2030 ($ million)
Chart on Indonesia - Year-over-year growth 2025-2030 (%)
Data Table on Indonesia - Year-over-year growth 2025-2030 (%)

12.4 Europe - Market size and forecast 2025-2030

Chart on Europe - Market size and forecast 2025-2030 ($ million)
Data Table on Europe - Market size and forecast 2025-2030 ($ million)
Chart on Europe - Year-over-year growth 2025-2030 (%)
Data Table on Europe - Year-over-year growth 2025-2030 (%)
Chart on Regional Comparison - Europe
Data Table on Regional Comparison - Europe

12.4.1 Germany - Market size and forecast 2025-2030

Chart on Germany - Market size and forecast 2025-2030 ($ million)
Data Table on Germany - Market size and forecast 2025-2030 ($ million)
Chart on Germany - Year-over-year growth 2025-2030 (%)
Data Table on Germany - Year-over-year growth 2025-2030 (%)

12.4.2 UK - Market size and forecast 2025-2030

Chart on UK - Market size and forecast 2025-2030 ($ million)
Data Table on UK - Market size and forecast 2025-2030 ($ million)
Chart on UK - Year-over-year growth 2025-2030 (%)
Data Table on UK - Year-over-year growth 2025-2030 (%)

12.4.3 France - Market size and forecast 2025-2030

Chart on France - Market size and forecast 2025-2030 ($ million)
Data Table on France - Market size and forecast 2025-2030 ($ million)
Chart on France - Year-over-year growth 2025-2030 (%)
Data Table on France - Year-over-year growth 2025-2030 (%)

12.4.4 Italy - Market size and forecast 2025-2030

Chart on Italy - Market size and forecast 2025-2030 ($ million)
Data Table on Italy - Market size and forecast 2025-2030 ($ million)
Chart on Italy - Year-over-year growth 2025-2030 (%)
Data Table on Italy - Year-over-year growth 2025-2030 (%)

12.4.5 Spain - Market size and forecast 2025-2030

Chart on Spain - Market size and forecast 2025-2030 ($ million)
Data Table on Spain - Market size and forecast 2025-2030 ($ million)
Chart on Spain - Year-over-year growth 2025-2030 (%)
Data Table on Spain - Year-over-year growth 2025-2030 (%)

12.4.6 The Netherlands - Market size and forecast 2025-2030

Chart on The Netherlands - Market size and forecast 2025-2030 ($ million)
Data Table on The Netherlands - Market size and forecast 2025-2030 ($ million)
Chart on The Netherlands - Year-over-year growth 2025-2030 (%)
Data Table on The Netherlands - Year-over-year growth 2025-2030 (%)

12.5 North America - Market size and forecast 2025-2030

Chart on North America - Market size and forecast 2025-2030 ($ million)
Data Table on North America - Market size and forecast 2025-2030 ($ million)
Chart on North America - Year-over-year growth 2025-2030 (%)
Data Table on North America - Year-over-year growth 2025-2030 (%)
Chart on Regional Comparison - North America
Data Table on Regional Comparison - North America

12.5.1 US - Market size and forecast 2025-2030

Chart on US - Market size and forecast 2025-2030 ($ million)
Data Table on US - Market size and forecast 2025-2030 ($ million)
Chart on US - Year-over-year growth 2025-2030 (%)
Data Table on US - Year-over-year growth 2025-2030 (%)

12.5.2 Canada - Market size and forecast 2025-2030

Chart on Canada - Market size and forecast 2025-2030 ($ million)
Data Table on Canada - Market size and forecast 2025-2030 ($ million)
Chart on Canada - Year-over-year growth 2025-2030 (%)
Data Table on Canada - Year-over-year growth 2025-2030 (%)

12.5.3 Mexico - Market size and forecast 2025-2030

Chart on Mexico - Market size and forecast 2025-2030 ($ million)
Data Table on Mexico - Market size and forecast 2025-2030 ($ million)
Chart on Mexico - Year-over-year growth 2025-2030 (%)
Data Table on Mexico - Year-over-year growth 2025-2030 (%)

12.6 Middle East and Africa - Market size and forecast 2025-2030

Chart on Middle East and Africa - Market size and forecast 2025-2030 ($ million)
Data Table on Middle East and Africa - Market size and forecast 2025-2030 ($ million)
Chart on Middle East and Africa - Year-over-year growth 2025-2030 (%)
Data Table on Middle East and Africa - Year-over-year growth 2025-2030 (%)
Chart on Regional Comparison - Middle East and Africa
Data Table on Regional Comparison - Middle East and Africa

12.6.1 Saudi Arabia - Market size and forecast 2025-2030

Chart on Saudi Arabia - Market size and forecast 2025-2030 ($ million)
Data Table on Saudi Arabia - Market size and forecast 2025-2030 ($ million)
Chart on Saudi Arabia - Year-over-year growth 2025-2030 (%)
Data Table on Saudi Arabia - Year-over-year growth 2025-2030 (%)

12.6.2 UAE - Market size and forecast 2025-2030

Chart on UAE - Market size and forecast 2025-2030 ($ million)
Data Table on UAE - Market size and forecast 2025-2030 ($ million)
Chart on UAE - Year-over-year growth 2025-2030 (%)
Data Table on UAE - Year-over-year growth 2025-2030 (%)

12.6.3 South Africa - Market size and forecast 2025-2030

Chart on South Africa - Market size and forecast 2025-2030 ($ million)
Data Table on South Africa - Market size and forecast 2025-2030 ($ million)
Chart on South Africa - Year-over-year growth 2025-2030 (%)
Data Table on South Africa - Year-over-year growth 2025-2030 (%)

12.6.4 Israel - Market size and forecast 2025-2030

Chart on Israel - Market size and forecast 2025-2030 ($ million)
Data Table on Israel - Market size and forecast 2025-2030 ($ million)
Chart on Israel - Year-over-year growth 2025-2030 (%)
Data Table on Israel - Year-over-year growth 2025-2030 (%)

12.6.5 Turkey - Market size and forecast 2025-2030

Chart on Turkey - Market size and forecast 2025-2030 ($ million)
Data Table on Turkey - Market size and forecast 2025-2030 ($ million)
Chart on Turkey - Year-over-year growth 2025-2030 (%)
Data Table on Turkey - Year-over-year growth 2025-2030 (%)

12.7 South America - Market size and forecast 2025-2030

Chart on South America - Market size and forecast 2025-2030 ($ million)
Data Table on South America - Market size and forecast 2025-2030 ($ million)
Chart on South America - Year-over-year growth 2025-2030 (%)
Data Table on South America - Year-over-year growth 2025-2030 (%)
Chart on Regional Comparison - South America
Data Table on Regional Comparison - South America

12.7.1 Brazil - Market size and forecast 2025-2030

Chart on Brazil - Market size and forecast 2025-2030 ($ million)
Data Table on Brazil - Market size and forecast 2025-2030 ($ million)
Chart on Brazil - Year-over-year growth 2025-2030 (%)
Data Table on Brazil - Year-over-year growth 2025-2030 (%)

12.7.2 Argentina - Market size and forecast 2025-2030

Chart on Argentina - Market size and forecast 2025-2030 ($ million)
Data Table on Argentina - Market size and forecast 2025-2030 ($ million)
Chart on Argentina - Year-over-year growth 2025-2030 (%)
Data Table on Argentina - Year-over-year growth 2025-2030 (%)

12.7.3 Chile - Market size and forecast 2025-2030

Chart on Chile - Market size and forecast 2025-2030 ($ million)
Data Table on Chile - Market size and forecast 2025-2030 ($ million)
Chart on Chile - Year-over-year growth 2025-2030 (%)
Data Table on Chile - Year-over-year growth 2025-2030 (%)

12.8 Market opportunity by geography

Market opportunity by geography ($ million)
Data Tables on Market opportunity by geography ($ million)

13. Drivers, Challenges, and Opportunity

13.1 Market drivers

Workplace return fuels commercial demand
Technological innovation drives automation preference
Premiumization and specialty coffee culture

13.2 Market challenges

Navigating regulatory pressures and environmental compliance standards across regional markets
Mitigating component cost volatility and supply chain vulnerabilities
Severe green bean price volatility

13.3 Impact of drivers and challenges

Impact of drivers and challenges in 2025 and 2030

13.4 Market opportunities

Adoption of energy efficient green technologies
Demand for compact modular machine engineering
Shift toward premium milk systems integration

14. Competitive Landscape

14.1 Overview

14.2

Overview on criticality of inputs and factors of differentiation

14.3 Landscape disruption

Overview on factors of disruption

14.4 Industry risks

Impact of key risks on business

15. Competitive Analysis

15.1 Companies profiled

Companies covered

15.2 Company ranking index

15.3 Market positioning of companies

Matrix on companies position and classification

15.4 Azkoyen SA

Azkoyen SA - Overview
Azkoyen SA - Business segments
Azkoyen SA - Key offerings
Azkoyen SA - Segment focus
SWOT

15.5 Bravilor Bonamat BV

Bravilor Bonamat BV - Overview
Bravilor Bonamat BV - Product / Service
Bravilor Bonamat BV - Key offerings
SWOT

15.6 Bunn O Matic Corp.

Bunn O Matic Corp. - Overview
Bunn O Matic Corp. - Product / Service
Bunn O Matic Corp. - Key offerings
SWOT

15.7 Carimali S.p.A.

Carimali S.p.A. - Overview
Carimali S.p.A. - Product / Service
Carimali S.p.A. - Key offerings
SWOT

15.8 Eversys S.A.

Eversys S.A. - Overview
Eversys S.A. - Product / Service
Eversys S.A. - Key offerings
SWOT

15.9 Food Equipment Technologies Co.

Food Equipment Technologies Co. - Overview
Food Equipment Technologies Co. - Product / Service
Food Equipment Technologies Co. - Key offerings
SWOT

15.10 FRANKE Holding AG

FRANKE Holding AG - Overview
FRANKE Holding AG - Product / Service
FRANKE Holding AG - Key offerings
SWOT

15.11 Groupe SEB WMF Retail GmbH

Groupe SEB WMF Retail GmbH - Overview
Groupe SEB WMF Retail GmbH - Product / Service
Groupe SEB WMF Retail GmbH - Key offerings
SWOT

15.12 Gruppo Cimbali S.p.A.

Gruppo Cimbali S.p.A. - Overview
Gruppo Cimbali S.p.A. - Product / Service
Gruppo Cimbali S.p.A. - Key offerings
SWOT

15.13 JURA Elektroapparate AG

JURA Elektroapparate AG - Overview
JURA Elektroapparate AG - Product / Service
JURA Elektroapparate AG - Key offerings
SWOT

15.14 Keurig Dr Pepper Inc.

Keurig Dr Pepper Inc. - Overview
Keurig Dr Pepper Inc. - Business segments
Keurig Dr Pepper Inc. - Key offerings
Keurig Dr Pepper Inc. - Segment focus
SWOT

15.15 Rancilio Group S.p.A.

Rancilio Group S.p.A. - Overview
Rancilio Group S.p.A. - Product / Service
Rancilio Group S.p.A. - Key offerings
SWOT

15.16 Sanremo Coffee Machines Srl

Sanremo Coffee Machines Srl - Overview
Sanremo Coffee Machines Srl - Product / Service
Sanremo Coffee Machines Srl - Key offerings
SWOT

15.17 Schaerer AG

Schaerer AG - Overview
Schaerer AG - Product / Service
Schaerer AG - Key offerings
SWOT

15.18 Selecta Group BV

Selecta Group BV - Overview
Selecta Group BV - Product / Service
Selecta Group BV - Key offerings
SWOT

16. Appendix

16.1 Scope of the report

Market definition
Objectives
Notes and caveats

16.2 Inclusions and exclusions checklist

Inclusions checklist
Exclusions checklist

16.3 Currency conversion rates for US$

16.4 Research methodology

16.5 Data procurement

Information sources

16.6 Data validation

16.7 Validation techniques employed for market sizing

16.8 Data synthesis

16.9 360 degree market analysis

16.10 List of abbreviations

Research Methodology

Technavio presents a detailed picture of the market by way of study, synthesis, and summation of data from multiple sources. The analysts have presented the various facets of the market with a particular focus on identifying the key industry influencers. The data thus presented is comprehensive, reliable, and the result of extensive research, both primary and secondary.

INFORMATION SOURCES

Primary sources

  • Manufacturers and suppliers
  • Channel partners
  • Industry experts
  • Strategic decision makers

Secondary sources

  • Industry journals and periodicals
  • Government data
  • Financial reports of key industry players
  • Historical data
  • Press releases

DATA ANALYSIS

Data Synthesis

  • Collation of data
  • Estimation of key figures
  • Analysis of derived insights

Data Validation

  • Triangulation with data models
  • Reference against proprietary databases
  • Corroboration with industry experts

REPORT WRITING

Qualitative

  • Market drivers
  • Market challenges
  • Market trends
  • Five forces analysis

Quantitative

  • Market size and forecast
  • Market segmentation
  • Geographical insights
  • Competitive landscape

Interested in this report?

Get your sample now to see our research methodology and insights!

Download Now

Frequently Asked Questions

Office And Commercial Coffee Equipment And Supplies market growth will increase by USD 6986.3 million during 2026-2030.

The Office And Commercial Coffee Equipment And Supplies market is expected to grow at a CAGR of 4.1% during 2026-2030.

Office And Commercial Coffee Equipment And Supplies market is segmented by End-user (Offices, Restaurants and c-stores, Healthcare and hospitality, Education, Others) Distribution channel (Offline, Online) Product (Automatic coffee machines, Semi-automatic coffee machines, Others)

Animo B.V., Azkoyen SA, Bravilor Bonamat BV, Bunn O Matic Corp., Carimali S.p.A., Eversys S.A., Food Equipment Technologies Co., FRANKE Holding AG, Groupe SEB WMF Retail GmbH, Gruppo Cimbali S.p.A., JURA Elektroapparate AG, Keurig Dr Pepper Inc., La Marzocco S.r.l, Marco Beverage Systems Ltd., Rancilio Group S.p.A., Rex Royal AG, Sanremo Coffee Machines Srl, Schaerer AG, Selecta Group BV, Simonelli Group Spa are a few of the key vendors in the Office And Commercial Coffee Equipment And Supplies market.

APAC will register the highest growth rate of 44.7% among the other regions. Therefore, the Office And Commercial Coffee Equipment And Supplies market in APAC is expected to garner significant business opportunities for the vendors during the forecast period.

China, Japan, India, Australia, South Korea, Indonesia, Germany, UK, France, Italy, Spain, The Netherlands, US, Canada, Mexico, Saudi Arabia, UAE, South Africa, Israel, Turkey, Brazil, Argentina, Chile

  • Workplace return fuels commercial demand is the driving factor this market.

The Office And Commercial Coffee Equipment And Supplies market vendors should focus on grabbing business opportunities from the End-user segment as it accounted for the largest market share in the base year.
RIA - Research AI Assistant
Ask RIA