Coffee Creamer Market Size 2025-2029
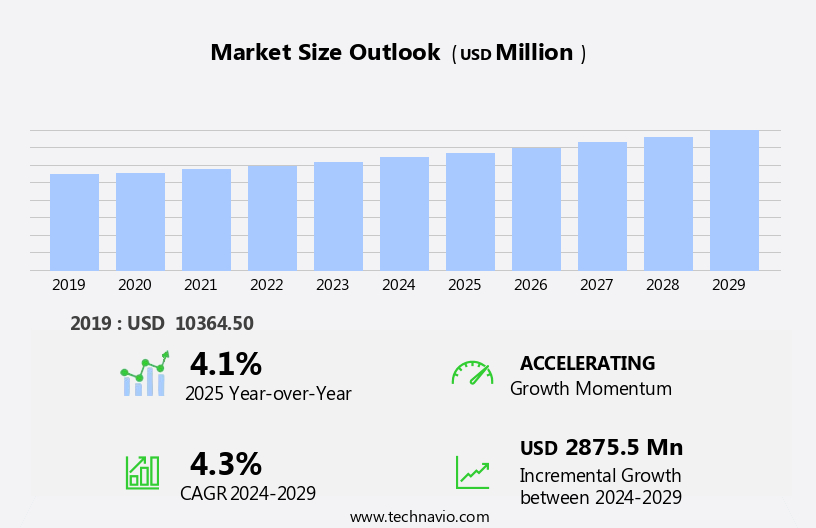
The coffee creamer market size is forecast to increase by USD 2.88 billion, at a CAGR of 4.3% between 2024 and 2029.
- The market is witnessing significant shifts, with the rise of online retailing emerging as a key driver. Consumers increasingly prefer the convenience of purchasing coffee creamers from the comfort of their homes, leading to a surge in demand for e-commerce platforms. However, this trend poses challenges for traditional retailers and manufacturers, requiring them to adapt to the digital landscape to remain competitive. Another significant influence on the market is the clean label movement. Consumers are increasingly demanding transparency in food and beverage products, leading to a growing preference for natural and organic coffee creamers. This trend places pressure on manufacturers to reformulate their products to meet these evolving consumer preferences.
- Simultaneously, the high cost of raw materials and insufficient internal production pose challenges for coffee creamer manufacturers. The increasing prices of essential ingredients, such as dairy and sugar, are pushing up production costs, necessitating price hikes or cost-cutting measures. These challenges require strategic planning and innovative solutions from market players to capitalize on opportunities and navigate obstacles effectively.
What will be the Size of the Coffee Creamer Market during the forecast period?
Explore in-depth regional segment analysis with market size data - historical 2019-2023 and forecasts 2025-2029 - in the full report.
Request Free Sample
The market exhibits a dynamic and evolving landscape, shaped by various factors and applications across multiple sectors. Liquid creamers find extensive use in coffee shops, where they cater to the growing demand for customized beverages. In contrast, home consumption sees a surge in demand for shelf-stable and convenient options, driving the retail channels to stock a diverse range of products. Import markets play a significant role in shaping the market dynamics, with countries like New Zealand and Switzerland being major exporters of dairy creamers. Brand loyalty remains a key driver, with consumers showing preference for unsweetened and natural sweetener-based creamers, as well as those with fair trade and organic certifications.
Wholesale distribution channels and grocery stores continue to dominate the market, while online retail gains traction due to the convenience it offers. Product differentiation is a critical factor, with almond, soy, oat, and other plant-based creamers, as well as lactose-free and sugar-free options, catering to various consumer preferences. Manufacturers focus on food packaging materials, food safety regulations, and ingredient sourcing to maintain quality control and regulatory compliance. The market also witnesses the emergence of product categories such as non-dairy, k-cup, powdered, and single-serve creamers, catering to the diverse needs of consumers. The food service industry and health and wellness trends influence pricing strategies and supply chain management, with refrigerated and bulk creamers gaining popularity.
How is this Coffee Creamer Industry segmented?
The coffee creamer industry research report provides comprehensive data (region-wise segment analysis), with forecasts and estimates in "USD million" for the period 2025-2029, as well as historical data from 2019-2023 for the following segments.
- Type
- Liquid
- Powder
- Channel
- Offline
- Online
- Product
- Non-dairy
- Dairy-based
- Packaging
- Plastic jars
- Tetrapacks
- PET bottles
- Product Type
- Conventional
- Organic
- Geography
- North America
- US
- Canada
- Europe
- France
- Germany
- Italy
- UK
- APAC
- China
- India
- Japan
- South America
- Brazil
- Rest of World (ROW)
- North America
By Type Insights
The liquid segment is estimated to witness significant growth during the forecast period.
Liquid coffee creamers, available in various packaging solutions such as plastic pouches, pump bottles, canes, and spray aerosols, have gained popularity due to their ease of use and creamy texture. The long shelf life of these creamers makes them suitable for both home consumption and coffee shop use. Retail channels, including grocery stores and online retail, dominate the distribution landscape, while import markets cater to the demand for specialized and niche products. Brand loyalty plays a significant role in consumer preferences, with leading brands offering unsweetened, natural sweetener, and fair trade options. Wholesale distribution and supply chain management are crucial for efficient distribution and meeting the increasing demand.
Product differentiation is evident in the market with offerings of almond, soy, oat, cashew, and other milk alternative creamers, as well as sugar-free, lactose-free, and gluten-free options. Food safety regulations and ingredient sourcing are essential considerations for manufacturers to ensure product quality and regulatory compliance. The food service industry and export markets are significant growth areas for the market. Coffee shops and convenience stores also offer single-serve creamers, creamer dispensers, and coffee pods for added convenience. The market trends include the increasing popularity of plant-based creamers, natural sweeteners, and bulk creamers. Regulatory compliance, quality control, and nutritional labeling are essential for maintaining consumer trust and satisfaction.
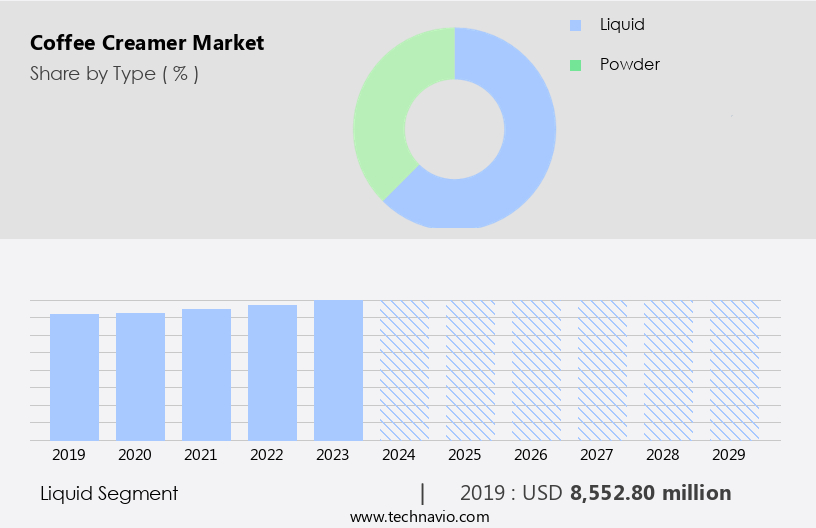
The Liquid segment was valued at USD 8.55 billion in 2019 and showed a gradual increase during the forecast period.
Regional Analysis
APAC is estimated to contribute 36% to the growth of the global market during the forecast period.Technavio's analysts have elaborately explained the regional trends and drivers that shape the market during the forecast period.

The market in North America is experiencing significant growth due to the thriving coffee industry in the region. Coffee is the most-consumed beverage in North America, with daily consumption reaching an all-time high in 2024 at 67%, making it a key driver for the market. Young consumers, particularly those aged 25-39, are a significant contributor to this trend, spending a considerable amount of time in coffee shops due to their busy work schedules. This demographic prefers convenience and variety, leading to an increase in demand for coffee creamers in the corporate consumer sector. Product differentiation is a significant trend in the market, with consumers seeking unsweetened, natural sweetener, and plant-based options.
Liquid creamers, both dairy and non-dairy, dominate the market, with almond, soy, oat, and coconut creamers gaining popularity. Fair trade and organic creamers are also on the rise, as consumers prioritize ethical and sustainable sourcing. Retail channels, including grocery stores and online retailers, dominate the distribution landscape. Wholesale distribution is also a significant channel, particularly for large coffee shops and food service industries. Food safety regulations and ingredient sourcing are crucial considerations for manufacturers, ensuring regulatory compliance and maintaining consumer trust. Brand loyalty is a key factor in the market, with consumers preferring established brands for their consistency and quality.
Pricing strategies and supply chain management are essential for maintaining profitability and meeting demand. Refrigerated and shelf-stable creamers cater to various consumer preferences, with sugar-free and lactose-free options also available. The market is diverse, with various types, including single-serve creamers, creamer dispensers, and k-cup creamers, catering to different consumer needs and preferences. The food service industry and export markets are significant growth opportunities for manufacturers, with the market expected to continue its upward trajectory in the forecast period.
Market Dynamics
Our researchers analyzed the data with 2024 as the base year, along with the key drivers, trends, and challenges. A holistic analysis of drivers will help companies refine their marketing strategies to gain a competitive advantage.
B2B creamer supply strategies leverage plant-based creamer technologies to meet diverse dietary needs. Coffee creamer prospects 2025 include non-dairy creamers for cafes and low-sugar creamer options, appealing to health-conscious markets. Creamer logistics analytics optimize distribution, while coffee creamer benchmarks highlight leaders like Nestlé. Sustainable creamer sourcing aligns with eco-friendly coffee trends. Creamer regulations 2025-2029 steer creamer demand in North America 2025. Premium creamer products and coffee creamer trend forecasts drive expansion. Creamers for office pantries and custom creamer blends target niches. Coffee creamer hurdles and innovations address flavor consistency, with creamer supplier networks and creamer cost optimization tactics enhancing profitability. Coffee creamer market insights and plant-based beverage breakthroughs fuel momentum.
What are the key market drivers leading to the rise in the adoption of Coffee Creamer Industry?
- The increasing significance of online retailing serves as the primary market driver. The market is witnessing significant growth due to the increasing demand for convenience and the shift towards e-commerce sales channels. Supply chain management plays a crucial role in ensuring the timely delivery of refrigerated creamers, sugar-free options, and various other types, including oat, flavored, and cashew creamers, to both convenience stores and export markets. Regulatory compliance is a key consideration for market players, with nutritional labeling and quality control being essential factors. Consumer preferences for different creamer types continue to evolve, with a growing trend towards plant-based and sugar-free alternatives.
- E-commerce platforms, such as Amazon and eBay, are driving market growth by offering a wide range of coffee creamers from various brands to both B2C and B2B customers. The increasing popularity of online retailing, particularly in developing countries, is expected to further boost sales during the forecast period.
What are the market trends shaping the Coffee Creamer Industry?
- The clean label movement is gaining significant traction in the market, with a growing number of consumers preferring products with simple, recognizable ingredients.
- The market is experiencing significant growth due to increasing consumer preference for clean-label products. With a growing consciousness towards health and wellness, consumers are seeking coffee creamers with simple, pure, and easily understandable ingredient lists. This trend is propelling the market forward as manufacturers respond by introducing new clean-label creamer options. Government regulations are also playing a crucial role in market growth. Strict food safety regulations mandate clearer labels, ensuring transparency and consumer trust. In the US, the Food and Drug Administration (FDA) sets the guidelines for food manufacturers. In Europe, the European Food Safety Authority (EFSA) establishes the rules and regulations.
- These regulatory bodies aim to maintain high standards for food products, including coffee creamers, ensuring consumer safety and satisfaction. The market is witnessing innovation as manufacturers focus on creating new flavors and catering to diverse consumer preferences. The market is expected to continue its growth trajectory, driven by consumer demand and regulatory requirements.
What challenges does the Coffee Creamer Industry face during its growth?
- The industry's expansion is constrained by the combined challenges of elevated raw material costs and insufficient in-house production capacity.
- Coffee creamer production relies on a consistent supply of various raw materials, including milk, butter, nuts, and sweeteners, for plant-based, premium dairy, vegan, and non-dairy options. The prices of these essential ingredients can be influenced by weather conditions, economic factors, and other market dynamics. Therefore, it is crucial for manufacturers to closely monitor global supply and cost trends to ensure the acquisition of necessary ingredients and packaging. Primary raw materials are typically sourced from external suppliers. In the US market, coffee shops, grocery stores, retail channels, import markets, and online retail platforms cater to both home consumption and wholesale distribution.
- Product differentiation, such as unsweetened and almond creamers, adds to the market's diversity. Brand loyalty plays a significant role in consumer preferences, making it essential for manufacturers to maintain high-quality standards and innovative offerings.
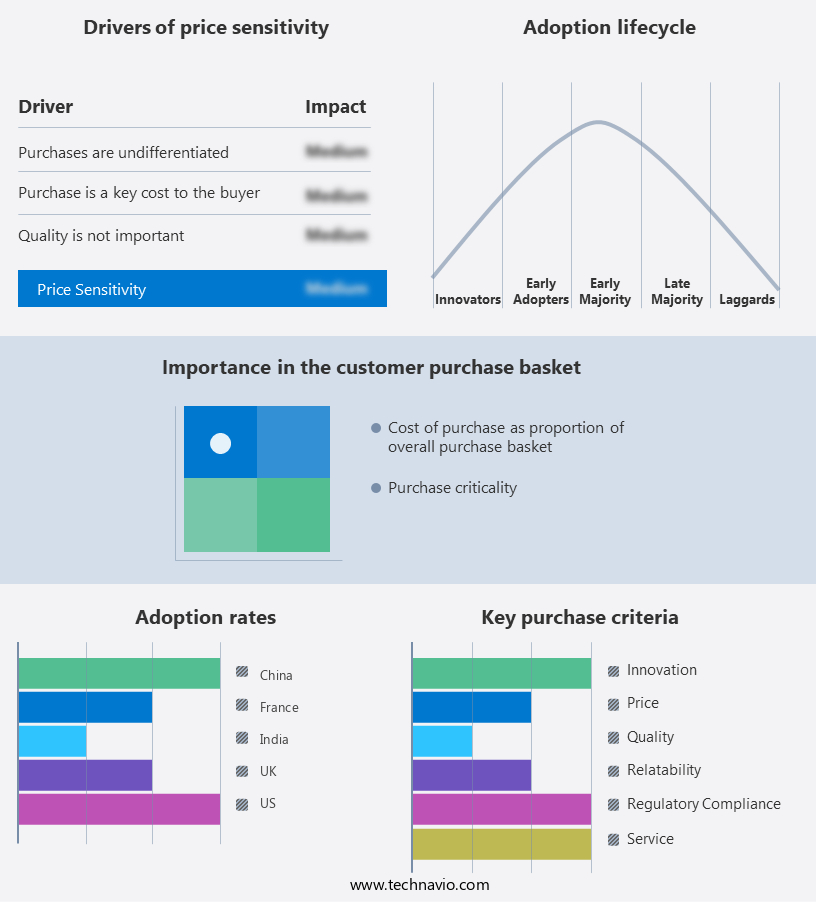
Exclusive Customer Landscape
The coffee creamer market forecasting report includes the adoption lifecycle of the market, covering from the innovator's stage to the laggard's stage. It focuses on adoption rates in different regions based on penetration. Furthermore, the coffee creamer market report also includes key purchase criteria and drivers of price sensitivity to help companies evaluate and develop their market growth analysis strategies.
Customer Landscape
Key Companies & Market Insights
Companies are implementing various strategies, such as strategic alliances, coffee creamer market forecast, partnerships, mergers and acquisitions, geographical expansion, and product/service launches, to enhance their presence in the industry.
ALMER Malaysia SDN BHD - This company specializes in the production and distribution of coffee creamers, including Satro Creamer and Caprimo Topping Creamer, catering to diverse consumer preferences with a focus on quality and innovation. These dairy-based creamers enhance the taste and texture of beverages, offering consumers a superior coffee experience.
The industry research and growth report includes detailed analyses of the competitive landscape of the market and information about key companies, including:
- ALMER Malaysia SDN BHD
- Barry Callebaut AG
- Cafea GmbH
- Califia Farms LLC
- Chobani Global Holdings LLC
- Custom Food Group
- Danone SA
- DreamPak LLC
- Fujian Jumbo Grand Food Co. Ltd.
- Hiland Dairy
- Inspire Brands Inc.
- Jiangxi Weierbao Food Biological Co. Ltd.
- Laird Superfood Inc.
- Nestle SA
- nutpods Dairy Free Creamer
- Royal FrieslandCampina NV
- TURM Sahne GmbH
- Viceroy Holland BV
- Wenhui Food Industry Co. Ltd.
- WhiteWave Services Inc.
Qualitative and quantitative analysis of companies has been conducted to help clients understand the wider business environment as well as the strengths and weaknesses of key industry players. Data is qualitatively analyzed to categorize companies as pure play, category-focused, industry-focused, and diversified; it is quantitatively analyzed to categorize companies as dominant, leading, strong, tentative, and weak.
Recent Development and News in Coffee Creamer Market
- In January 2024, Nestlé, a leading global food and beverage company, announced the launch of its new plant-based Nesquik Gold Almond Creamer in the United States. This addition to their coffee creamer portfolio catered to the growing demand for dairy-free alternatives (Nestlé Press Release, 2024).
- In March 2024, Danone, a major player in the market, entered into a strategic partnership with Blue Diamond Growers, a leading almond cooperative, to develop innovative dairy-free coffee creamers using almond milk. This collaboration aimed to strengthen Danone's position in the plant-based market (Danone Press Release, 2024).
- In May 2024, The Kraft Heinz Company, a prominent food and beverage manufacturer, completed the acquisition of Prabhat Dairy, a leading Indian dairy and coffee creamer producer, for approximately USD300 million. This acquisition expanded Kraft Heinz's presence in the rapidly growing Indian market (Business Wire, 2024).
- In January 2025, Starbucks Corporation, the world's largest coffeehouse chain, received regulatory approval from the European Commission to acquire a 50% stake in Elisabeta Mocanu SRL, a Romanian dairy company. This strategic move aimed to strengthen Starbucks' control over its coffee creamer supply chain in Europe (Starbucks Press Release, 2025).
Research Analyst Overview
- The market encompasses various product offerings, including concentrated creamers and frozen creamers, which cater to diverse consumer preferences in coffee preparation. Agricultural practices significantly influence ingredient quality, as ethical sourcing and environmental impact gain prominence. Waste reduction is a key trend, with packaging waste and carbon footprint becoming crucial considerations. The dairy industry faces competition from plant-based milk and dairy alternatives, necessitating new product development and sales promotion strategies. Coffee acidity and bitterness are addressed through creamer blends and additives, while food science and technology advancements contribute to sensory analysis and flavor profiles.
- The International Coffee Association monitors consumer behavior, identifying trends and preferences in coffee culture. The product life cycle management of creamers involves supply chain optimization and sustainability initiatives to meet evolving market demands.
Dive into Technavio's robust research methodology, blending expert interviews, extensive data synthesis, and validated models for unparalleled Coffee Creamer Market insights. See full methodology.
|
Market Scope |
|
|
Report Coverage |
Details |
|
Page number |
245 |
|
Base year |
2024 |
|
Historic period |
2019-2023 |
|
Forecast period |
2025-2029 |
|
Growth momentum & CAGR |
Accelerate at a CAGR of 4.3% |
|
Market growth 2025-2029 |
USD 2875.5 million |
|
Market structure |
Fragmented |
|
YoY growth 2024-2025(%) |
4.1 |
|
Key countries |
US, UK, France, Canada, Brazil, India, Germany, Italy, China, and Japan |
|
Competitive landscape |
Leading Companies, Market Positioning of Companies, Competitive Strategies, and Industry Risks |
What are the Key Data Covered in this Coffee Creamer Market Research and Growth Report?
- CAGR of the Coffee Creamer industry during the forecast period
- Detailed information on factors that will drive the growth and forecasting between 2025 and 2029
- Precise estimation of the size of the market and its contribution of the industry in focus to the parent market
- Accurate predictions about upcoming growth and trends and changes in consumer behaviour
- Growth of the market across North America, Europe, APAC, South America, and Middle East and Africa
- Thorough analysis of the market's competitive landscape and detailed information about companies
- Comprehensive analysis of factors that will challenge the coffee creamer market growth of industry companies
We can help! Our analysts can customize this coffee creamer market research report to meet your requirements.
 RIA -
RIA - 
