Offshore Structural Analysis Software Market Analysis North America, Middle East and Africa, Europe, APAC, South America - US, Saudi Arabia, Russia, China, Canada - Size and Forecast 2024-2028

Offshore Structural Analysis Software Market Analysis North America, Middle East and Africa, Europe, APAC, South America - US, Saudi Arabia, Russia, China, Canada - Size and Forecast 2024-2028

Published: Jun 2024 156 Pages SKU: IRTNTR73008

Market Overview at a Glance

$542.5 Mn
Market Opportunity
10.03%
CAGR
8.88
YoY growth 2023-2024(%)

Offshore Structural Analysis Software Market Size 2024-2028 

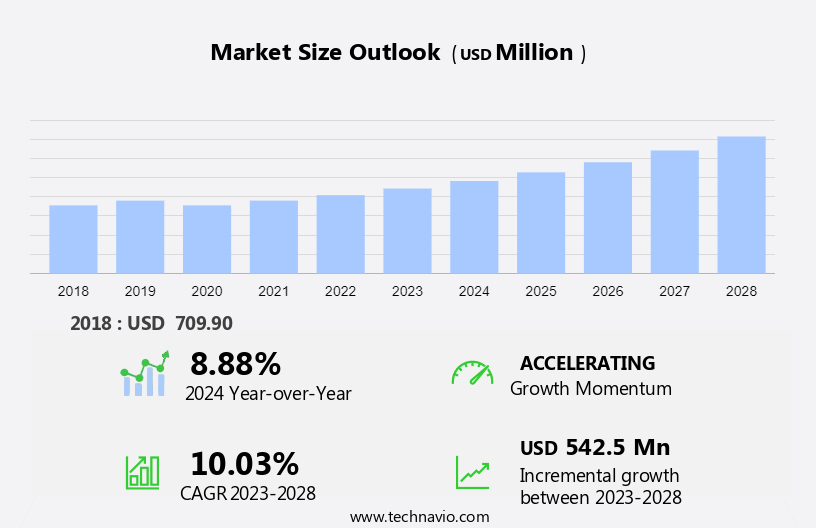
The offshore structural analysis software market size is forecast to increase by USD 542.5 million at a CAGR of 10.03% between 2023 and 2028. The offshore structural analysis market is experiencing significant growth due to the increasing demand from the oil and gas industry for the design and analysis of offshore structures, such as subsea protecting structures and platforms. A key trend in this market is the adoption of cloud computing technology, which enables remote access to analysis tools and data, increasing efficiency and reducing costs. However, the lack of workers with digital skills poses a challenge to market growth, as these specialized skills are required to effectively utilize advanced analysis software. Technical development in the field of offshore engineering is also driving market expansion, as new materials and design techniques are continually being explored to improve the safety and durability of offshore structures. Investment in this market is expected to continue, as the importance of reliable and efficient offshore infrastructure becomes increasingly apparent.

What will be the Size of the Market During the Forecast Period?

Offshore Structural Analysis Software Market Size

 Request Free Sample

The market is a critical sector that caters to the analysis and design of offshore structures used in various industries such as marine, oil and gas, power generation, government and defense, and environmental loads. Architects, engineers, and end customers rely on these software solutions to ensure the structural integrity of offshore structures, including subsea platforms, in extreme weather conditions and under physical space constraints. Offshore structures are essential infrastructures that require precise analysis to protect them from various loads, including environmental loads and nonlinear structural analysis. The software market for offshore structural analysis plays a pivotal role in predicting the performance of these structures under different conditions.

Moreover, cloud-based computing has revolutionized the market, enabling architects and engineers to access critical environmental loads information from remote locations. This technology allows for real-time analysis, improving efficiency and reducing the need for on-site visits by ground-level workers. The initial investment in offshore structural analysis software can be substantial, but the long-term benefits far outweigh the costs. These benefits include improved safety, increased operational efficiency, and reduced maintenance costs. Additionally, the software enables the prediction of structural failure, allowing for proactive measures to be taken to prevent costly repairs or even catastrophic events. The market is a dynamic and evolving sector that caters to the unique needs of various industries.

Furthermore, the software solutions are designed to handle the complexities of offshore structures, including those used in the maritime industry, defense, and power generation. The market plays a vital role in ensuring the safety and efficiency of offshore structures used in various industries. The market offers advanced software solutions that enable architects, engineers, and end customers to analyze and predict the performance of these structures under extreme weather conditions, physical space constraints, and various loads. The adoption of cloud-based computing has further enhanced the capabilities of these software solutions, making them an essential tool for optimizing offshore infrastructure.

Market Segmentation

The market research report provides comprehensive data (region-wise segment analysis), with forecasts and estimates in "USD million" for the period 2024-2028, as well as historical data from 2018-2022 for the following segments.
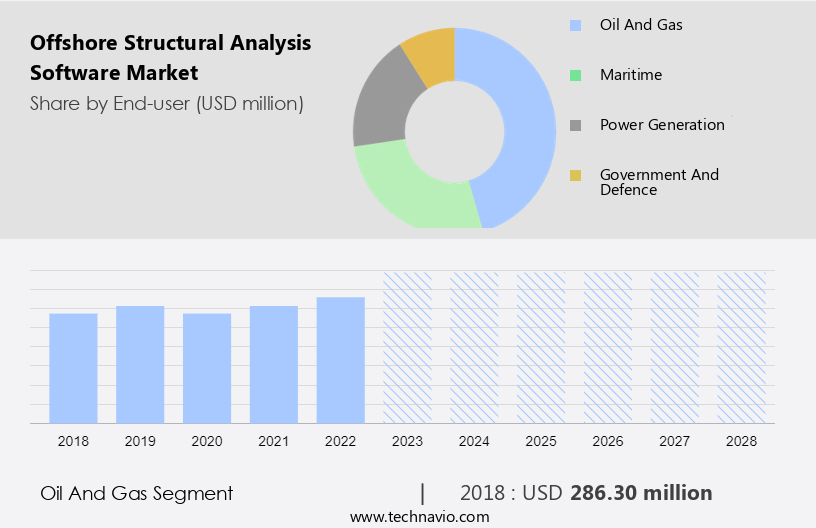
  • End-user
    • Oil and gas
    • Maritime
    • Power generation
    • Government and defence
  • Geography
    • North America
      • Canada
      • US
    • Middle East and Africa
    • Europe
    • APAC
      • China
    • South America

By End-user Insights

The oil and gas segment is estimated to witness significant growth during the forecast period. Offshore structural analysis software plays a crucial role in the design, construction, and maintenance of offshore structures in the oil and gas industry. These structures, which include drilling platforms and subsea protecting structures, are essential for exploring, extracting, storing, and processing petroleum and natural gas found beneath the seabed. The use of offshore structural analysis software offers numerous benefits, including the ability to simulate various physical conditions and assess the strength and optimization of structures throughout their entire lifecycle.

Moreover, the software is particularly valuable in deep-water floating systems, where it enables the analysis of moorings and risers, subsea umbilical systems, deep-water installations, and the coupling effects in mooring. This leads to enhanced safety and performance, ensuring the longevity and efficiency of these critical offshore structures. The investment in offshore structural analysis software is a strategic decision for architects and engineers involved in offshore projects. The software's technical development provides a comprehensive multiphysics simulation platform, addressing all design requirements for offshore structures. By implementing this software, organizations can minimize risks, reduce costs, and ensure regulatory compliance, making it an indispensable tool for the oil and gas industry.

Offshore Structural Analysis Software Market Size

Get a glance at the market share of various segments Request Free Sample

The oil and gas segment accounted for USD 286.30 million in 2018 and showed a gradual increase during the forecast period.

Regional Insights

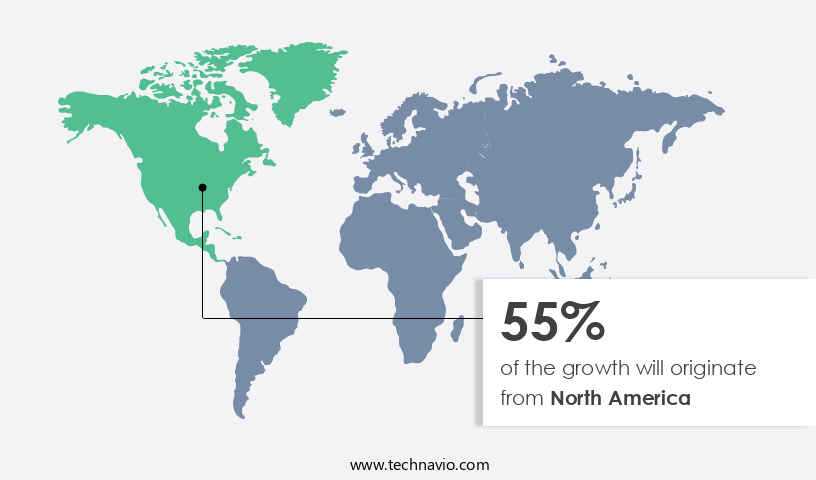
North America is estimated to contribute 55% to the growth of the global market during the forecast period. Technavio's analysts have elaborately explained the regional trends and drivers that shape the market during the forecast period.

Offshore Structural Analysis Software Market Share by Geography

For more insights on the market share of various regions Request Free Sample

In North America, the adoption of offshore structural analysis software is prominent due to the rising popularity of cloud-based solutions. This shift towards cloud-based services has significantly decreased the expenses related to on-premises offshore structural analysis software, making it an attractive option for businesses. The increasing demand for offshore structural analysis software in this region is driving several companies to enter the market. The expanding offshore oil and gas industry in North America is the primary reason for this trend, which is expected to continue throughout the forecast period. Companies are increasingly relying on deployment services, managed services, and professional services to optimize their offshore operations and enhance power production efficiency. The use of cloud-based software enables easier access to real-time data and analysis, allowing for more informed decision-making and improved operational performance.

Our researchers analyzed the data with 2023 as the base year, along with the key drivers, trends, and challenges. A holistic analysis of drivers will help companies refine their marketing strategies to gain a competitive advantage.

Market Driver

Increasing demand from the oil and gas industry is the key driver of the market. The global market for offshore structural analysis software is experiencing significant growth due to its increasing application in the oil and gas sector. The oil and gas industry's expansion is driven by the growing global economy, as indicated by the International Monetary Fund's (IMF) projection of a 5.9% global economic growth rate in 2021, with all regions expected to perform well in 2022. With strong economies consuming more oil resources, there is a subsequent rise in oil and gas consumption worldwide.

Moreover, emerging economies, such as China and India, are projected to account for almost half of the total global oil demand by 2026. Offshore structural analysis software plays a crucial role in ensuring financial performance and protecting structures from environmental loads information on subsea platforms. Ground-level workers rely on this software for performance prediction, which is essential for maintaining the safety and efficiency of offshore operations. An initial investment in offshore structural analysis software can yield substantial long-term benefits for companies operating in the oil and gas industry.

Market Trends

Advent of cloud computing technology in offshore structural analysis is the upcoming trend in the market. Offshore structures, such as those utilized in marine, oil and gas, power generation, government and defense industries, require sophisticated analysis to withstand environmental loads and ensure structural integrity. Traditional on-premises offshore structural analysis software has given way to cloud-based solutions, which offer increased computing capacity and flexibility.

Furthermore, with cloud computing, customers can access the processing power of multiple high-end machines, enabling them to send models for analysis to the cloud platform while performing pre- and post-processing tasks locally. This allows users to continue working on other tasks until the results are transmitted back, streamlining the analysis process. The adoption of nonlinear structural analysis techniques further enhances the accuracy and reliability of offshore structural analysis, making cloud-based solutions an essential tool for industries that rely on offshore structures.

Market Challenge

The lack of workers with digital skills is a key challenge affecting the market growth. The offshore structural analysis market encounters significant hurdles due to the unique requirements of extreme weather conditions, physical space constraints, and remote locations. End users in this sector demand software solutions that can accurately model and analyze the behavior of offshore structures under various conditions. However, a major challenge lies in securing a workforce with the necessary expertise to effectively utilize offshore structural analysis software. Professionally trained personnel are essential for any organization in this industry. These individuals must be proficient in utilizing digital platforms to construct models, design structures, and evaluate the results of their analyses. The ability to operate connected systems and integrated software applications is crucial for assessing the response of complex offshore structures and vessels.

Furthermore, the shortage of adequately skilled personnel is a significant concern for businesses. To address this issue, companies must invest in training programs and recruitment efforts to attract and retain talented professionals. By doing so, they can ensure they have the human capital needed to harness the full potential of offshore structural analysis software and remain competitive in the market. In conclusion, the offshore structural analysis market faces unique challenges due to the complexities of extreme weather conditions, physical space constraints, and remote locations. Overcoming these challenges requires a workforce with the necessary expertise to effectively utilize offshore structural analysis software. By investing in training and recruitment, organizations can secure the talent needed to drive innovation and success in this sector.

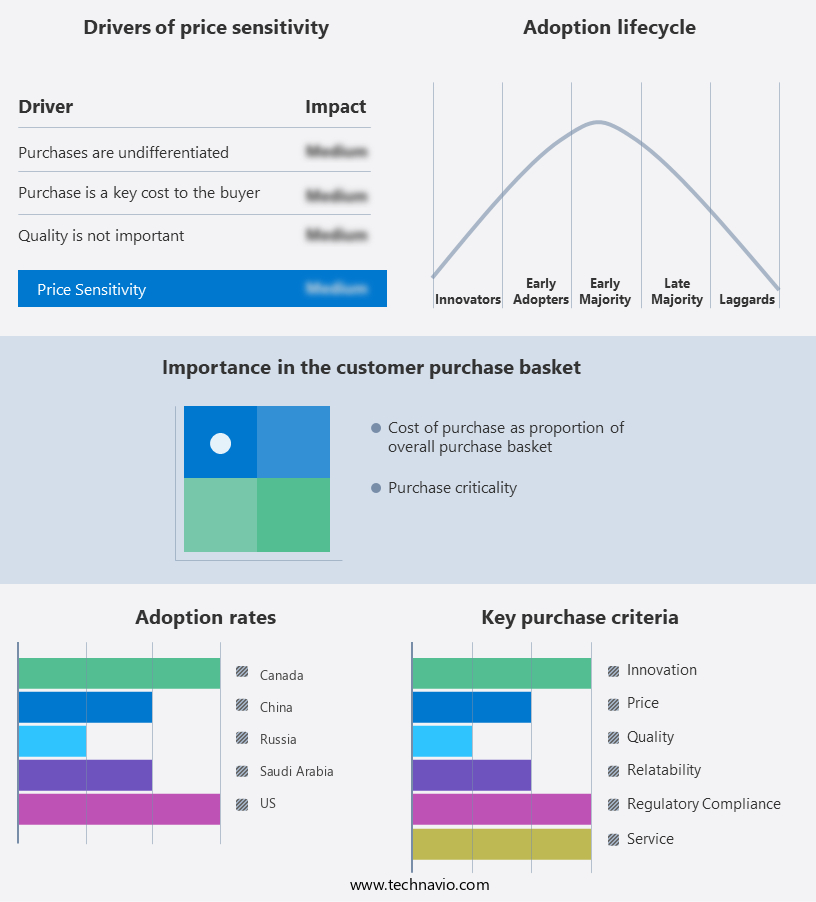
Exclusive Customer Landscape

The market forecasting report includes the adoption lifecycle of the market, covering from the innovator's stage to the laggard's stage. It focuses on adoption rates in different regions based on penetration. Furthermore, the report also includes key purchase criteria and drivers of price sensitivity to help companies evaluate and develop their market growth analysis strategies.

Offshore Structural Analysis Software Market Share by Geography

 Customer Landscape

Key Companies & Market Insights

Companies are implementing various strategies, such as strategic alliances, partnerships, mergers and acquisitions, geographical expansion, and product/service launches, to enhance their presence in the market.

AVL List GmbH - The company offers offshore structural analysis software such as AVL FIRE.

The market research and growth report includes detailed analyses of the competitive landscape of the market and information about key companies, including:

  • Bentley Systems Inc.
  • BMT Group Ltd.
  • Dlubal Software Inc.
  • DNV Group AS
  • Dogtooth Technologies Ltd.
  • Energid Technologies Corp.
  • FFRobotics
  • Harvest CROO Robotics LLC
  • Iron Ox Inc.
  • John Wood Group PLC
  • MetoMotion
  • Panasonic Holdings Corp.
  • Ramboll Group AS
  • Robert Bosch GmbH
  • Stewart Technology Associates
  • Viking Systems Inc.
  • Vision Robotics Corp.
  • Zebec Marine Consultant and Services

Qualitative and quantitative analysis of companies has been conducted to help clients understand the wider business environment as well as the strengths and weaknesses of key market players. Data is qualitatively analyzed to categorize companies as pure play, category-focused, industry-focused, and diversified; it is quantitatively analyzed to categorize companies as dominant, leading, strong, tentative, and weak.

Research Analyst Overview

The market caters to the marine industry, focusing on offshore structures used in oil and gas exploration and production, power generation, government and defense applications. These structures are subjected to various environmental loads, including extreme weather conditions and physical space constraints, necessitating advanced nonlinear structural analysis. Architects and engineers utilize this software to design and analyze offshore platforms, subsea protecting structures, drilling templates, skidding systems, and tension decks. Cloud-based computing and deployment services have gained traction in the market due to their accessibility and cost-effectiveness. Offshore structural analysis software offers cloud-based and on-premise solutions, along with managed services and professional services, catering to end users' varying needs.

Furthermore, the financial performance of these software solutions depends on the initial investment, technical development, and ongoing maintenance expenses. Cloud-based software and on-premise software are revolutionizing non-linear structural analysis in construction, enabling environmentally friendly practices while supporting ground level workers with more efficient and accessible services. End users in the maritime, defense, and power production sectors require accurate performance prediction to ensure the safety and reliability of their offshore structures. The global renewable energy industry is increasingly focused on cost-effective offshore engineering, leveraging cloud based computing and advanced software tools and services to prevent offshore structural failure, reduce investment expense, and support Environmentally friendly construction work. This progress is further driven by the availability of trained and skilled personnel, as well as support from the government and defense industry. Ground-level workers and technical teams leverage these software tools to analyze the structural integrity of offshore structures under various loading conditions, ensuring optimal design and operational efficiency.

Market Scope

Report Coverage

Details

Page number

156

Base year

2023

Historic period

2018-2022

Forecast period

2024-2028

Growth momentum & CAGR

Accelerate at a CAGR of 10.03%

Market growth 2024-2028

USD 542.5 million

Market structure

Fragmented

YoY growth 2023-2024(%)

8.88

Regional analysis

North America, Middle East and Africa, Europe, APAC, and South America

Performing market contribution

North America at 55%

Key countries

US, Saudi Arabia, Russia, China, and Canada

Competitive landscape

Leading Companies, Market Positioning of Companies, Competitive Strategies, and Industry Risks

Key companies profiled

AVL List GmbH, Bentley Systems Inc., BMT Group Ltd., Dlubal Software Inc., DNV Group AS, Dogtooth Technologies Ltd., Energid Technologies Corp., FFRobotics, Harvest CROO Robotics LLC, Iron Ox Inc., John Wood Group PLC, MetoMotion, Panasonic Holdings Corp., Ramboll Group AS, Robert Bosch GmbH, Stewart Technology Associates, Viking Systems Inc., Vision Robotics Corp., and Zebec Marine Consultant and Services

Market dynamics

Parent market analysis, market growth inducers and obstacles, market forecast, fast-growing and slow-growing segment analysis, COVID-19 impact and recovery analysis and future consumer dynamics, market condition analysis for the forecast period

Customization purview

If our market report has not included the data that you are looking for, you can reach out to our analysts and get segments customized.

Request Free Sample

What are the Key Data Covered in this Market Research and Growth Report?

  • CAGR of the market during the forecast period
  • Detailed information on factors that will drive the market growth and forecasting between 2024 and 2028
  • Precise estimation of the size of the market  and its contribution of the market in focus to the parent market
  • Accurate predictions about upcoming market growth and trends and changes in consumer behaviour
  • Growth of the market across North America, Middle East and Africa, Europe, APAC, and South America
  • Thorough analysis of the market's competitive landscape and detailed information about companies
  • Comprehensive analysis of factors that will challenge the growth of market companies

We can help! Our analysts can customize this market research report to meet your requirements. Get in touch

1 Executive Summary

  • 1.1 Market overview
    • Executive Summary - Chart on Market Overview
    • Executive Summary - Data Table on Market Overview
    • Executive Summary - Chart on Global Market Characteristics
    • Executive Summary - Chart on Market by Geography
    • Executive Summary - Chart on Market Segmentation by End-user
    • Executive Summary - Chart on Incremental Growth
    • Executive Summary - Data Table on Incremental Growth
    • Executive Summary - Chart on Company Market Positioning

2 Market Landscape

  • 2.1 Market ecosystem
    • Parent Market
    • Data Table on - Parent Market
  • 2.2 Market characteristics
    • Market characteristics analysis
  • 2.3 Value chain analysis
    • Value Chain Analysis

3 Market Sizing

  • 3.1 Market definition
    • Offerings of companies included in the market definition
  • 3.2 Market segment analysis
    • Market segments
  • 3.3 Market size 2023
    • 3.4 Market outlook: Forecast for 2023-2028
      • Chart on Global - Market size and forecast 2023-2028 ($ million)
      • Data Table on Global - Market size and forecast 2023-2028 ($ million)
      • Chart on Global Market: Year-over-year growth 2023-2028 (%)
      • Data Table on Global Market: Year-over-year growth 2023-2028 (%)

    4 Historic Market Size

    • 4.1 Global Offshore Structural Analysis Software Market 2018 - 2022
      • Historic Market Size - Data Table on Global Offshore Structural Analysis Software Market 2018 - 2022 ($ million)
    • 4.2 End-user segment analysis 2018 - 2022
      • Historic Market Size - End-user Segment 2018 - 2022 ($ million)
    • 4.3 Geography segment analysis 2018 - 2022
      • Historic Market Size - Geography Segment 2018 - 2022 ($ million)
    • 4.4 Country segment analysis 2018 - 2022
      • Historic Market Size - Country Segment 2018 - 2022 ($ million)

    5 Five Forces Analysis

    • 5.1 Five forces summary
      • Five forces analysis - Comparison between 2023 and 2028
    • 5.2 Bargaining power of buyers
      • Bargaining power of buyers - Impact of key factors 2023 and 2028
    • 5.3 Bargaining power of suppliers
      • Bargaining power of suppliers - Impact of key factors in 2023 and 2028
    • 5.4 Threat of new entrants
      • Threat of new entrants - Impact of key factors in 2023 and 2028
    • 5.5 Threat of substitutes
      • Threat of substitutes - Impact of key factors in 2023 and 2028
    • 5.6 Threat of rivalry
      • Threat of rivalry - Impact of key factors in 2023 and 2028
    • 5.7 Market condition
      • Chart on Market condition - Five forces 2023 and 2028

    6 Market Segmentation by End-user

    • 6.1 Market segments
      • Chart on End-user - Market share 2023-2028 (%)
      • Data Table on End-user - Market share 2023-2028 (%)
    • 6.2 Comparison by End-user
      • Chart on Comparison by End-user
      • Data Table on Comparison by End-user
    • 6.3 Oil and gas - Market size and forecast 2023-2028
      • Chart on Oil and gas - Market size and forecast 2023-2028 ($ million)
      • Data Table on Oil and gas - Market size and forecast 2023-2028 ($ million)
      • Chart on Oil and gas - Year-over-year growth 2023-2028 (%)
      • Data Table on Oil and gas - Year-over-year growth 2023-2028 (%)
    • 6.4 Maritime - Market size and forecast 2023-2028
      • Chart on Maritime - Market size and forecast 2023-2028 ($ million)
      • Data Table on Maritime - Market size and forecast 2023-2028 ($ million)
      • Chart on Maritime - Year-over-year growth 2023-2028 (%)
      • Data Table on Maritime - Year-over-year growth 2023-2028 (%)
    • 6.5 Power generation - Market size and forecast 2023-2028
      • Chart on Power generation - Market size and forecast 2023-2028 ($ million)
      • Data Table on Power generation - Market size and forecast 2023-2028 ($ million)
      • Chart on Power generation - Year-over-year growth 2023-2028 (%)
      • Data Table on Power generation - Year-over-year growth 2023-2028 (%)
    • 6.6 Government and defence - Market size and forecast 2023-2028
      • Chart on Government and defence - Market size and forecast 2023-2028 ($ million)
      • Data Table on Government and defence - Market size and forecast 2023-2028 ($ million)
      • Chart on Government and defence - Year-over-year growth 2023-2028 (%)
      • Data Table on Government and defence - Year-over-year growth 2023-2028 (%)
    • 6.7 Market opportunity by End-user
      • Market opportunity by End-user ($ million)
      • Data Table on Market opportunity by End-user ($ million)

    7 Customer Landscape

    • 7.1 Customer landscape overview
      • Analysis of price sensitivity, lifecycle, customer purchase basket, adoption rates, and purchase criteria

    8 Geographic Landscape

    • 8.1 Geographic segmentation
      • Chart on Market share by geography 2023-2028 (%)
      • Data Table on Market share by geography 2023-2028 (%)
    • 8.2 Geographic comparison
      • Chart on Geographic comparison
      • Data Table on Geographic comparison
    • 8.3 North America - Market size and forecast 2023-2028
      • Chart on North America - Market size and forecast 2023-2028 ($ million)
      • Data Table on North America - Market size and forecast 2023-2028 ($ million)
      • Chart on North America - Year-over-year growth 2023-2028 (%)
      • Data Table on North America - Year-over-year growth 2023-2028 (%)
    • 8.4 Middle East and Africa - Market size and forecast 2023-2028
      • Chart on Middle East and Africa - Market size and forecast 2023-2028 ($ million)
      • Data Table on Middle East and Africa - Market size and forecast 2023-2028 ($ million)
      • Chart on Middle East and Africa - Year-over-year growth 2023-2028 (%)
      • Data Table on Middle East and Africa - Year-over-year growth 2023-2028 (%)
    • 8.5 Europe - Market size and forecast 2023-2028
      • Chart on Europe - Market size and forecast 2023-2028 ($ million)
      • Data Table on Europe - Market size and forecast 2023-2028 ($ million)
      • Chart on Europe - Year-over-year growth 2023-2028 (%)
      • Data Table on Europe - Year-over-year growth 2023-2028 (%)
    • 8.6 APAC - Market size and forecast 2023-2028
      • Chart on APAC - Market size and forecast 2023-2028 ($ million)
      • Data Table on APAC - Market size and forecast 2023-2028 ($ million)
      • Chart on APAC - Year-over-year growth 2023-2028 (%)
      • Data Table on APAC - Year-over-year growth 2023-2028 (%)
    • 8.7 South America - Market size and forecast 2023-2028
      • Chart on South America - Market size and forecast 2023-2028 ($ million)
      • Data Table on South America - Market size and forecast 2023-2028 ($ million)
      • Chart on South America - Year-over-year growth 2023-2028 (%)
      • Data Table on South America - Year-over-year growth 2023-2028 (%)
    • 8.8 US - Market size and forecast 2023-2028
      • Chart on US - Market size and forecast 2023-2028 ($ million)
      • Data Table on US - Market size and forecast 2023-2028 ($ million)
      • Chart on US - Year-over-year growth 2023-2028 (%)
      • Data Table on US - Year-over-year growth 2023-2028 (%)
    • 8.9 Russia - Market size and forecast 2023-2028
      • Chart on Russia - Market size and forecast 2023-2028 ($ million)
      • Data Table on Russia - Market size and forecast 2023-2028 ($ million)
      • Chart on Russia - Year-over-year growth 2023-2028 (%)
      • Data Table on Russia - Year-over-year growth 2023-2028 (%)
    • 8.10 Saudi Arabia - Market size and forecast 2023-2028
      • Chart on Saudi Arabia - Market size and forecast 2023-2028 ($ million)
      • Data Table on Saudi Arabia - Market size and forecast 2023-2028 ($ million)
      • Chart on Saudi Arabia - Year-over-year growth 2023-2028 (%)
      • Data Table on Saudi Arabia - Year-over-year growth 2023-2028 (%)
    • 8.11 China - Market size and forecast 2023-2028
      • Chart on China - Market size and forecast 2023-2028 ($ million)
      • Data Table on China - Market size and forecast 2023-2028 ($ million)
      • Chart on China - Year-over-year growth 2023-2028 (%)
      • Data Table on China - Year-over-year growth 2023-2028 (%)
    • 8.12 Canada - Market size and forecast 2023-2028
      • Chart on Canada - Market size and forecast 2023-2028 ($ million)
      • Data Table on Canada - Market size and forecast 2023-2028 ($ million)
      • Chart on Canada - Year-over-year growth 2023-2028 (%)
      • Data Table on Canada - Year-over-year growth 2023-2028 (%)
    • 8.13 Market opportunity by geography
      • Market opportunity by geography ($ million)
      • Data Tables on Market opportunity by geography ($ million)

    9 Drivers, Challenges, and Opportunity/Restraints

    • 9.1 Market drivers
      • 9.2 Market challenges
        • 9.3 Impact of drivers and challenges
          • Impact of drivers and challenges in 2023 and 2028
        • 9.4 Market opportunities/restraints

          10 Competitive Landscape

          • 10.1 Overview
            • 10.2 Competitive Landscape
              • Overview on criticality of inputs and factors of differentiation
            • 10.3 Landscape disruption
              • Overview on factors of disruption
            • 10.4 Industry risks
              • Impact of key risks on business

            11 Competitive Analysis

            • 11.1 Companies profiled
              • Companies covered
            • 11.2 Market positioning of companies
              • Matrix on companies position and classification
            • 11.3 AVL List GmbH
              • AVL List GmbH - Overview
              • AVL List GmbH - Product / Service
              • AVL List GmbH - Key offerings
            • 11.4 Bentley Systems Inc.
              • Bentley Systems Inc. - Overview
              • Bentley Systems Inc. - Product / Service
              • Bentley Systems Inc. - Key news
              • Bentley Systems Inc. - Key offerings
            • 11.5 BMT Group Ltd.
              • BMT Group Ltd. - Overview
              • BMT Group Ltd. - Product / Service
              • BMT Group Ltd. - Key offerings
            • 11.6 Dlubal Software Inc.
              • Dlubal Software Inc. - Overview
              • Dlubal Software Inc. - Product / Service
              • Dlubal Software Inc. - Key offerings
            • 11.7 DNV Group AS
              • DNV Group AS - Overview
              • DNV Group AS - Business segments
              • DNV Group AS - Key news
              • DNV Group AS - Key offerings
              • DNV Group AS - Segment focus
            • 11.8 John Wood Group PLC
              • John Wood Group PLC - Overview
              • John Wood Group PLC - Business segments
              • John Wood Group PLC - Key offerings
              • John Wood Group PLC - Segment focus
            • 11.9 Ramboll Group AS
              • Ramboll Group AS - Overview
              • Ramboll Group AS - Product / Service
              • Ramboll Group AS - Key offerings
            • 11.10 Stewart Technology Associates
              • Stewart Technology Associates - Overview
              • Stewart Technology Associates - Product / Service
              • Stewart Technology Associates - Key offerings
            • 11.11 Viking Systems Inc.
              • Viking Systems Inc. - Overview
              • Viking Systems Inc. - Product / Service
              • Viking Systems Inc. - Key offerings
            • 11.12 Zebec Marine Consultant and Services
              • Zebec Marine Consultant and Services - Overview
              • Zebec Marine Consultant and Services - Product / Service
              • Zebec Marine Consultant and Services - Key offerings

            12 Appendix

            • 12.1 Scope of the report
              • 12.2 Inclusions and exclusions checklist
                • Inclusions checklist
                • Exclusions checklist
              • 12.3 Currency conversion rates for US$
                • Currency conversion rates for US$
              • 12.4 Research methodology
                • Research methodology
              • 12.5 Data procurement
                • Information sources
              • 12.6 Data validation
                • Data validation
              • 12.7 Validation techniques employed for market sizing
                • Validation techniques employed for market sizing
              • 12.8 Data synthesis
                • Data synthesis
              • 12.9 360 degree market analysis
                • 360 degree market analysis
              • 12.10 List of abbreviations
                • List of abbreviations

              Research Methodology

              Technavio presents a detailed picture of the market by way of study, synthesis, and summation of data from multiple sources. The analysts have presented the various facets of the market with a particular focus on identifying the key industry influencers. The data thus presented is comprehensive, reliable, and the result of extensive research, both primary and secondary.

              INFORMATION SOURCES

              Primary sources

              • Manufacturers and suppliers
              • Channel partners
              • Industry experts
              • Strategic decision makers

              Secondary sources

              • Industry journals and periodicals
              • Government data
              • Financial reports of key industry players
              • Historical data
              • Press releases

              DATA ANALYSIS

              Data Synthesis

              • Collation of data
              • Estimation of key figures
              • Analysis of derived insights

              Data Validation

              • Triangulation with data models
              • Reference against proprietary databases
              • Corroboration with industry experts

              REPORT WRITING

              Qualitative

              • Market drivers
              • Market challenges
              • Market trends
              • Five forces analysis

              Quantitative

              • Market size and forecast
              • Market segmentation
              • Geographical insights
              • Competitive landscape

              Interested in this report?

              Get your sample now to see our research methodology and insights!

              Download Now

              Frequently Asked Questions

              Offshore Structural Analysis Software market growth will increase by $ 542.5 mn during 2024-2028 .

              The Offshore Structural Analysis Software market is expected to grow at a CAGR of 10.03% during 2024-2028 .

              Offshore Structural Analysis Software market is segmented by End-user( Oil and gas, Maritime, Power generation, Government and defence)

              AVL List GmbH, Bentley Systems Inc., BMT Group Ltd., Dlubal Software Inc., DNV Group AS, Dogtooth Technologies Ltd., Energid Technologies Corp., FFRobotics, Harvest CROO Robotics LLC, Iron Ox Inc., John Wood Group PLC, MetoMotion, Panasonic Holdings Corp., Ramboll Group AS, Robert Bosch GmbH, Stewart Technology Associates, Viking Systems Inc., Vision Robotics Corp., Zebec Marine Consultant and Services are a few of the key vendors in the Offshore Structural Analysis Software market.

              North America will register the highest growth rate of 55% among the other regions. Therefore, the Offshore Structural Analysis Software market in North America is expected to garner significant business opportunities for the vendors during the forecast period.

              US, Saudi Arabia, Russia, China, Canada

              • Increasing demand from the oil and gas industryThe global offshore structural analysis software market is gaining considerable traction across the globe due to its increasing demand from the oil and gas industry. The oil and gas industry is witnessing rapid growth due to the growing world economy. According to The International Monetary Fund (IMF) is the driving factor this market.
              • global economic growth was 5.9% in 2021 is the driving factor this market.
              • and all the regions are expected to perform well in 2022. Strong economies will is the driving factor this market.
              • in turn is the driving factor this market.
              • use more oil resources and thereby is the driving factor this market.
              • resulting in increased oil and gas consumption globally. Further is the driving factor this market.
              • emerging economies is the driving factor this market.
              • such as China and India together is the driving factor this market.
              • are expected to contribute nearly 50% of total global oil demand by 2026. With the oil and gas industry growing at a rapid pace is the driving factor this market.
              • offshore structural analysis software is being widely used in the industry for designing is the driving factor this market.
              • modeling is the driving factor this market.
              • and analyzing complex offshore platform structures. As these structures represent a major capital investment in offshore oil and gas production is the driving factor this market.
              • the use of software to improve the performance and efficiency of these structures is estimated to be a key driver for the market. The increasing transparency in the value chain and efficiency in the use of software in the global oil and gas industry will be a key differentiator for this industry in its competition against the global renewable energy industry. Using advanced finite element analysis tools is the driving factor this market.
              • operators in the oil and gas industry can design and analyze complex offshore structural systems that have proper compliance with global and regional industry design standards and codes. This integrated structural modeling is the driving factor this market.
              • analysis is the driving factor this market.
              • and simulation environment helps in the designing of efficient offshore oil and gas production structures. This enables these structures to effectively operate at high standards and withstand the effect of local weather conditions is the driving factor this market.
              • including unfavorable sea waves is the driving factor this market.
              • winds is the driving factor this market.
              • and seismic loads. With the emergence of smart oil rigs is the driving factor this market.
              • the heterogeneous and highly complex design requirements of offshore oil and gas platforms and associated structures are expected to drive the demand for offshore structural analysis software for the analysis of all operating loads and constraints. Offshore structural analysis software helps ensure that offshore structures meet all the operating conditions with regard to their safety and integrity during the life of the asset. Designing is the driving factor this market.
              • analyzing is the driving factor this market.
              • and then simulating the working conditions and characteristics of structural models can improve and optimize the structural design to ensure overall engineering integrity. The integration of tools with offshore structural analysis software enables to create and check structural models is the driving factor this market.
              • by combining wind and gravity load analysis to ensure design code compliance. Thus is the driving factor this market.
              • the growing oil and gas industry is driving the global offshore structural analysis software market during the forecast period. is the driving factor this market.

              The Offshore Structural Analysis Software market vendors should focus on grabbing business opportunities from the Oil and gas segment as it accounted for the largest market share in the base year.