Oil And Gas Fishing Market Analysis, Size, and Forecast 2026-2030: North America (US, Canada, and Mexico), APAC (China, India, and Australia), Europe (UK, The Netherlands, and Germany), Middle East and Africa (Saudi Arabia and UAE), South America (Brazil and Argentina), and Rest of World (ROW)

Oil And Gas Fishing Market Analysis, Size, and Forecast 2026-2030:
North America (US, Canada, and Mexico), APAC (China, India, and Australia), Europe (UK, The Netherlands, and Germany), Middle East and Africa (Saudi Arabia and UAE), South America (Brazil and Argentina), and Rest of World (ROW)

Published: Mar 2026 291 Pages SKU: IRTNTR40324

Market Overview at a Glance

$2.44 B
Market Opportunity
6.5%
CAGR 2025 - 2030
41.4%
North America Growth
$5.17 B
Onshore segment 2024

Oil And Gas Fishing Market Size 2026-2030

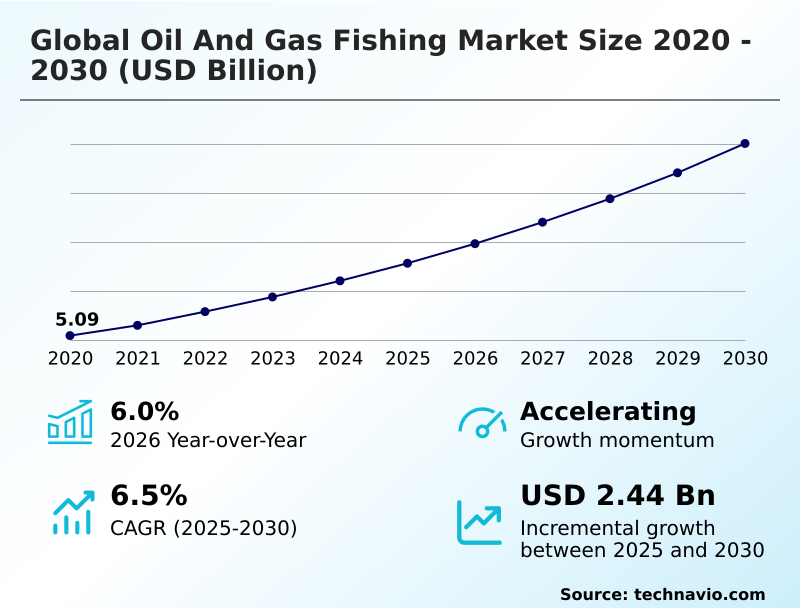
The oil and gas fishing market size is valued to increase by USD 2.44 billion, at a CAGR of 6.5% from 2025 to 2030. Escalating global crude oil demand will drive the oil and gas fishing market.

Major Market Trends & Insights

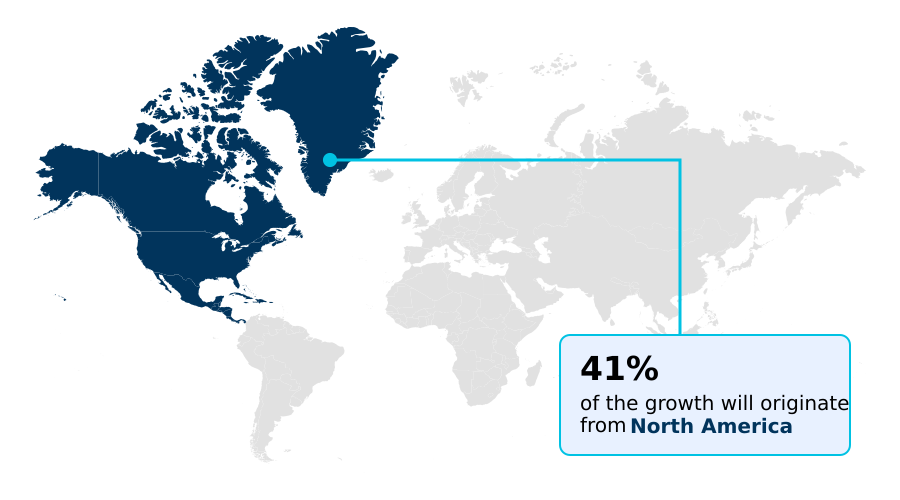
  • North America dominated the market and accounted for a 41.4% growth during the forecast period.
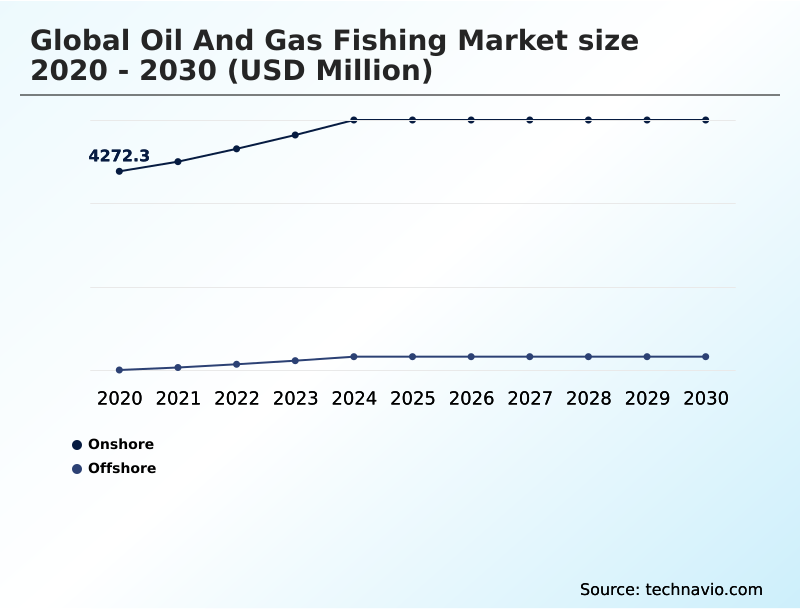
  • By Application - Onshore segment was valued at USD 5.17 billion in 2024
  • By Product - Casing cutters segment accounted for the largest market revenue share in 2024

Market Size & Forecast

  • Market Opportunities: USD 3.93 billion
  • Market Future Opportunities: USD 2.44 billion
  • CAGR from 2025 to 2030 : 6.5%

Market Summary

  • The oil and gas fishing market is defined by the critical need to retrieve lost or stuck equipment from wellbores to ensure operational continuity and asset integrity. Growth is fueled by intensifying drilling activities in complex environments and the rising number of aging wells requiring intervention.
  • Key trends include the integration of real-time downhole telemetry and smart sensor-enabled tools, which enhance retrieval precision and reduce costly non-productive time. For instance, an operator facing a stuck pipe scenario in a deepwater well can leverage ultrasonic imaging to diagnose the obstruction's nature and position, allowing for the deployment of a specific high-speed diamond-enhanced mill.
  • This data-driven approach, a shift from traditional trial-and-error methods, optimizes the recovery process, minimizes risk, and maintains wellbore integrity. However, the market grapples with challenges such as a shortage of skilled labor for advanced systems and the high R&D costs associated with developing reliable tools for high-pressure, high-temperature conditions.
  • These dynamics push service providers toward offering integrated, technology-driven solutions for wellbore remediation and intervention.

What will be the Size of the Oil And Gas Fishing Market during the forecast period?

Get Key Insights on Market Forecast (PDF) Request Free Sample

How is the Oil And Gas Fishing Market Segmented?

The oil and gas fishing industry research report provides comprehensive data (region-wise segment analysis), with forecasts and estimates in "USD million" for the period 2026-2030, as well as historical data from 2020-2024 for the following segments.

  • Application
    • Onshore
    • Offshore
  • Product
    • Casing cutters
    • Milling tools
    • Overshoots and spears
    • Fishing jars
  • Type
    • Fishing tools
    • Fishing services
    • Rental services
  • Geography
    • North America
      • US
      • Canada
      • Mexico
    • APAC
      • China
      • India
      • Australia
    • Europe
      • UK
      • The Netherlands
      • Germany
    • Middle East and Africa
      • Saudi Arabia
      • UAE
    • South America
      • Brazil
      • Argentina
    • Rest of World (ROW)

By Application Insights

The onshore segment is estimated to witness significant growth during the forecast period.

The onshore segment is pivotal, driven by unconventional resource extraction and the maintenance of mature land-based fields. Operations in high-volume regions rely on minimizing downtime, necessitating specialized well intervention and stuck pipe retrieval.

Horizontal drilling and multi-stage fracturing introduce new complexities, increasing the risk of tool detachment and requiring advanced fishing tool rental services and wellbore remediation.

Navigating lateral sections demands precise downhole obstruction removal and the use of tools like hydraulic jars and power swivels. Effective well integrity management and proactive wellbore maintenance are critical for economic feasibility.

Implementing adaptive fishing techniques has demonstrated an ability to reduce non-productive time by over 15% in complex onshore fishing operations, optimizing cost-effective recovery methods and decommissioning support services.

Request Free Sample

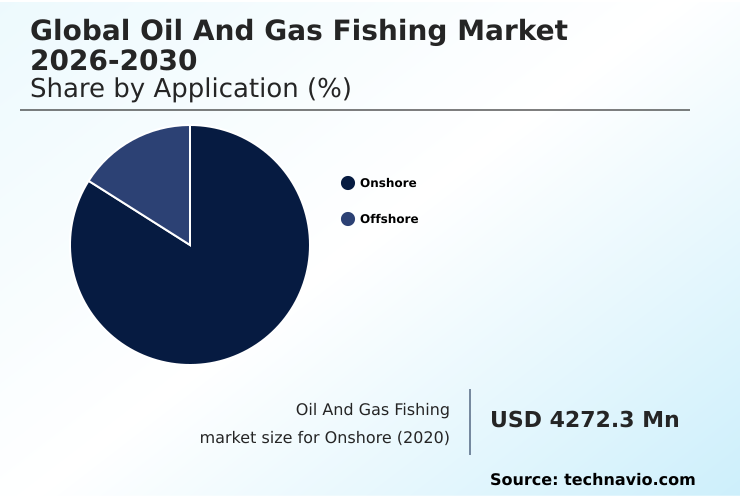
The Onshore segment was valued at USD 5.17 billion in 2024 and showed a gradual increase during the forecast period.

Request Free Sample

Regional Analysis

North America is estimated to contribute 41.4% to the growth of the global market during the forecast period.Technavio’s analysts have elaborately explained the regional trends and drivers that shape the market during the forecast period.

See How Oil And Gas Fishing Market Demand is Rising in North America Request Free Sample

The global oil and gas fishing market exhibits significant regional disparities in demand and technological adoption.

North America, representing over 41% of the market opportunity, is driven by complex unconventional drilling, where autonomous fishing tools and robotic well intervention are increasingly crucial.

In this region, advanced directional drilling tools and coiled tubing services have improved retrieval success in long lateral wells by 20%.

In contrast, the Middle East and Africa focus on maintaining production from vast, mature fields, requiring robust well abandonment services and tubular running services.

APAC, contributing nearly 30% of the incremental growth, is characterized by deepwater exploration, demanding sophisticated subsea intervention and high-pressure high-temperature (HPHT) tools. Europe's market is primarily centered on decommissioning, utilizing advanced casing cutters and wellbore cleanup solutions.

Market Dynamics

Our researchers analyzed the data with 2025 as the base year, along with the key drivers, trends, and challenges. A holistic analysis of drivers will help companies refine their marketing strategies to gain a competitive advantage.

  • The evolution of the global oil and gas fishing market is increasingly defined by niche, high-value applications that address specific operational pain points. Optimizing fishing BHA for deviated wells and managing fishing risks in unconventional shale plays are now standard practice, moving beyond generic retrieval services.
  • The use of advanced fishing tools for deepwater environments is critical, where subsea fishing operations using ROV support have become indispensable. A key development is the use of ultrasonic imaging for fish identification and recovery, which complements real-time monitoring in fishing operations to improve first-run success rates.
  • For instance, in complex scenarios, this approach has been shown to reduce diagnostic time by up to 50% compared to traditional methods. Furthermore, operators are demanding specialized milling tools for composite plugs and casing exit strategies using advanced whipstocks to enable sidetracking.
  • The market is also seeing growth in thru-tubing fishing for live well intervention and techniques to address coiled tubing failures. Solutions for well integrity restoration after a fishing job, including well abandonment fishing and casing cutting, are vital for end-of-life asset management.
  • The focus is shifting toward improving success rates with hydraulic fishing jars and integrating data analytics for predictive fishing to reduce non-productive time with smart fishing tools, especially when retrieving lost tools in long-reach laterals or working in corrosive environments.

What are the key market drivers leading to the rise in the adoption of Oil And Gas Fishing Industry?

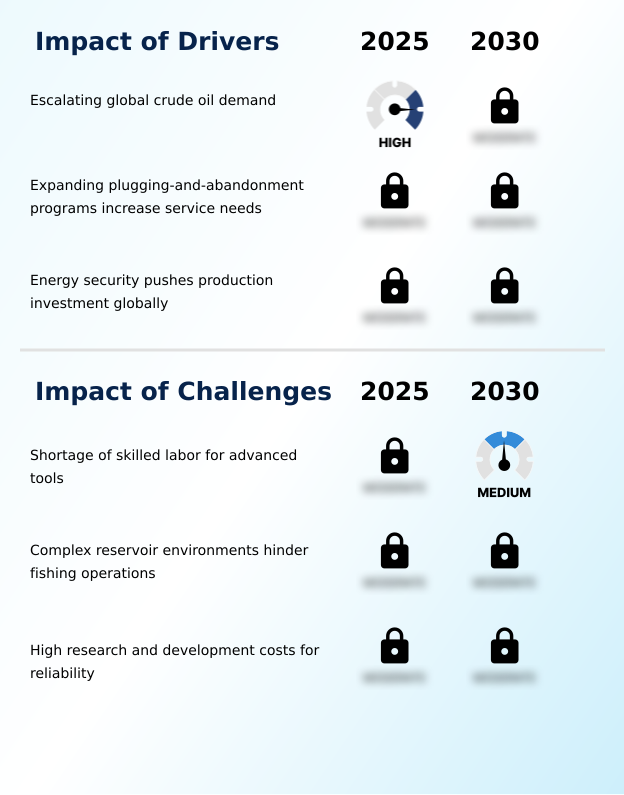
  • Escalating global demand for crude oil is a primary driver influencing exploration and production activities, thereby fueling the need for well intervention and fishing services.

  • Market growth is underpinned by fundamental industry drivers, including rising energy demand and the need for stringent well integrity. Escalating drilling and production activities directly increase the probability of downhole incidents, fueling demand for wellbore remediation and specialized recovery solutions.
  • Expanding plugging and abandonment (P&A) programs in mature basins are projected to increase service demand by 15%, creating significant opportunities for fishing bottom hole assembly (BHA) providers.
  • Moreover, the global focus on energy security accelerates exploration in challenging environments, where cost-effective recovery methods are paramount.
  • This sustained activity ensures a continuous need for fishing tool rental services and expert support for subsea well intervention, reinforcing the market's role in optimizing asset lifecycles and ensuring operational safety.

What are the market trends shaping the Oil And Gas Fishing Industry?

  • The adoption of automation, complemented by real-time downhole telemetry, is an emerging trend. This innovation is reshaping operational efficiency and safety in complex well environments.

  • Key trends are reshaping the market, with a strong emphasis on technology-driven efficiency. The adoption of smart sensor-enabled tools provides real-time downhole diagnostics, improving the success rate of stuck component retrieval by over 25% on the first attempt. This integration of downhole tool performance monitoring and remote fishing operations enables faster, more informed decision-making.
  • Furthermore, the use of data analytics for wellbore obstruction diagnosis can predict potential complications with up to 40% greater accuracy, allowing for proactive well intervention planning. This shift supports the growing demand for specialized fishing services expertise and advanced retrieval systems, moving the industry toward more predictive and less reactive operational models.
  • Fishing tool deployment is now more precise, enhancing overall safety and reducing costs associated with prolonged downtime in deepwater and unconventional resource plays.

What challenges does the Oil And Gas Fishing Industry face during its growth?

  • A key challenge affecting industry growth is the persistent shortage of skilled labor capable of operating and maintaining advanced fishing tools and technologies.

  • The market faces significant operational and economic challenges. The complexity of modern reservoirs, particularly in deepwater fishing operations, can reduce tool effectiveness by up to 30% without specialized retrieval tool metallurgy and design. The persistent shortage of skilled labor for advanced systems can increase operational downtime by an average of 20%, hindering non-productive time (NPT) reduction efforts.
  • High R&D costs for reliable HPHT tools and remote-controlled hydraulic cutters create barriers for smaller players and constrain innovation in offshore well integrity.
  • Navigating intricate wellbore geometry requires constant investment in high-speed diamond-enhanced mills and other advanced hardware, while the need for fishing services expertise remains a critical bottleneck, impacting the efficiency of managed pressure drilling support and other integrated wellbore services.

Exclusive Technavio Analysis on Customer Landscape

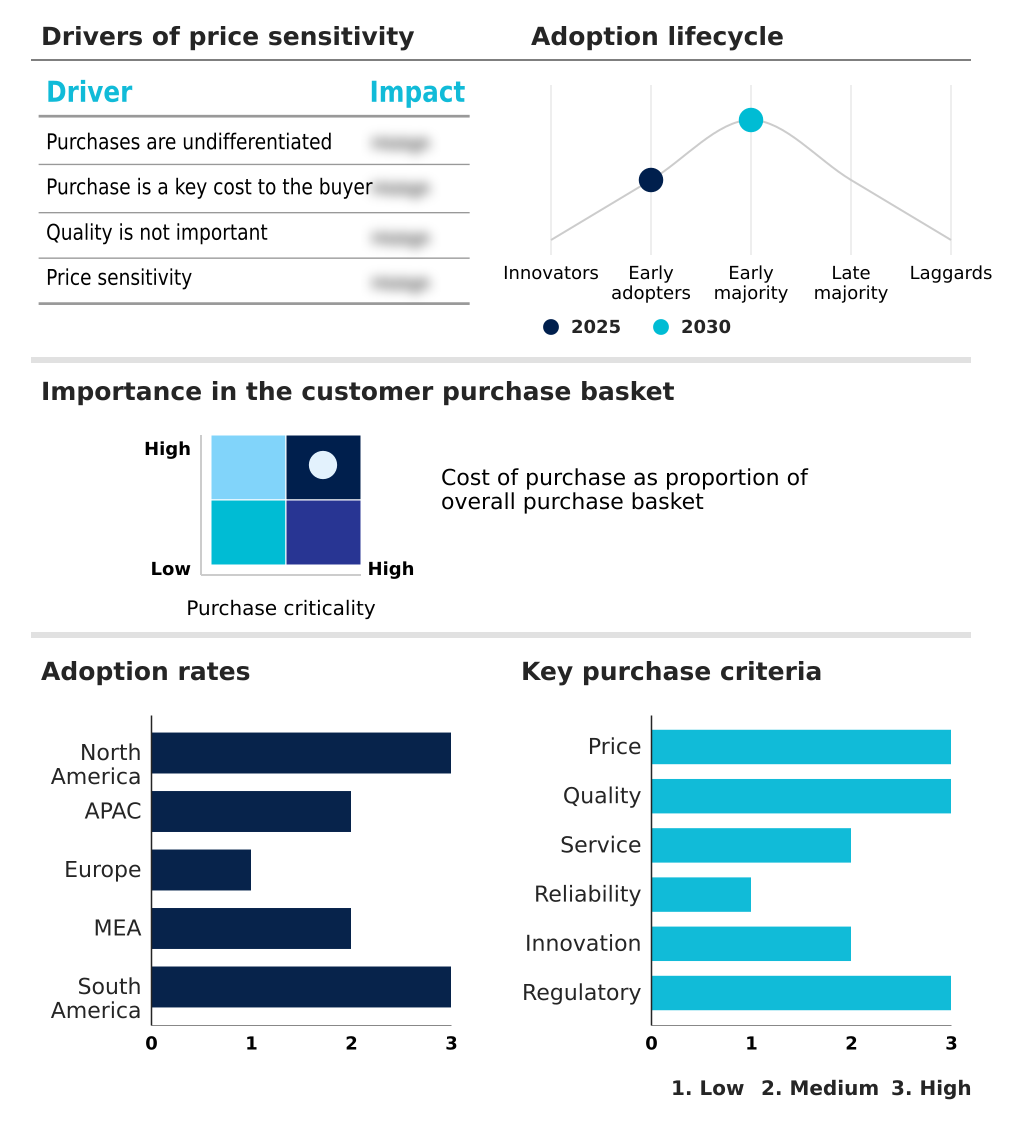
The oil and gas fishing market forecasting report includes the adoption lifecycle of the market, covering from the innovator’s stage to the laggard’s stage. It focuses on adoption rates in different regions based on penetration. Furthermore, the oil and gas fishing market report also includes key purchase criteria and drivers of price sensitivity to help companies evaluate and develop their market growth analysis strategies.

Customer Landscape of Oil And Gas Fishing Industry

Competitive Landscape

Companies are implementing various strategies, such as strategic alliances, oil and gas fishing market forecast, partnerships, mergers and acquisitions, geographical expansion, and product/service launches, to enhance their presence in the industry.

Archer Norge AS - Offerings include a unified portfolio of fishing tools, advanced cutting and milling systems, and comprehensive wellbore cleanup solutions designed for complex well intervention and integrity.

The industry research and growth report includes detailed analyses of the competitive landscape of the market and information about key companies, including:

  • Archer Norge AS
  • Baker Hughes Co.
  • Bilco Tools Inc.
  • China Oilfield Services Ltd.
  • Dosco Petroservices Romania Srl
  • Enedril
  • Expro Group Holdings NV
  • Graco Oilfield Services
  • Halliburton Co.
  • NOV Inc.
  • Ranger Energy Services LLC
  • Schlumberger Ltd.
  • Tasman Oil Tools Ltd.
  • Weatherford International Plc
  • Wenzel Industries
  • Wildcat Oil Tools LLC
  • Yellowjacket Oilfield Services LLC

Qualitative and quantitative analysis of companies has been conducted to help clients understand the wider business environment as well as the strengths and weaknesses of key industry players. Data is qualitatively analyzed to categorize companies as pure play, category-focused, industry-focused, and diversified; it is quantitatively analyzed to categorize companies as dominant, leading, strong, tentative, and weak.

Recent Development and News in Oil and gas fishing market

  • In September 2025, Tesla announced a pilot program for high-capacity battery units to power autonomous subsea intervention vehicles, aiming to enable more prolonged and intricate remote fishing tasks in ultra-deepwater environments.
  • In May 2025, Saudi Aramco entered a strategic partnership to deploy new high-expansion gauge cutters and fishing magnets across its offshore gas fields, aiming to reduce remedial operation times.
  • In April 2025, the government of Guyana issued updated environmental guidelines mandating the immediate recovery of any debris lost within its territorial waters, increasing demand for specialized fishing toolkits.
  • In February 2025, Halliburton Co. introduced an autonomous downhole diagnostic tool for the North American shale industry, designed to identify the exact orientation of stuck pipe and debris for more precise retrieval.

Dive into Technavio’s robust research methodology, blending expert interviews, extensive data synthesis, and validated models for unparalleled Oil And Gas Fishing Market insights. See full methodology.

Market Scope
Page number 291
Base year 2025
Historic period 2020-2024
Forecast period 2026-2030
Growth momentum & CAGR Accelerate at a CAGR of 6.5%
Market growth 2026-2030 USD 2441.5 million
Market structure Fragmented
YoY growth 2025-2026(%) 6.0%
Key countries US, Canada, Mexico, China, India, Australia, Malaysia, Indonesia, Thailand, UK, Norway, Russia, The Netherlands, Germany, Spain, Saudi Arabia, UAE, Qatar, Nigeria, Algeria, Brazil, Argentina and Venezuela
Competitive landscape Leading Companies, Market Positioning of Companies, Competitive Strategies, and Industry Risks

Request Free Sample

Research Analyst Overview

  • The oil and gas fishing market remains essential for maintaining operational continuity, driven by the need for efficient stuck pipe retrieval and wellbore cleanup. The sector is advancing through the integration of technologies like downhole telemetry and smart sensor-enabled tools, which are becoming standard for well intervention.
  • Key hardware, including hydraulic jars, milling tools, and casing cutters, continues to evolve, with innovations like the digital hydraulic jar and ultrasonic imaging tools enhancing precision. In a notable shift, firms are adopting modular milling systems and autonomous fishing tools, which streamline downhole obstruction removal.
  • A key boardroom consideration is the budget allocation for such high-technology solutions, as their implementation has demonstrated a capability to reduce non-productive time by up to 30%. The use of power swivels, overshoots and spears, and advanced whipstock systems is critical for complex directional drilling and subsea intervention.
  • As wells become more complex, demand for sophisticated fishing jars, junk baskets, and casing scrapers is increasing, reinforcing the importance of robust well integrity management and well abandonment services.

What are the Key Data Covered in this Oil And Gas Fishing Market Research and Growth Report?

  • What is the expected growth of the Oil And Gas Fishing Market between 2026 and 2030?

    • USD 2.44 billion, at a CAGR of 6.5%

  • What segmentation does the market report cover?

    • The report is segmented by Application (Onshore, and Offshore), Product (Casing cutters, Milling tools, Overshoots and spears, and Fishing jars), Type (Fishing tools, Fishing services, and Rental services) and Geography (North America, APAC, Europe, Middle East and Africa, South America)

  • Which regions are analyzed in the report?

    • North America, APAC, Europe, Middle East and Africa and South America

  • What are the key growth drivers and market challenges?

    • Escalating global crude oil demand, Shortage of skilled labor for advanced tools

  • Who are the major players in the Oil And Gas Fishing Market?

    • Archer Norge AS, Baker Hughes Co., Bilco Tools Inc., China Oilfield Services Ltd., Dosco Petroservices Romania Srl, Enedril, Expro Group Holdings NV, Graco Oilfield Services, Halliburton Co., NOV Inc., Ranger Energy Services LLC, Schlumberger Ltd., Tasman Oil Tools Ltd., Weatherford International Plc, Wenzel Industries, Wildcat Oil Tools LLC and Yellowjacket Oilfield Services LLC

Market Research Insights

  • The market's dynamism is shaped by a focus on operational efficiency and risk mitigation. Integrating advanced retrieval systems improves stuck tool recovery success rates by over 25% compared to conventional methods. Fishing services expertise is critical, with well intervention planning now leveraging real-time fishing diagnostics to guide downhole equipment recovery.
  • This approach reduces non-productive time in deepwater fishing operations by an average of 15%. Furthermore, proactive wellbore maintenance and decommissioning support services are gaining prominence, driven by stringent regulations. Fishing tool rental services provide operators with access to specialized recovery solutions without significant capital outlay, supporting cost-effective recovery methods across both onshore fishing operations and complex offshore well integrity projects.
  • The use of adaptive fishing techniques ensures that interventions in unconventional reservoirs are optimized for unique wellbore geometry.

We can help! Our analysts can customize this oil and gas fishing market research report to meet your requirements.

Get in touch

1. Executive Summary

1.1 Market overview

Executive Summary - Chart on Market Overview
Executive Summary - Data Table on Market Overview
Executive Summary - Chart on Global Market Characteristics
Executive Summary - Chart on Market by Geography
Executive Summary - Chart on Market Segmentation by Application
Executive Summary - Chart on Market Segmentation by Product
Executive Summary - Chart on Market Segmentation by Type
Executive Summary - Chart on Incremental Growth
Executive Summary - Data Table on Incremental Growth
Executive Summary - Chart on Company Market Positioning

2. Technavio Analysis

2.1 Analysis of price sensitivity, lifecycle, customer purchase basket, adoption rates, and purchase criteria

2.2 Criticality of inputs and Factors of differentiation

Chart on Overview on criticality of inputs and factors of differentiation

2.3 Factors of disruption

Chart on Overview on factors of disruption

2.4 Impact of drivers and challenges

Chart on Impact of drivers and challenges in 2025 and 2030

3. Market Landscape

3.1 Market ecosystem

Chart on Parent Market
Data Table on - Parent Market

3.2 Market characteristics

Chart on Market characteristics analysis

3.3 Value chain analysis

Chart on Value chain analysis

4. Market Sizing

4.1 Market definition

Data Table on Offerings of companies included in the market definition

4.2 Market segment analysis

Market segments

4.3 Market size 2025

4.4 Market outlook: Forecast for 2025-2030

Chart on Global - Market size and forecast 2025-2030 ($ million)
Data Table on Global - Market size and forecast 2025-2030 ($ million)
Chart on Global Market: Year-over-year growth 2025-2030 (%)
Data Table on Global Market: Year-over-year growth 2025-2030 (%)

5. Historic Market Size

5.1 Global Oil And Gas Fishing Market 2020 - 2024

Historic Market Size - Data Table on Global Oil And Gas Fishing Market 2020 - 2024 ($ million)

5.2 Application segment analysis 2020 - 2024

Historic Market Size - Application Segment 2020 - 2024 ($ million)

5.3 Product segment analysis 2020 - 2024

Historic Market Size - Product Segment 2020 - 2024 ($ million)

5.4 Type segment analysis 2020 - 2024

Historic Market Size - Type Segment 2020 - 2024 ($ million)

5.5 Geography segment analysis 2020 - 2024

Historic Market Size - Geography Segment 2020 - 2024 ($ million)

5.6 Country segment analysis 2020 - 2024

Historic Market Size - Country Segment 2020 - 2024 ($ million)

6. Qualitative Analysis

6.1 The Impact of AI on Global Oil and Gas Fishing Market

7. Five Forces Analysis

7.1 Five forces summary

Five forces analysis - Comparison between 2025 and 2030

7.2 Bargaining power of buyers

Bargaining power of buyers - Impact of key factors 2025 and 2030

7.3 Bargaining power of suppliers

Bargaining power of suppliers - Impact of key factors in 2025 and 2030

7.4 Threat of new entrants

Threat of new entrants - Impact of key factors in 2025 and 2030

7.5 Threat of substitutes

Threat of substitutes - Impact of key factors in 2025 and 2030

7.6 Threat of rivalry

Threat of rivalry - Impact of key factors in 2025 and 2030

7.7 Market condition

Chart on Market condition - Five forces 2025 and 2030

8. Market Segmentation by Application

8.1 Market segments

Chart on Application - Market share 2025-2030 (%)
Data Table on Application - Market share 2025-2030 (%)

8.2 Comparison by Application

Chart on Comparison by Application
Data Table on Comparison by Application

8.3 Onshore - Market size and forecast 2025-2030

Chart on Onshore - Market size and forecast 2025-2030 ($ million)
Data Table on Onshore - Market size and forecast 2025-2030 ($ million)
Chart on Onshore - Year-over-year growth 2025-2030 (%)
Data Table on Onshore - Year-over-year growth 2025-2030 (%)

8.4 Offshore - Market size and forecast 2025-2030

Chart on Offshore - Market size and forecast 2025-2030 ($ million)
Data Table on Offshore - Market size and forecast 2025-2030 ($ million)
Chart on Offshore - Year-over-year growth 2025-2030 (%)
Data Table on Offshore - Year-over-year growth 2025-2030 (%)

8.5 Market opportunity by Application

Market opportunity by Application ($ million)
Data Table on Market opportunity by Application ($ million)

9. Market Segmentation by Product

9.1 Market segments

Chart on Product - Market share 2025-2030 (%)
Data Table on Product - Market share 2025-2030 (%)

9.2 Comparison by Product

Chart on Comparison by Product
Data Table on Comparison by Product

9.3 Casing cutters - Market size and forecast 2025-2030

Chart on Casing cutters - Market size and forecast 2025-2030 ($ million)
Data Table on Casing cutters - Market size and forecast 2025-2030 ($ million)
Chart on Casing cutters - Year-over-year growth 2025-2030 (%)
Data Table on Casing cutters - Year-over-year growth 2025-2030 (%)

9.4 Milling tools - Market size and forecast 2025-2030

Chart on Milling tools - Market size and forecast 2025-2030 ($ million)
Data Table on Milling tools - Market size and forecast 2025-2030 ($ million)
Chart on Milling tools - Year-over-year growth 2025-2030 (%)
Data Table on Milling tools - Year-over-year growth 2025-2030 (%)

9.5 Overshoots and spears - Market size and forecast 2025-2030

Chart on Overshoots and spears - Market size and forecast 2025-2030 ($ million)
Data Table on Overshoots and spears - Market size and forecast 2025-2030 ($ million)
Chart on Overshoots and spears - Year-over-year growth 2025-2030 (%)
Data Table on Overshoots and spears - Year-over-year growth 2025-2030 (%)

9.6 Fishing jars - Market size and forecast 2025-2030

Chart on Fishing jars - Market size and forecast 2025-2030 ($ million)
Data Table on Fishing jars - Market size and forecast 2025-2030 ($ million)
Chart on Fishing jars - Year-over-year growth 2025-2030 (%)
Data Table on Fishing jars - Year-over-year growth 2025-2030 (%)

9.7 Market opportunity by Product

Market opportunity by Product ($ million)
Data Table on Market opportunity by Product ($ million)

10. Market Segmentation by Type

10.1 Market segments

Chart on Type - Market share 2025-2030 (%)
Data Table on Type - Market share 2025-2030 (%)

10.2 Comparison by Type

Chart on Comparison by Type
Data Table on Comparison by Type

10.3 Fishing tools - Market size and forecast 2025-2030

Chart on Fishing tools - Market size and forecast 2025-2030 ($ million)
Data Table on Fishing tools - Market size and forecast 2025-2030 ($ million)
Chart on Fishing tools - Year-over-year growth 2025-2030 (%)
Data Table on Fishing tools - Year-over-year growth 2025-2030 (%)

10.4 Fishing services - Market size and forecast 2025-2030

Chart on Fishing services - Market size and forecast 2025-2030 ($ million)
Data Table on Fishing services - Market size and forecast 2025-2030 ($ million)
Chart on Fishing services - Year-over-year growth 2025-2030 (%)
Data Table on Fishing services - Year-over-year growth 2025-2030 (%)

10.5 Rental services - Market size and forecast 2025-2030

Chart on Rental services - Market size and forecast 2025-2030 ($ million)
Data Table on Rental services - Market size and forecast 2025-2030 ($ million)
Chart on Rental services - Year-over-year growth 2025-2030 (%)
Data Table on Rental services - Year-over-year growth 2025-2030 (%)

10.6 Market opportunity by Type

Market opportunity by Type ($ million)
Data Table on Market opportunity by Type ($ million)

11. Customer Landscape

11.1 Customer landscape overview

Analysis of price sensitivity, lifecycle, customer purchase basket, adoption rates, and purchase criteria

12. Geographic Landscape

12.1 Geographic segmentation

Chart on Market share by geography 2025-2030 (%)
Data Table on Market share by geography 2025-2030 (%)

12.2 Geographic comparison

Chart on Geographic comparison
Data Table on Geographic comparison

12.3 North America - Market size and forecast 2025-2030

Chart on North America - Market size and forecast 2025-2030 ($ million)
Data Table on North America - Market size and forecast 2025-2030 ($ million)
Chart on North America - Year-over-year growth 2025-2030 (%)
Data Table on North America - Year-over-year growth 2025-2030 (%)
Chart on Regional Comparison - North America
Data Table on Regional Comparison - North America

12.3.1 US - Market size and forecast 2025-2030

Chart on US - Market size and forecast 2025-2030 ($ million)
Data Table on US - Market size and forecast 2025-2030 ($ million)
Chart on US - Year-over-year growth 2025-2030 (%)
Data Table on US - Year-over-year growth 2025-2030 (%)

12.3.2 Canada - Market size and forecast 2025-2030

Chart on Canada - Market size and forecast 2025-2030 ($ million)
Data Table on Canada - Market size and forecast 2025-2030 ($ million)
Chart on Canada - Year-over-year growth 2025-2030 (%)
Data Table on Canada - Year-over-year growth 2025-2030 (%)

12.3.3 Mexico - Market size and forecast 2025-2030

Chart on Mexico - Market size and forecast 2025-2030 ($ million)
Data Table on Mexico - Market size and forecast 2025-2030 ($ million)
Chart on Mexico - Year-over-year growth 2025-2030 (%)
Data Table on Mexico - Year-over-year growth 2025-2030 (%)

12.4 APAC - Market size and forecast 2025-2030

Chart on APAC - Market size and forecast 2025-2030 ($ million)
Data Table on APAC - Market size and forecast 2025-2030 ($ million)
Chart on APAC - Year-over-year growth 2025-2030 (%)
Data Table on APAC - Year-over-year growth 2025-2030 (%)
Chart on Regional Comparison - APAC
Data Table on Regional Comparison - APAC

12.4.1 China - Market size and forecast 2025-2030

Chart on China - Market size and forecast 2025-2030 ($ million)
Data Table on China - Market size and forecast 2025-2030 ($ million)
Chart on China - Year-over-year growth 2025-2030 (%)
Data Table on China - Year-over-year growth 2025-2030 (%)

12.4.2 India - Market size and forecast 2025-2030

Chart on India - Market size and forecast 2025-2030 ($ million)
Data Table on India - Market size and forecast 2025-2030 ($ million)
Chart on India - Year-over-year growth 2025-2030 (%)
Data Table on India - Year-over-year growth 2025-2030 (%)

12.4.3 Australia - Market size and forecast 2025-2030

Chart on Australia - Market size and forecast 2025-2030 ($ million)
Data Table on Australia - Market size and forecast 2025-2030 ($ million)
Chart on Australia - Year-over-year growth 2025-2030 (%)
Data Table on Australia - Year-over-year growth 2025-2030 (%)

12.4.4 Malaysia - Market size and forecast 2025-2030

Chart on Malaysia - Market size and forecast 2025-2030 ($ million)
Data Table on Malaysia - Market size and forecast 2025-2030 ($ million)
Chart on Malaysia - Year-over-year growth 2025-2030 (%)
Data Table on Malaysia - Year-over-year growth 2025-2030 (%)

12.4.5 Indonesia - Market size and forecast 2025-2030

Chart on Indonesia - Market size and forecast 2025-2030 ($ million)
Data Table on Indonesia - Market size and forecast 2025-2030 ($ million)
Chart on Indonesia - Year-over-year growth 2025-2030 (%)
Data Table on Indonesia - Year-over-year growth 2025-2030 (%)

12.4.6 Thailand - Market size and forecast 2025-2030

Chart on Thailand - Market size and forecast 2025-2030 ($ million)
Data Table on Thailand - Market size and forecast 2025-2030 ($ million)
Chart on Thailand - Year-over-year growth 2025-2030 (%)
Data Table on Thailand - Year-over-year growth 2025-2030 (%)

12.5 Europe - Market size and forecast 2025-2030

Chart on Europe - Market size and forecast 2025-2030 ($ million)
Data Table on Europe - Market size and forecast 2025-2030 ($ million)
Chart on Europe - Year-over-year growth 2025-2030 (%)
Data Table on Europe - Year-over-year growth 2025-2030 (%)
Chart on Regional Comparison - Europe
Data Table on Regional Comparison - Europe

12.5.1 UK - Market size and forecast 2025-2030

Chart on UK - Market size and forecast 2025-2030 ($ million)
Data Table on UK - Market size and forecast 2025-2030 ($ million)
Chart on UK - Year-over-year growth 2025-2030 (%)
Data Table on UK - Year-over-year growth 2025-2030 (%)

12.5.2 Norway - Market size and forecast 2025-2030

Chart on Norway - Market size and forecast 2025-2030 ($ million)
Data Table on Norway - Market size and forecast 2025-2030 ($ million)
Chart on Norway - Year-over-year growth 2025-2030 (%)
Data Table on Norway - Year-over-year growth 2025-2030 (%)

12.5.3 Russia - Market size and forecast 2025-2030

Chart on Russia - Market size and forecast 2025-2030 ($ million)
Data Table on Russia - Market size and forecast 2025-2030 ($ million)
Chart on Russia - Year-over-year growth 2025-2030 (%)
Data Table on Russia - Year-over-year growth 2025-2030 (%)

12.5.4 The Netherlands - Market size and forecast 2025-2030

Chart on The Netherlands - Market size and forecast 2025-2030 ($ million)
Data Table on The Netherlands - Market size and forecast 2025-2030 ($ million)
Chart on The Netherlands - Year-over-year growth 2025-2030 (%)
Data Table on The Netherlands - Year-over-year growth 2025-2030 (%)

12.5.5 Germany - Market size and forecast 2025-2030

Chart on Germany - Market size and forecast 2025-2030 ($ million)
Data Table on Germany - Market size and forecast 2025-2030 ($ million)
Chart on Germany - Year-over-year growth 2025-2030 (%)
Data Table on Germany - Year-over-year growth 2025-2030 (%)

12.5.6 Spain - Market size and forecast 2025-2030

Chart on Spain - Market size and forecast 2025-2030 ($ million)
Data Table on Spain - Market size and forecast 2025-2030 ($ million)
Chart on Spain - Year-over-year growth 2025-2030 (%)
Data Table on Spain - Year-over-year growth 2025-2030 (%)

12.6 Middle East and Africa - Market size and forecast 2025-2030

Chart on Middle East and Africa - Market size and forecast 2025-2030 ($ million)
Data Table on Middle East and Africa - Market size and forecast 2025-2030 ($ million)
Chart on Middle East and Africa - Year-over-year growth 2025-2030 (%)
Data Table on Middle East and Africa - Year-over-year growth 2025-2030 (%)
Chart on Regional Comparison - Middle East and Africa
Data Table on Regional Comparison - Middle East and Africa

12.6.1 Saudi Arabia - Market size and forecast 2025-2030

Chart on Saudi Arabia - Market size and forecast 2025-2030 ($ million)
Data Table on Saudi Arabia - Market size and forecast 2025-2030 ($ million)
Chart on Saudi Arabia - Year-over-year growth 2025-2030 (%)
Data Table on Saudi Arabia - Year-over-year growth 2025-2030 (%)

12.6.2 UAE - Market size and forecast 2025-2030

Chart on UAE - Market size and forecast 2025-2030 ($ million)
Data Table on UAE - Market size and forecast 2025-2030 ($ million)
Chart on UAE - Year-over-year growth 2025-2030 (%)
Data Table on UAE - Year-over-year growth 2025-2030 (%)

12.6.3 Qatar - Market size and forecast 2025-2030

Chart on Qatar - Market size and forecast 2025-2030 ($ million)
Data Table on Qatar - Market size and forecast 2025-2030 ($ million)
Chart on Qatar - Year-over-year growth 2025-2030 (%)
Data Table on Qatar - Year-over-year growth 2025-2030 (%)

12.6.4 Nigeria - Market size and forecast 2025-2030

Chart on Nigeria - Market size and forecast 2025-2030 ($ million)
Data Table on Nigeria - Market size and forecast 2025-2030 ($ million)
Chart on Nigeria - Year-over-year growth 2025-2030 (%)
Data Table on Nigeria - Year-over-year growth 2025-2030 (%)

12.6.5 Algeria - Market size and forecast 2025-2030

Chart on Algeria - Market size and forecast 2025-2030 ($ million)
Data Table on Algeria - Market size and forecast 2025-2030 ($ million)
Chart on Algeria - Year-over-year growth 2025-2030 (%)
Data Table on Algeria - Year-over-year growth 2025-2030 (%)

12.7 South America - Market size and forecast 2025-2030

Chart on South America - Market size and forecast 2025-2030 ($ million)
Data Table on South America - Market size and forecast 2025-2030 ($ million)
Chart on South America - Year-over-year growth 2025-2030 (%)
Data Table on South America - Year-over-year growth 2025-2030 (%)
Chart on Regional Comparison - South America
Data Table on Regional Comparison - South America

12.7.1 Brazil - Market size and forecast 2025-2030

Chart on Brazil - Market size and forecast 2025-2030 ($ million)
Data Table on Brazil - Market size and forecast 2025-2030 ($ million)
Chart on Brazil - Year-over-year growth 2025-2030 (%)
Data Table on Brazil - Year-over-year growth 2025-2030 (%)

12.7.2 Argentina - Market size and forecast 2025-2030

Chart on Argentina - Market size and forecast 2025-2030 ($ million)
Data Table on Argentina - Market size and forecast 2025-2030 ($ million)
Chart on Argentina - Year-over-year growth 2025-2030 (%)
Data Table on Argentina - Year-over-year growth 2025-2030 (%)

12.7.3 Venezuela - Market size and forecast 2025-2030

Chart on Venezuela - Market size and forecast 2025-2030 ($ million)
Data Table on Venezuela - Market size and forecast 2025-2030 ($ million)
Chart on Venezuela - Year-over-year growth 2025-2030 (%)
Data Table on Venezuela - Year-over-year growth 2025-2030 (%)

12.8 Market opportunity by geography

Market opportunity by geography ($ million)
Data Tables on Market opportunity by geography ($ million)

13. Drivers, Challenges, and Opportunity

13.1 Market drivers

Escalating global crude oil demand
Expanding plugging-and-abandonment programs increase service needs
Energy security pushes production investment globally

13.2 Market challenges

Shortage of skilled labor for advanced tools
Complex reservoir environments hinder fishing operations
High research and development costs for reliability

13.3 Impact of drivers and challenges

Impact of drivers and challenges in 2025 and 2030

13.4 Market opportunities

Adoption of automation and real-time downhole telemetry
Growing use of smart sensor‑enabled fishing tools
Rising integration of data analytics in operations

14. Competitive Landscape

14.1 Overview

14.2

Overview on criticality of inputs and factors of differentiation

14.3 Landscape disruption

Overview on factors of disruption

14.4 Industry risks

Impact of key risks on business

15. Competitive Analysis

15.1 Companies profiled

Companies covered

15.2 Company ranking index

15.3 Market positioning of companies

Matrix on companies position and classification

15.4 Archer Norge AS

Archer Norge AS - Overview
Archer Norge AS - Product / Service
Archer Norge AS - Key offerings
SWOT

15.5 Baker Hughes Co.

Baker Hughes Co. - Overview
Baker Hughes Co. - Business segments
Baker Hughes Co. - Key news
Baker Hughes Co. - Key offerings
Baker Hughes Co. - Segment focus
SWOT

15.6 China Oilfield Services Ltd.

China Oilfield Services Ltd. - Overview
China Oilfield Services Ltd. - Business segments
China Oilfield Services Ltd. - Key offerings
China Oilfield Services Ltd. - Segment focus
SWOT

15.7 Enedril

Enedril - Overview
Enedril - Product / Service
Enedril - Key offerings
SWOT

15.8 Expro Group Holdings NV

Expro Group Holdings NV - Overview
Expro Group Holdings NV - Business segments
Expro Group Holdings NV - Key offerings
Expro Group Holdings NV - Segment focus
SWOT

15.9 Graco Oilfield Services

Graco Oilfield Services - Overview
Graco Oilfield Services - Product / Service
Graco Oilfield Services - Key offerings
SWOT

15.10 Halliburton Co.

Halliburton Co. - Overview
Halliburton Co. - Business segments
Halliburton Co. - Key news
Halliburton Co. - Key offerings
Halliburton Co. - Segment focus
SWOT

15.11 NOV Inc.

NOV Inc. - Overview
NOV Inc. - Business segments
NOV Inc. - Key news
NOV Inc. - Key offerings
NOV Inc. - Segment focus
SWOT

15.12 Ranger Energy Services LLC

Ranger Energy Services LLC - Overview
Ranger Energy Services LLC - Product / Service
Ranger Energy Services LLC - Key offerings
SWOT

15.13 Schlumberger Ltd.

Schlumberger Ltd. - Overview
Schlumberger Ltd. - Business segments
Schlumberger Ltd. - Key news
Schlumberger Ltd. - Key offerings
Schlumberger Ltd. - Segment focus
SWOT

15.14 Tasman Oil Tools Ltd.

Tasman Oil Tools Ltd. - Overview
Tasman Oil Tools Ltd. - Product / Service
Tasman Oil Tools Ltd. - Key offerings
SWOT

15.15 Weatherford International Plc

Weatherford International Plc - Overview
Weatherford International Plc - Business segments
Weatherford International Plc - Key offerings
Weatherford International Plc - Segment focus
SWOT

15.16 Wenzel Industries

Wenzel Industries - Overview
Wenzel Industries - Product / Service
Wenzel Industries - Key offerings
SWOT

15.17 Wildcat Oil Tools LLC

Wildcat Oil Tools LLC - Overview
Wildcat Oil Tools LLC - Product / Service
Wildcat Oil Tools LLC - Key offerings
SWOT

15.18 Yellowjacket Oilfield Services LLC

Yellowjacket Oilfield Services LLC - Overview
Yellowjacket Oilfield Services LLC - Product / Service
Yellowjacket Oilfield Services LLC - Key offerings
SWOT

16. Appendix

16.1 Scope of the report

Market definition
Objectives
Notes and caveats

16.2 Inclusions and exclusions checklist

Inclusions checklist
Exclusions checklist

16.3 Currency conversion rates for US$

16.4 Research methodology

16.5 Data procurement

Information sources

16.6 Data validation

16.7 Validation techniques employed for market sizing

16.8 Data synthesis

16.9 360 degree market analysis

16.10 List of abbreviations

Research Methodology

Technavio presents a detailed picture of the market by way of study, synthesis, and summation of data from multiple sources. The analysts have presented the various facets of the market with a particular focus on identifying the key industry influencers. The data thus presented is comprehensive, reliable, and the result of extensive research, both primary and secondary.

INFORMATION SOURCES

Primary sources

  • Manufacturers and suppliers
  • Channel partners
  • Industry experts
  • Strategic decision makers

Secondary sources

  • Industry journals and periodicals
  • Government data
  • Financial reports of key industry players
  • Historical data
  • Press releases

DATA ANALYSIS

Data Synthesis

  • Collation of data
  • Estimation of key figures
  • Analysis of derived insights

Data Validation

  • Triangulation with data models
  • Reference against proprietary databases
  • Corroboration with industry experts

REPORT WRITING

Qualitative

  • Market drivers
  • Market challenges
  • Market trends
  • Five forces analysis

Quantitative

  • Market size and forecast
  • Market segmentation
  • Geographical insights
  • Competitive landscape

Interested in this report?

Get your sample now to see our research methodology and insights!

Download Now

Frequently Asked Questions

Oil And Gas Fishing market growth will increase by USD 2441.5 million during 2026-2030.

The Oil And Gas Fishing market is expected to grow at a CAGR of 6.5% during 2026-2030.

Oil And Gas Fishing market is segmented by Application (Onshore, Offshore) Product (Casing cutters, Milling tools, Overshoots and spears, Fishing jars) Type (Fishing tools, Fishing services, Rental services)

Archer Norge AS, Baker Hughes Co., Bilco Tools Inc., China Oilfield Services Ltd., Dosco Petroservices Romania Srl, Enedril, Expro Group Holdings NV, Graco Oilfield Services, Halliburton Co., NOV Inc., Ranger Energy Services LLC, Schlumberger Ltd., Tasman Oil Tools Ltd., Weatherford International Plc, Wenzel Industries, Wildcat Oil Tools LLC, Yellowjacket Oilfield Services LLC are a few of the key vendors in the Oil And Gas Fishing market.

North America will register the highest growth rate of 41.4% among the other regions. Therefore, the Oil And Gas Fishing market in North America is expected to garner significant business opportunities for the vendors during the forecast period.

US, Canada, Mexico, China, India, Australia, Malaysia, Indonesia, Thailand, UK, Norway, Russia, The Netherlands, Germany, Spain, Saudi Arabia, UAE, Qatar, Nigeria, Algeria, Brazil, Argentina, Venezuela

  • Escalating global crude oil demand is the driving factor this market.

The Oil And Gas Fishing market vendors should focus on grabbing business opportunities from the Application segment as it accounted for the largest market share in the base year.
RIA - Research AI Assistant
Ask RIA