Oil and Gas Pipeline and Transportation Automation Market Analysis North America, APAC, Europe, Middle East and Africa, South America - US, Canada, Saudi Arabia, China, Russia - Size and Forecast 2024-2028

Oil and Gas Pipeline and Transportation Automation Market Analysis North America, APAC, Europe, Middle East and Africa, South America - US, Canada, Saudi Arabia, China, Russia - Size and Forecast 2024-2028

Published: Oct 2023 180 Pages SKU: IRTNTR40118

Market Overview at a Glance

$1.47 B
Market Opportunity
3.16%
CAGR
2.5
YoY growth 2023-2024(%)

Oil and Gas Pipeline and Transportation Automation Market Size 2024-2028

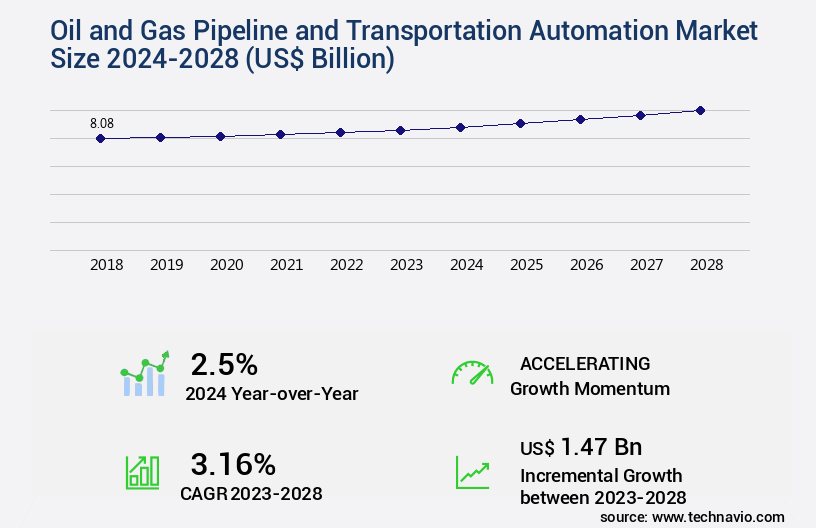
The oil and gas pipeline and transportation automation market size is valued to increase USD 1.47 billion, at a CAGR of 3.16% from 2023 to 2028. Growing expansion of oil terminals will drive the oil and gas pipeline and transportation automation market.

Major Market Trends & Insights

  • APAC dominated the market and accounted for a 30% growth during the forecast period.
  • By Application - Pipeline segment was valued at USD 7.38 billion in 2022
  • By Solution - SCADA segment accounted for the largest market revenue share in 2022

Market Size & Forecast

  • Market Opportunities: USD 26.04 billion
  • Market Future Opportunities: USD 1.47 billion
  • CAGR from 2023 to 2028 : 3.16%

Market Summary

  • The market is experiencing significant growth, with a reported value of USD12.5 billion in 2020. This expansion is driven by the increasing adoption of Internet of Things (IoT) technology in midstream oil and gas operations. By automating pipeline monitoring and transportation processes, companies can enhance efficiency, reduce costs, and improve safety. The integration of advanced analytics and machine learning algorithms into pipeline management systems enables real-time monitoring of pipeline performance and predictive maintenance. This proactive approach to maintenance reduces downtime and minimizes the risk of costly repairs or environmental incidents. Moreover, the use of drones and remote sensing technologies for pipeline inspections further enhances the market's functionality.
  • These technologies allow for non-destructive testing and real-time data collection, reducing the need for manual inspections and improving overall operational efficiency. Despite these advancements, challenges persist. Cybersecurity concerns and the high cost of implementing and maintaining automation systems remain significant barriers to entry for some companies. However, as technology continues to evolve and costs decrease, the market is poised for continued growth. In conclusion, the market is a dynamic and evolving industry, driven by technological advancements and the need for increased operational efficiency. With a reported value of USD12.5 billion in 2020, this market is expected to grow as companies continue to adopt automation technologies to improve pipeline performance, reduce costs, and enhance safety.

What will be the Size of the Oil and Gas Pipeline and Transportation Automation Market during the forecast period?

Oil and Gas Pipeline and Transportation Automation Market Size

Get Key Insights on Market Forecast (PDF) Request Free Sample

How is the Oil and Gas Pipeline and Transportation Automation Market Segmented ?

The oil and gas pipeline and transportation automation industry research report provides comprehensive data (region-wise segment analysis), with forecasts and estimates in "USD billion" for the period 2024-2028, as well as historical data from 2018-2022 for the following segments.

  • Application
    • Pipeline
    • LNG
    • terminal
  • Solution
    • SCADA
    • DCS
    • PLC
  • Geography
    • North America
      • US
      • Canada
    • Europe
      • Russia
    • APAC
      • China
    • Rest of World (ROW)

    By Application Insights

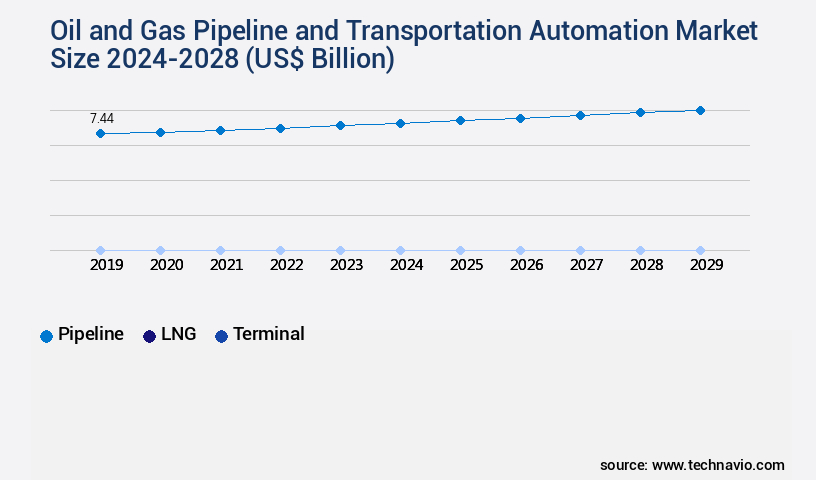
    The pipeline segment is estimated to witness significant growth during the forecast period.

    Pipelines play a pivotal role in the oil and gas midstream sector, serving as the preferred choice for transporting vast quantities of fluids. These intricate systems are subjected to rigorous performance metrics, including flow rate optimization, throughput capacity increase, and pressure monitoring. Pipeline infrastructure caters to diverse operating environments and a range of fluids, from crude oil and natural gas to refined products and liquefied gases. With the ongoing evolution of pipeline technology, automation has become a cornerstone, integrating predictive maintenance models, automated valve control, and pipeline stress analysis for enhanced pipeline safety. Distributed control systems, pipeline risk assessment, and operational efficiency metrics are essential components of pipeline management, ensuring regulatory compliance and cost reduction.

    Pipeline simulation software, corrosion detection methods, and regulatory compliance audits are integral to maintaining pipeline integrity. Smart pipeline technology, real-time pipeline control, and flow assurance strategies enable efficient pigging operations scheduling and effective leak detection. SCADA system integration, data acquisition systems, pipeline material selection, automated pipeline welding, pipeline network optimization, and emergency shutdown systems are all crucial elements of pipeline infrastructure. According to recent reports, the global oil and gas pipeline automation market is projected to grow at a CAGR of 5.5% between 2021 and 2026, underscoring the continuous advancements in pipeline technology.

    Oil and Gas Pipeline and Transportation Automation Market Size

    Request Free Sample

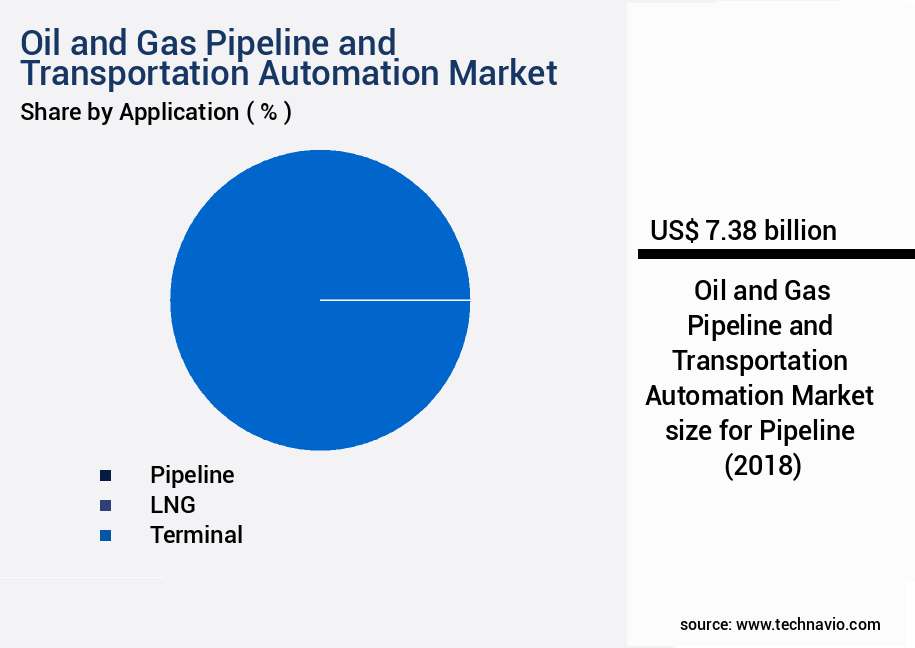
    The Pipeline segment was valued at USD 7.38 billion in 2018 and showed a gradual increase during the forecast period.

    Oil and Gas Pipeline and Transportation Automation Market Size

    Request Free Sample

    Regional Analysis

    APAC is estimated to contribute 30% to the growth of the global market during the forecast period.Technavio’s analysts have elaborately explained the regional trends and drivers that shape the market during the forecast period.

    Oil and Gas Pipeline and Transportation Automation Market Share by Geography

    See How Oil and Gas Pipeline and Transportation Automation Market Demand is Rising in APAC Request Free Sample

    North America, as the second-largest consumer of crude oil globally, is home to significant demand for fuel in the United States, Canada, and Mexico. The high production costs of oil and gas and the extensive utilization of advanced oilfield technologies, including transportation automation, position North America as a leading regional market for oil and gas pipeline and transportation automation. Notable companies in this sector include Emerson Electric Co.

    And Honeywell International Inc. The market's growth can be attributed to increasing investments in offshore fields in the Gulf of Mexico.

    Market Dynamics

    Our researchers analyzed the data with 2023 as the base year, along with the key drivers, trends, and challenges. A holistic analysis of drivers will help companies refine their marketing strategies to gain a competitive advantage.

    The market is experiencing significant growth due to the increasing demand for advanced pipeline monitoring and optimization solutions. This market encompasses a range of technologies, including real-time pipeline monitoring systems, automated pipeline pigging optimization, predictive modeling for pipeline maintenance, and data-driven pipeline operational efficiency. Geographic information systems pipeline mapping plays a crucial role in improving pipeline throughput capacity and ensuring pipeline integrity. By integrating SCADA systems for pipeline management, pipeline integrity management software solutions can provide remote pipeline valve control technology and advanced pipeline corrosion detection techniques. High-pressure pipeline design and safety are paramount, and pipeline risk assessment and mitigation strategies are essential for effective pipeline asset management. Implementing pipeline automation systems is a key trend in this market, with a focus on optimizing pipeline maintenance scheduling and minimizing operational risks. Advanced pipeline control system architecture and pipeline sensor network deployment strategies are essential for ensuring regulatory compliance and improving pipeline safety. Predictive modeling and data analytics are also becoming increasingly important for pipeline operators, enabling them to make informed decisions about pipeline maintenance and operations. In summary, the market is undergoing a transformation, driven by the need for advanced pipeline monitoring, optimization, and safety solutions. From real-time pipeline monitoring to predictive modeling and advanced pipeline control systems, these technologies are helping pipeline operators improve efficiency, reduce risks, and ensure regulatory compliance.

    Oil and Gas Pipeline and Transportation Automation Market Size

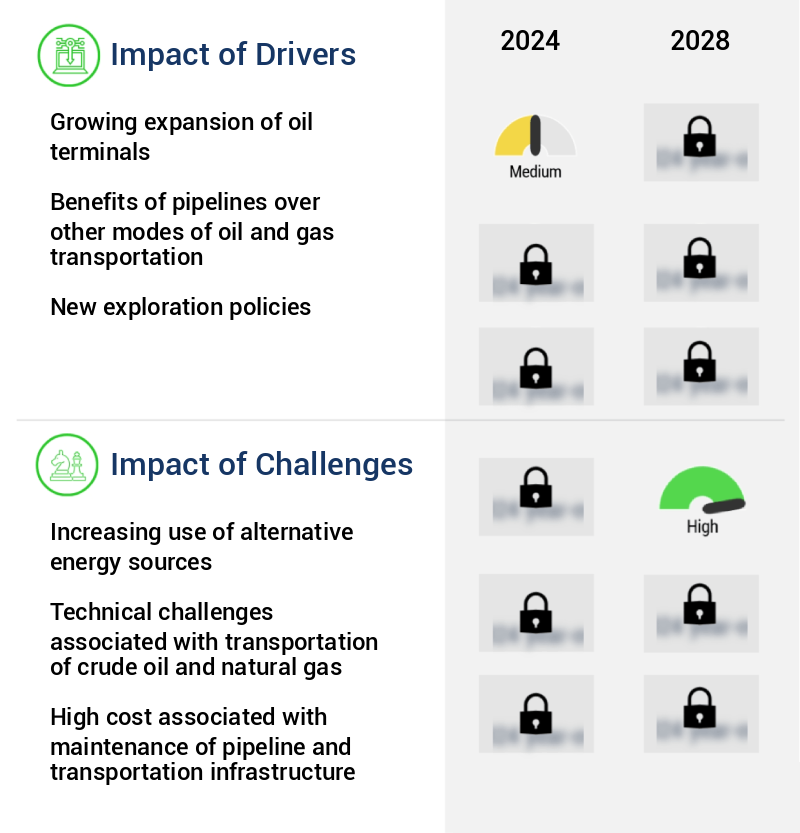
    What are the key market drivers leading to the rise in the adoption of Oil and Gas Pipeline and Transportation Automation Industry?

    • The expanding growth of oil terminals serves as the primary catalyst for market expansion. 

    • Oil terminals play a pivotal role in the oil and gas supply chain, facilitating the storage of crude oil and petroleum products while serving as hubs for transportation. The escalating global energy demand has fueled an increase in new oil terminal and pipeline constructions, particularly in Asia-Pacific and Africa, where the continuous energy requirement calls for new infrastructure. Notable developments include Saudi Aramco's expansion of its partnership program, Aramco Namaat, with 22 new Memorandums of Understanding (MoUs) and one joint venture agreement focusing on advanced materials, technology, industrial and energy services, and sustainability (Saudi Aramco, 2021).
    • In addition, India's petroleum regulator granted approval for the expansion of its natural gas pipeline network by 33,764 km, extending the country's gas grid (Petroleum and Natural Gas Regulatory Board, 2021). These projects underscore the ongoing investment in oil and gas infrastructure to meet the evolving energy landscape.

    What are the market trends shaping the Oil and Gas Pipeline and Transportation Automation Industry?

    • The increasing adoption of IoT in midstream oil and gas operations represents a significant market trend. This technological advancement is transforming the sector by enhancing operational efficiency and productivity.

    • The oil and gas midstream sector has undergone significant shifts in recent years, serving as a critical link between demand and supply centers while optimizing the oil and gas supply chain. The sector's transformation gained momentum following the 2015 crude oil price downturn, which compelled numerous companies to reconsider their investments in upstream projects. In response to the price decrease, firms prioritized cost reduction and adopted advanced technologies. One pressing concern in the midstream sector is reliability, encompassing pipeline and transportation automation. According to industry insights, the sector's focus on technology integration has led to substantial improvements in efficiency and operational resilience.
    • Moreover, the integration of data analytics and machine learning algorithms has enabled predictive maintenance, minimizing downtime and enhancing overall performance. This data-driven approach to midstream operations is expected to continue evolving, further optimizing the oil and gas supply chain and addressing the challenges posed by fluctuating market conditions.

    What challenges does the Oil and Gas Pipeline and Transportation Automation Industry face during its growth?

    • The expansion of alternative energy sources' utilization poses a significant challenge to the industry's growth trajectory. 

    • The global oil and gas industry is experiencing significant shifts due to escalating investments in various alternative energy sources. Renewable energy sectors, including solar, geothermal, small hydroelectric, biofuels/bioenergy, and nuclear/thermal energy, are gaining traction. This trend is driven by environmental concerns, geopolitical risks, and the desire to reduce energy dependence on a single source. According to industry reports, the adoption of oil and gas pipeline and transportation automation technologies is increasing to optimize operational efficiency and reduce costs. However, these investments in automation are not enough to offset the declining demand for traditional energy sources.
    • The energy landscape is evolving, with countries prioritizing energy diversification and sustainability over reliance on oil and gas. This shift is expected to continue, with renewable energy sources poised to capture a larger market share in the coming years.

    Exclusive Technavio Analysis on Customer Landscape

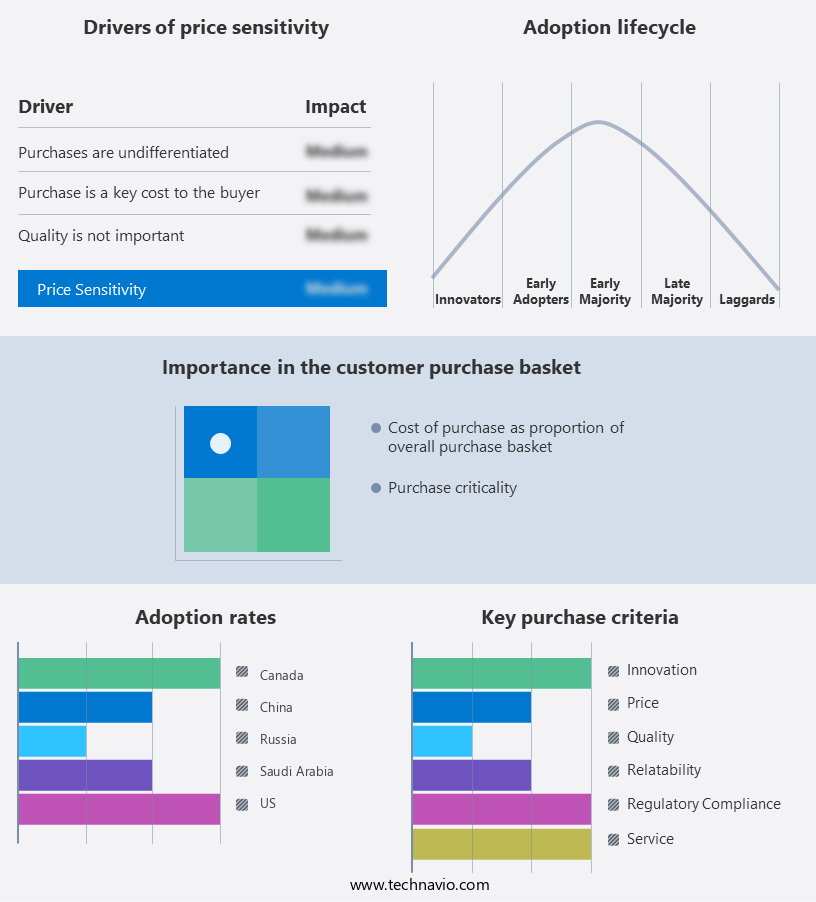
    The oil and gas pipeline and transportation automation market forecasting report includes the adoption lifecycle of the market, covering from the innovator’s stage to the laggard’s stage. It focuses on adoption rates in different regions based on penetration. Furthermore, the oil and gas pipeline and transportation automation market report also includes key purchase criteria and drivers of price sensitivity to help companies evaluate and develop their market growth analysis strategies.

    Oil and Gas Pipeline and Transportation Automation Market Share by Geography

     Customer Landscape of Oil and Gas Pipeline and Transportation Automation Industry

    Competitive Landscape

    Companies are implementing various strategies, such as strategic alliances, oil and gas pipeline and transportation automation market forecast, partnerships, mergers and acquisitions, geographical expansion, and product/service launches, to enhance their presence in the industry.

    ABB Ltd. - This company specializes in automation technologies for oil and gas pipeline and transportation operations. Their offerings include Distributed Control Systems, Operations Management Software, and SCADAvantage. These solutions enhance efficiency, safety, and productivity in the energy sector through advanced technology applications.

    The industry research and growth report includes detailed analyses of the competitive landscape of the market and information about key companies, including:

    • ABB Ltd.
    • Andritz AG
    • Azbil Corp.
    • Beckhoff Automation GmbH and Co. KG
    • Eaton Corp. Plc
    • Emerson Electric Co.
    • Endress Hauser Group Services AG
    • FANUC Corp.
    • Furukawa Electric Co. Ltd.
    • Honeywell International Inc.
    • INTECH Process Automation Inc.
    • Mitsubishi Electric Corp.
    • OMRON Corp.
    • Robert Bosch GmbH
    • Rockwell Automation Inc.
    • Schneider Electric SE
    • Siemens AG
    • Toshiba Corp.
    • Valmet Corp.
    • Yokogawa Electric Corp.

    Qualitative and quantitative analysis of companies has been conducted to help clients understand the wider business environment as well as the strengths and weaknesses of key industry players. Data is qualitatively analyzed to categorize companies as pure play, category-focused, industry-focused, and diversified; it is quantitatively analyzed to categorize companies as dominant, leading, strong, tentative, and weak.

    Recent Development and News in Oil And Gas Pipeline And Transportation Automation Market

    • In January 2024, Emerson Electric Company, a leading automation technology and engineering firm, announced the launch of its new Ovation MECS Control System for oil and gas pipelines, designed to optimize process control and improve safety (Emerson Electric Company Press Release, 2024).
    • In March 2024, Honeywell International Inc. And Schneider Electric signed a strategic collaboration agreement to integrate Honeywell's Uniformance PHD and Experion Process Knowledge System with Schneider Electric's EcoStruxure for Oil & Gas, enhancing their combined offerings in pipeline automation (Honeywell International Inc. Press Release, 2024).
    • In May 2024, ABB Ltd. Secured a USD100 million contract from Saudi Aramco to provide automation and electrical systems for the Marjan and Berri offshore oil fields, expanding its presence in the Middle East oil and gas sector (ABB Ltd. Press Release, 2024).
    • In February 2025, the U.S. Department of Transportation's Pipeline and Hazardous Materials Safety Administration (PHMSA) approved the use of advanced automation technologies, including artificial intelligence and machine learning, for pipeline leak detection and response, promoting increased safety and efficiency in pipeline operations (U.S. Department of Transportation Press Release, 2025).

    Dive into Technavio’s robust research methodology, blending expert interviews, extensive data synthesis, and validated models for unparalleled Oil and Gas Pipeline and Transportation Automation Market insights. See full methodology.

    Market Scope

    Report Coverage

    Details

    Page number

    180

    Base year

    2023

    Historic period

    2018-2022

    Forecast period

    2024-2028

    Growth momentum & CAGR

    Accelerate at a CAGR of 3.16%

    Market growth 2024-2028

    USD 1.47 billion

    Market structure

    Fragmented

    YoY growth 2023-2024(%)

    2.5

    Key countries

    US, Canada, Saudi Arabia, China, and Russia

    Competitive landscape

    Leading Companies, Market Positioning of Companies, Competitive Strategies, and Industry Risks

    Request Free Sample

    Research Analyst Overview

    • The oil and gas pipeline and transportation market continues to evolve, driven by the need for increased throughput capacity, improved operational efficiency, and enhanced safety regulations. Flow rate optimization and predictive maintenance models are key areas of focus, with automated valve control and pipeline compression playing crucial roles in maximizing throughput. Pressure monitoring sensors and pipeline stress analysis are essential components of pipeline safety regulations, while distributed control systems enable real-time pipeline control and flow assurance strategies. Pipeline risk assessment and operational efficiency metrics are critical for pipeline integrity management and cost reduction. Pipeline simulation software and corrosion detection methods help optimize pipeline network design and selection of pipeline materials.
    • Automated pipeline welding and SCADA system integration are essential for pipeline asset management and hydraulics pipeline design. Geographic information systems and emergency shutdown systems are integral to remote pipeline monitoring and regulatory compliance audits. Smart pipeline technology and real-time pipeline control are transforming the industry, with a growing emphasis on leak detection technology and pipeline inspection tools. The market is expected to grow at a robust rate, with industry experts projecting a 10% annual increase in pipeline transportation demand. For instance, a leading oil and gas company implemented a flow assurance strategy using pipeline simulation software, resulting in a 15% increase in pipeline throughput and a 12% reduction in maintenance costs.
    • This demonstrates the significant impact of technology and automation on pipeline operations and the industry as a whole.

    What are the Key Data Covered in this Oil and Gas Pipeline and Transportation Automation Market Research and Growth Report?

    • What is the expected growth of the Oil and Gas Pipeline and Transportation Automation Market between 2024 and 2028?

      • USD 1.47 billion, at a CAGR of 3.16%

    • What segmentation does the market report cover?

      • The report is segmented by Application (Pipeline, LNG, and terminal), Solution (SCADA, DCS, and PLC), and Geography (North America, APAC, Europe, Middle East and Africa, and South America)

    • Which regions are analyzed in the report?

      • North America, APAC, Europe, Middle East and Africa, and South America

    • What are the key growth drivers and market challenges?

      • Growing expansion of oil terminals, Increasing use of alternative energy sources

    • Who are the major players in the Oil and Gas Pipeline and Transportation Automation Market?

      • ABB Ltd., Andritz AG, Azbil Corp., Beckhoff Automation GmbH and Co. KG, Eaton Corp. Plc, Emerson Electric Co., Endress Hauser Group Services AG, FANUC Corp., Furukawa Electric Co. Ltd., Honeywell International Inc., INTECH Process Automation Inc., Mitsubishi Electric Corp., OMRON Corp., Robert Bosch GmbH, Rockwell Automation Inc., Schneider Electric SE, Siemens AG, Toshiba Corp., Valmet Corp., and Yokogawa Electric Corp.

    Market Research Insights

    • The market is a dynamic and ever-evolving industry, driven by the constant need to enhance operational efficiency and ensure pipeline integrity. Two key areas of focus are pipeline risk management and control system automation. Pipeline risk management incorporates various technologies such as pipeline integrity assessment, operational risk management, control valve automation, real-time data visualization, and automated pipeline operations. For instance, machine learning algorithms are used to analyze historical data and predict potential failures, allowing for preventive maintenance and reducing the risk of costly downtime. Moreover, the industry is expected to grow at a significant pace, with industry experts projecting a 15% compound annual growth rate over the next five years.
    • This growth is attributed to the increasing adoption of advanced technologies like predictive maintenance analytics, maintenance scheduling software, and digital twin technology, which enable more efficient and effective pipeline operations. An example of the impact of these technologies can be seen in a major pipeline operator, which experienced a 20% reduction in maintenance costs after implementing a data analytics platform and remote monitoring dashboard system. This allowed for real-time monitoring of pipeline performance and proactive identification of potential issues, resulting in fewer unscheduled shutdowns and reduced maintenance expenses.

    We can help! Our analysts can customize this oil and gas pipeline and transportation automation market research report to meet your requirements.

    Get in touch

    1 Executive Summary

    • 1.1 Market overview
      • Exhibit 01: Executive Summary – Chart on Market Overview
      • Exhibit 02: Executive Summary – Data Table on Market Overview
      • Exhibit 03: Executive Summary – Chart on Global Market Characteristics
      • Exhibit 04: Executive Summary – Chart on Market by Geography
      • Exhibit 05: Executive Summary – Chart on Market Segmentation by Application
      • Exhibit 06: Executive Summary – Chart on Market Segmentation by Solution
      • Exhibit 07: Executive Summary – Chart on Incremental Growth
      • Exhibit 08: Executive Summary – Data Table on Incremental Growth
      • Exhibit 09: Executive Summary – Chart on Vendor Market Positioning

    2 Market Landscape

    • 2.1 Market ecosystem
      • Exhibit 10: Parent market
      • Exhibit 11: Market Characteristics

    3 Market Sizing

    • 3.1 Market definition
      • Exhibit 12: Offerings of vendors included in the market definition
    • 3.2 Market segment analysis
      • Exhibit 13: Market segments
    • 3.3 Market size 2023
      • 3.4 Market outlook: Forecast for 2023-2028
        • Exhibit 14: Chart on Global - Market size and forecast 2023-2028 ($ billion)
        • Exhibit 15: Data Table on Global - Market size and forecast 2023-2028 ($ billion)
        • Exhibit 16: Chart on Global Market: Year-over-year growth 2023-2028 (%)
        • Exhibit 17: Data Table on Global Market: Year-over-year growth 2023-2028 (%)

      4 Historic Market Size

      • 4.1 Global oil and gas pipeline and transportation automation market 2018 - 2022
        • Exhibit 18: Historic Market Size – Data Table on global oil and gas pipeline and transportation automation market 2018 - 2022 ($ billion)
      • 4.2 Application Segment Analysis 2018 - 2022
        • Exhibit 19: Historic Market Size – Application Segment 2018 - 2022 ($ billion)
      • 4.3 Solution Segment Analysis 2018 - 2022
        • Exhibit 20: Historic Market Size – Solution Segment 2018 - 2022 ($ billion)
      • 4.4 Geography Segment Analysis 2018 - 2022
        • Exhibit 21: Historic Market Size – Geography Segment 2018 - 2022 ($ billion)
      • 4.5 Country Segment Analysis 2018 - 2022
        • Exhibit 22: Historic Market Size – Country Segment 2018 - 2022 ($ billion)

      5 Five Forces Analysis

      • 5.1 Five forces summary
        • Exhibit 23: Five forces analysis - Comparison between 2023 and 2028
      • 5.2 Bargaining power of buyers
        • Exhibit 24: Chart on Bargaining power of buyers – Impact of key factors 2023 and 2028
      • 5.3 Bargaining power of suppliers
        • Exhibit 25: Bargaining power of suppliers – Impact of key factors in 2023 and 2028
      • 5.4 Threat of new entrants
        • Exhibit 26: Threat of new entrants – Impact of key factors in 2023 and 2028
      • 5.5 Threat of substitutes
        • Exhibit 27: Threat of substitutes – Impact of key factors in 2023 and 2028
      • 5.6 Threat of rivalry
        • Exhibit 28: Threat of rivalry – Impact of key factors in 2023 and 2028
      • 5.7 Market condition
        • Exhibit 29: Chart on Market condition - Five forces 2023 and 2028

      6 Market Segmentation by Application

      • 6.1 Market segments
        • Exhibit 30: Chart on Application - Market share 2023-2028 (%)
        • Exhibit 31: Data Table on Application - Market share 2023-2028 (%)
      • 6.2 Comparison by Application
        • Exhibit 32: Chart on Comparison by Application
        • Exhibit 33: Data Table on Comparison by Application
      • 6.3 Pipeline - Market size and forecast 2023-2028
        • Exhibit 34: Chart on Pipeline - Market size and forecast 2023-2028 ($ billion)
        • Exhibit 35: Data Table on Pipeline - Market size and forecast 2023-2028 ($ billion)
        • Exhibit 36: Chart on Pipeline - Year-over-year growth 2023-2028 (%)
        • Exhibit 37: Data Table on Pipeline - Year-over-year growth 2023-2028 (%)
      • 6.4 LNG and terminal - Market size and forecast 2023-2028
        • Exhibit 38: Chart on LNG and terminal - Market size and forecast 2023-2028 ($ billion)
        • Exhibit 39: Data Table on LNG and terminal - Market size and forecast 2023-2028 ($ billion)
        • Exhibit 40: Chart on LNG and terminal - Year-over-year growth 2023-2028 (%)
        • Exhibit 41: Data Table on LNG and terminal - Year-over-year growth 2023-2028 (%)
      • 6.5 Market opportunity by Application
        • Exhibit 42: Market opportunity by Application ($ billion)
        • Exhibit 43: Data Table on Market opportunity by Application ($ billion)

      7 Market Segmentation by Solution

      • 7.1 Market segments
        • Exhibit 44: Chart on Solution - Market share 2023-2028 (%)
        • Exhibit 45: Data Table on Solution - Market share 2023-2028 (%)
      • 7.2 Comparison by Solution
        • Exhibit 46: Chart on Comparison by Solution
        • Exhibit 47: Data Table on Comparison by Solution
      • 7.3 SCADA - Market size and forecast 2023-2028
        • Exhibit 48: Chart on SCADA - Market size and forecast 2023-2028 ($ billion)
        • Exhibit 49: Data Table on SCADA - Market size and forecast 2023-2028 ($ billion)
        • Exhibit 50: Chart on SCADA - Year-over-year growth 2023-2028 (%)
        • Exhibit 51: Data Table on SCADA - Year-over-year growth 2023-2028 (%)
      • 7.4 DCS - Market size and forecast 2023-2028
        • Exhibit 52: Chart on DCS - Market size and forecast 2023-2028 ($ billion)
        • Exhibit 53: Data Table on DCS - Market size and forecast 2023-2028 ($ billion)
        • Exhibit 54: Chart on DCS - Year-over-year growth 2023-2028 (%)
        • Exhibit 55: Data Table on DCS - Year-over-year growth 2023-2028 (%)
      • 7.5 PLC - Market size and forecast 2023-2028
        • Exhibit 56: Chart on PLC - Market size and forecast 2023-2028 ($ billion)
        • Exhibit 57: Data Table on PLC - Market size and forecast 2023-2028 ($ billion)
        • Exhibit 58: Chart on PLC - Year-over-year growth 2023-2028 (%)
        • Exhibit 59: Data Table on PLC - Year-over-year growth 2023-2028 (%)
      • 7.6 Market opportunity by Solution
        • Exhibit 60: Market opportunity by Solution ($ billion)
        • Exhibit 61: Data Table on Market opportunity by Solution ($ billion)

      8 Customer Landscape

      • 8.1 Customer landscape overview
        • Exhibit 62: Analysis of price sensitivity, lifecycle, customer purchase basket, adoption rates, and purchase criteria

      9 Geographic Landscape

      • 9.1 Geographic segmentation
        • Exhibit 63: Chart on Market share by geography 2023-2028 (%)
        • Exhibit 64: Data Table on Market share by geography 2023-2028 (%)
      • 9.2 Geographic comparison
        • Exhibit 65: Chart on Geographic comparison
        • Exhibit 66: Data Table on Geographic comparison
      • 9.3 North America - Market size and forecast 2023-2028
        • Exhibit 67: Chart on North America - Market size and forecast 2023-2028 ($ billion)
        • Exhibit 68: Data Table on North America - Market size and forecast 2023-2028 ($ billion)
        • Exhibit 69: Chart on North America - Year-over-year growth 2023-2028 (%)
        • Exhibit 70: Data Table on North America - Year-over-year growth 2023-2028 (%)
      • 9.4 APAC - Market size and forecast 2023-2028
        • Exhibit 71: Chart on APAC - Market size and forecast 2023-2028 ($ billion)
        • Exhibit 72: Data Table on APAC - Market size and forecast 2023-2028 ($ billion)
        • Exhibit 73: Chart on APAC - Year-over-year growth 2023-2028 (%)
        • Exhibit 74: Data Table on APAC - Year-over-year growth 2023-2028 (%)
      • 9.5 Europe - Market size and forecast 2023-2028
        • Exhibit 75: Chart on Europe - Market size and forecast 2023-2028 ($ billion)
        • Exhibit 76: Data Table on Europe - Market size and forecast 2023-2028 ($ billion)
        • Exhibit 77: Chart on Europe - Year-over-year growth 2023-2028 (%)
        • Exhibit 78: Data Table on Europe - Year-over-year growth 2023-2028 (%)
      • 9.6 Middle East and Africa - Market size and forecast 2023-2028
        • Exhibit 79: Chart on Middle East and Africa - Market size and forecast 2023-2028 ($ billion)
        • Exhibit 80: Data Table on Middle East and Africa - Market size and forecast 2023-2028 ($ billion)
        • Exhibit 81: Chart on Middle East and Africa - Year-over-year growth 2023-2028 (%)
        • Exhibit 82: Data Table on Middle East and Africa - Year-over-year growth 2023-2028 (%)
      • 9.7 South America - Market size and forecast 2023-2028
        • Exhibit 83: Chart on South America - Market size and forecast 2023-2028 ($ billion)
        • Exhibit 84: Data Table on South America - Market size and forecast 2023-2028 ($ billion)
        • Exhibit 85: Chart on South America - Year-over-year growth 2023-2028 (%)
        • Exhibit 86: Data Table on South America - Year-over-year growth 2023-2028 (%)
      • 9.8 US - Market size and forecast 2023-2028
        • Exhibit 87: Chart on US - Market size and forecast 2023-2028 ($ billion)
        • Exhibit 88: Data Table on US - Market size and forecast 2023-2028 ($ billion)
        • Exhibit 89: Chart on US - Year-over-year growth 2023-2028 (%)
        • Exhibit 90: Data Table on US - Year-over-year growth 2023-2028 (%)
      • 9.9 China - Market size and forecast 2023-2028
        • Exhibit 91: Chart on China - Market size and forecast 2023-2028 ($ billion)
        • Exhibit 92: Data Table on China - Market size and forecast 2023-2028 ($ billion)
        • Exhibit 93: Chart on China - Year-over-year growth 2023-2028 (%)
        • Exhibit 94: Data Table on China - Year-over-year growth 2023-2028 (%)
      • 9.10 Canada - Market size and forecast 2023-2028
        • Exhibit 95: Chart on Canada - Market size and forecast 2023-2028 ($ billion)
        • Exhibit 96: Data Table on Canada - Market size and forecast 2023-2028 ($ billion)
        • Exhibit 97: Chart on Canada - Year-over-year growth 2023-2028 (%)
        • Exhibit 98: Data Table on Canada - Year-over-year growth 2023-2028 (%)
      • 9.11 Russia - Market size and forecast 2023-2028
        • Exhibit 99: Chart on Russia - Market size and forecast 2023-2028 ($ billion)
        • Exhibit 100: Data Table on Russia - Market size and forecast 2023-2028 ($ billion)
        • Exhibit 101: Chart on Russia - Year-over-year growth 2023-2028 (%)
        • Exhibit 102: Data Table on Russia - Year-over-year growth 2023-2028 (%)
      • 9.12 Saudi Arabia - Market size and forecast 2023-2028
        • Exhibit 103: Chart on Saudi Arabia - Market size and forecast 2023-2028 ($ billion)
        • Exhibit 104: Data Table on Saudi Arabia - Market size and forecast 2023-2028 ($ billion)
        • Exhibit 105: Chart on Saudi Arabia - Year-over-year growth 2023-2028 (%)
        • Exhibit 106: Data Table on Saudi Arabia - Year-over-year growth 2023-2028 (%)
      • 9.13 Market opportunity by geography
        • Exhibit 107: Market opportunity by geography ($ billion)
        • Exhibit 108: Data Tables on Market opportunity by geography ($ billion)

      10 Drivers, Challenges, and Trends

      • 10.1 Market drivers
        • 10.2 Market challenges
          • 10.3 Impact of drivers and challenges
            • Exhibit 109: Impact of drivers and challenges in 2023 and 2028
          • 10.4 Market trends

            11 Vendor Landscape

            • 11.1 Overview
              • 11.2 Vendor landscape
                • Exhibit 110: Overview on Criticality of inputs and Factors of differentiation
              • 11.3 Landscape disruption
                • Exhibit 111: Overview on factors of disruption
              • 11.4 Industry risks
                • Exhibit 112: Impact of key risks on business

              12 Vendor Analysis

              • 12.1 Vendors covered
                • Exhibit 113: Vendors covered
              • 12.2 Market positioning of vendors
                • Exhibit 114: Matrix on vendor position and classification
              • 12.3 ABB Ltd.
                • Exhibit 115: ABB Ltd. - Overview
                • Exhibit 116: ABB Ltd. - Business segments
                • Exhibit 117: ABB Ltd. - Key offerings
                • Exhibit 118: ABB Ltd. - Segment focus
              • 12.4 Andritz AG
                • Exhibit 119: Andritz AG - Overview
                • Exhibit 120: Andritz AG - Business segments
                • Exhibit 121: Andritz AG - Key news
                • Exhibit 122: Andritz AG - Key offerings
                • Exhibit 123: Andritz AG - Segment focus
              • 12.5 Azbil Corp.
                • Exhibit 124: Azbil Corp. - Overview
                • Exhibit 125: Azbil Corp. - Business segments
                • Exhibit 126: Azbil Corp. - Key news
                • Exhibit 127: Azbil Corp. - Key offerings
                • Exhibit 128: Azbil Corp. - Segment focus
              • 12.6 Beckhoff Automation GmbH and Co. KG
                • Exhibit 129: Beckhoff Automation GmbH and Co. KG - Overview
                • Exhibit 130: Beckhoff Automation GmbH and Co. KG - Product / Service
                • Exhibit 131: Beckhoff Automation GmbH and Co. KG - Key offerings
              • 12.7 Eaton Corp. Plc
                • Exhibit 132: Eaton Corp. Plc - Overview
                • Exhibit 133: Eaton Corp. Plc - Business segments
                • Exhibit 134: Eaton Corp. Plc - Key news
                • Exhibit 135: Eaton Corp. Plc - Key offerings
                • Exhibit 136: Eaton Corp. Plc - Segment focus
              • 12.8 Emerson Electric Co.
                • Exhibit 137: Emerson Electric Co. - Overview
                • Exhibit 138: Emerson Electric Co. - Business segments
                • Exhibit 139: Emerson Electric Co. - Key news
                • Exhibit 140: Emerson Electric Co. - Key offerings
                • Exhibit 141: Emerson Electric Co. - Segment focus
              • 12.9 FANUC Corp.
                • Exhibit 142: FANUC Corp. - Overview
                • Exhibit 143: FANUC Corp. - Product / Service
                • Exhibit 144: FANUC Corp. - Key offerings
              • 12.10 Honeywell International Inc.
                • Exhibit 145: Honeywell International Inc. - Overview
                • Exhibit 146: Honeywell International Inc. - Business segments
                • Exhibit 147: Honeywell International Inc. - Key news
                • Exhibit 148: Honeywell International Inc. - Key offerings
                • Exhibit 149: Honeywell International Inc. - Segment focus
              • 12.11 Mitsubishi Electric Corp.
                • Exhibit 150: Mitsubishi Electric Corp. - Overview
                • Exhibit 151: Mitsubishi Electric Corp. - Business segments
                • Exhibit 152: Mitsubishi Electric Corp. - Key news
                • Exhibit 153: Mitsubishi Electric Corp. - Key offerings
                • Exhibit 154: Mitsubishi Electric Corp. - Segment focus
              • 12.12 OMRON Corp.
                • Exhibit 155: OMRON Corp. - Overview
                • Exhibit 156: OMRON Corp. - Business segments
                • Exhibit 157: OMRON Corp. - Key news
                • Exhibit 158: OMRON Corp. - Key offerings
                • Exhibit 159: OMRON Corp. - Segment focus
              • 12.13 Robert Bosch GmbH
                • Exhibit 160: Robert Bosch GmbH - Overview
                • Exhibit 161: Robert Bosch GmbH - Business segments
                • Exhibit 162: Robert Bosch GmbH - Key news
                • Exhibit 163: Robert Bosch GmbH - Key offerings
                • Exhibit 164: Robert Bosch GmbH - Segment focus
              • 12.14 Rockwell Automation Inc.
                • Exhibit 165: Rockwell Automation Inc. - Overview
                • Exhibit 166: Rockwell Automation Inc. - Business segments
                • Exhibit 167: Rockwell Automation Inc. - Key news
                • Exhibit 168: Rockwell Automation Inc. - Key offerings
                • Exhibit 169: Rockwell Automation Inc. - Segment focus
              • 12.15 Schneider Electric SE
                • Exhibit 170: Schneider Electric SE - Overview
                • Exhibit 171: Schneider Electric SE - Business segments
                • Exhibit 172: Schneider Electric SE - Key news
                • Exhibit 173: Schneider Electric SE - Key offerings
                • Exhibit 174: Schneider Electric SE - Segment focus
              • 12.16 Siemens AG
                • Exhibit 175: Siemens AG - Overview
                • Exhibit 176: Siemens AG - Business segments
                • Exhibit 177: Siemens AG - Key news
                • Exhibit 178: Siemens AG - Key offerings
                • Exhibit 179: Siemens AG - Segment focus
              • 12.17 Yokogawa Electric Corp.
                • Exhibit 180: Yokogawa Electric Corp. - Overview
                • Exhibit 181: Yokogawa Electric Corp. - Business segments
                • Exhibit 182: Yokogawa Electric Corp. - Key offerings
                • Exhibit 183: Yokogawa Electric Corp. - Segment focus

              13 Appendix

              • 13.1 Scope of the report
                • 13.2 Inclusions and exclusions checklist
                  • Exhibit 184: Inclusions checklist
                  • Exhibit 185: Exclusions checklist
                • 13.3 Currency conversion rates for US$
                  • Exhibit 186: Currency conversion rates for US$
                • 13.4 Research methodology
                  • Exhibit 187: Research methodology
                  • Exhibit 188: Validation techniques employed for market sizing
                  • Exhibit 189: Information sources
                • 13.5 List of abbreviations
                  • Exhibit 190: List of abbreviations

                Research Methodology

                Technavio presents a detailed picture of the market by way of study, synthesis, and summation of data from multiple sources. The analysts have presented the various facets of the market with a particular focus on identifying the key industry influencers. The data thus presented is comprehensive, reliable, and the result of extensive research, both primary and secondary.

                INFORMATION SOURCES

                Primary sources

                • Manufacturers and suppliers
                • Channel partners
                • Industry experts
                • Strategic decision makers

                Secondary sources

                • Industry journals and periodicals
                • Government data
                • Financial reports of key industry players
                • Historical data
                • Press releases

                DATA ANALYSIS

                Data Synthesis

                • Collation of data
                • Estimation of key figures
                • Analysis of derived insights

                Data Validation

                • Triangulation with data models
                • Reference against proprietary databases
                • Corroboration with industry experts

                REPORT WRITING

                Qualitative

                • Market drivers
                • Market challenges
                • Market trends
                • Five forces analysis

                Quantitative

                • Market size and forecast
                • Market segmentation
                • Geographical insights
                • Competitive landscape

                Interested in this report?

                Get your sample now to see our research methodology and insights!

                Download Now

                Frequently Asked Questions

                Oil and Gas Pipeline and Transportation Automation market growth will increase by $ 1.47 bn during 2024-2028.

                The Oil and Gas Pipeline and Transportation Automation market is expected to grow at a CAGR of 3.16% during 2024-2028.

                Oil and Gas Pipeline and Transportation Automation market is segmented by Application( Pipeline, LNG, terminal) Solution( SCADA, DCS, PLC, Middle East and Africa, South America)

                ABB Ltd., Andritz AG, Azbil Corp., Beckhoff Automation GmbH and Co. KG, Eaton Corp. Plc, Emerson Electric Co., Endress Hauser Group Services AG, FANUC Corp., Furukawa Electric Co. Ltd., Honeywell International Inc., INTECH Process Automation Inc., Mitsubishi Electric Corp., OMRON Corp., Robert Bosch GmbH, Rockwell Automation Inc., Schneider Electric SE, Siemens AG, Toshiba Corp., Valmet Corp., Yokogawa Electric Corp. are a few of the key vendors in the Oil and Gas Pipeline and Transportation Automation market.

                APAC will register the highest growth rate of 30% among the other regions. Therefore, the Oil and Gas Pipeline and Transportation Automation market in APAC is expected to garner significant business opportunities for the vendors during the forecast period.

                US, Canada, Saudi Arabia, China, Russia

                • Growing expansion of oil terminalsOil terminals support the oil and gas supply chain by storing crude oil and petroleum products. Moreover is the driving factor this market.
                • they serve as centers for oil and gas transportation. Globally is the driving factor this market.
                • the rising energy demand has resulted in an increase in new oil terminal and pipeline constructions (including oil and gas pipeline and transportation automation) is the driving factor this market.
                • especially in APAC and Africa is the driving factor this market.
                • where the continuous need for energy is demanding new oil and gas infrastructure. Some of the oil terminal projects are mentioned below: In September 2021 is the driving factor this market.
                • Saudi Aramco declared a significant extension of its modern speculation program is the driving factor this market.
                • Aramco Namaat is the driving factor this market.
                • with the marking of 22 new Reminder of Grasping (MoUs) and one joint endeavor (JV) understanding zeroed in on limit working in four key areas: advanced materials is the driving factor this market.
                • technology is the driving factor this market.
                • industrial and energy services is the driving factor this market.
                • and sustainability In July 2021 is the driving factor this market.
                • Indias petroleum regulator authorized 33 is the driving factor this market.
                • 764 km of natural gas pipeline network for the countrys gas grid002E In April 2021 is the driving factor this market.
                • Saudi Aramco resumed its development work on three offshore crude expansion projects that will provide an additional 1.15mn b/d of capacity by 2024. The projects were put on a halt due to the COVID-19 pandemic. In September 2020 is the driving factor this market.
                • A tripartite Memorandum of Understanding was entered into by NRL with Paradip Port Trust and Dredging Corporation of India for the reclamation of the 200 acres of land allotted to NRL for setting up its Crude Oil import terminal at Paradip Port. In July 2020 is the driving factor this market.
                • Fujairah Oil Terminal finalized plans to increase its storage capacity by 10% at the Port of Fujairah and connect its entire terminal is the driving factor this market.
                • including crude oil storage tanks is the driving factor this market.
                • to the VLCC jetty. These new oil and gas exploration and production activities is the driving factor this market.
                • along with improved and efficient pipelines for oil and gas transportation is the driving factor this market.
                • will drive the growth of the market in focus during the forecast period. is the driving factor this market.

                The Oil and Gas Pipeline and Transportation Automation market vendors should focus on grabbing business opportunities from the Pipeline segment as it accounted for the largest market share in the base year.
                RIA - Research AI Assistant
                Ask RIA