Oleochemicals Market Analysis, Size, and Forecast 2026-2030: APAC (China, India, and Japan), North America (US, Canada, and Mexico), Europe (Germany, France, and UK), Middle East and Africa (Saudi Arabia, South Africa, and UAE), South America (Brazil, Argentina, and Colombia), and Rest of World (ROW)

Oleochemicals Market Analysis, Size, and Forecast 2026-2030:
APAC (China, India, and Japan), North America (US, Canada, and Mexico), Europe (Germany, France, and UK), Middle East and Africa (Saudi Arabia, South Africa, and UAE), South America (Brazil, Argentina, and Colombia), and Rest of World (ROW)

Published: Dec 2025 311 Pages SKU: IRTNTR70600

Market Overview at a Glance

$12.00 B
Market Opportunity
6.3%
CAGR 2025 - 2030
65.5%
APAC Growth
$16.41 B
Fatty acids segment 2024

Oleochemicals Market Size 2026-2030

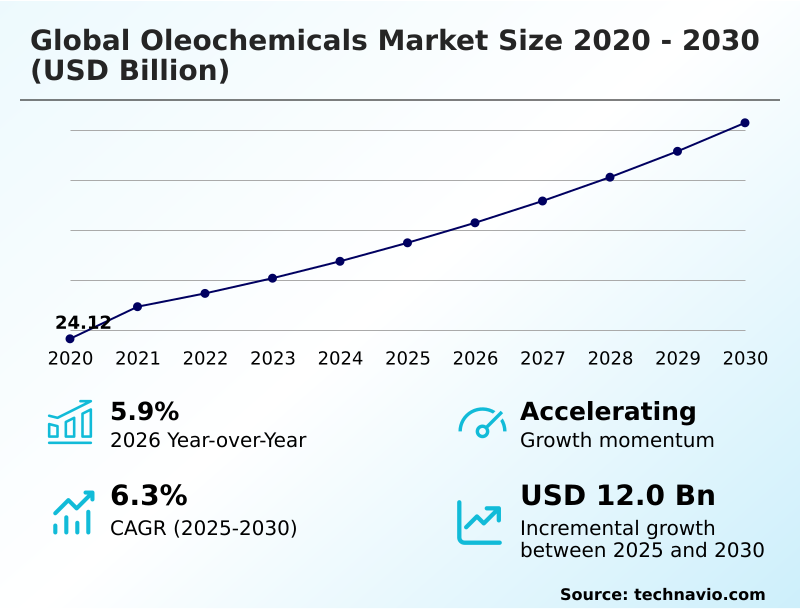
The oleochemicals market size is valued to increase by USD 12.00 billion, at a CAGR of 6.3% from 2025 to 2030. Growth of packaged food and beverage industry will drive the oleochemicals market.

Major Market Trends & Insights

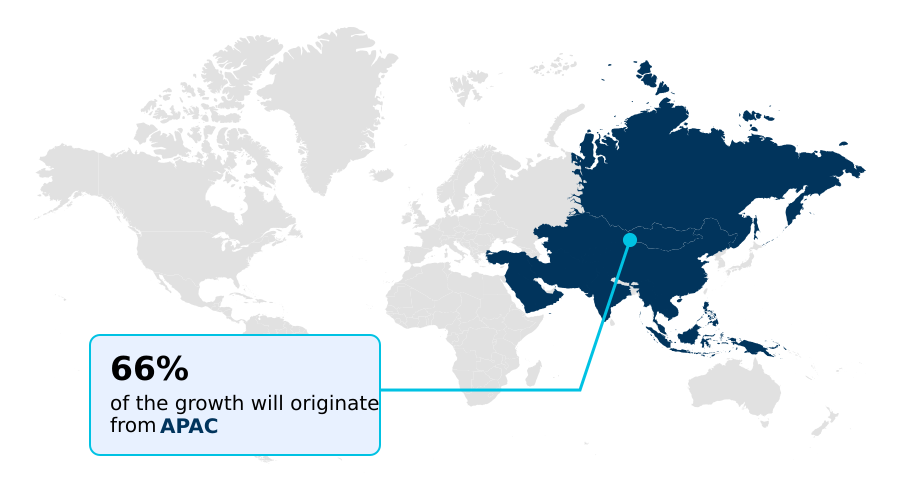
  • APAC dominated the market and accounted for a 65.5% growth during the forecast period.
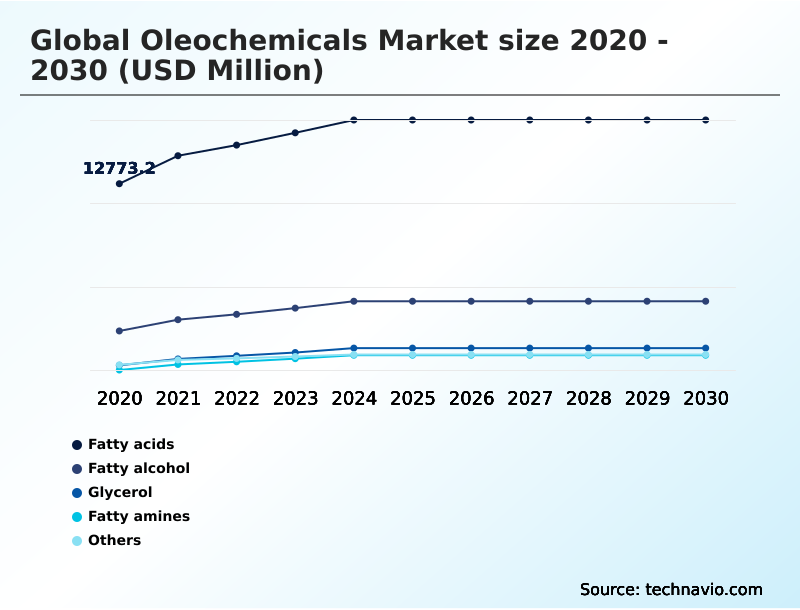
  • By Product - Fatty acids segment was valued at USD 16.41 billion in 2024
  • By Application - Soaps and detergents segment accounted for the largest market revenue share in 2024

Market Size & Forecast

  • Market Opportunities: USD 21.59 billion
  • Market Future Opportunities: USD 12.00 billion
  • CAGR from 2025 to 2030 : 6.3%

Market Summary

  • The oleochemicals market is fundamentally driven by the global shift toward sustainability and green chemistry. Derived from renewable feedstocks such as vegetable oils and animal fats, these compounds are central to replacing petroleum-based products in a multitude of applications. Core products, including fatty acids, fatty alcohols, and glycerol, are produced through processes like hydrolysis and esterification.
  • Key industry trends include the rising demand for biosurfactants and bio-lubricants, which offer enhanced biodegradability. For instance, a cosmetics manufacturer might reformulate its entire skincare line to use only plant-derived ingredients and oleochemical-based emulsifiers to meet consumer demand for clean-label products, thereby improving brand perception and market share.
  • However, the industry grapples with challenges like the volatility of feedstock prices, influenced by competition from the biofuel sector and climatic conditions affecting crop yields. The demand for sustainable sourcing and supply chain transparency is also reshaping operational strategies, pushing producers toward certified raw materials like sustainable palm oil to comply with international regulations and corporate social responsibility standards.
  • This dynamic environment necessitates continuous innovation in both production technology and application development.

What will be the Size of the Oleochemicals Market during the forecast period?

Get Key Insights on Market Forecast (PDF) Request Free Sample

How is the Oleochemicals Market Segmented?

The oleochemicals industry research report provides comprehensive data (region-wise segment analysis), with forecasts and estimates in "USD million" for the period 2026-2030, as well as historical data from 2020-2024 for the following segments.

  • Product
    • Fatty acids
    • Fatty alcohol
    • Glycerol
    • Fatty amines
    • Others
  • Application
    • Soaps and detergents
    • Polymers
    • Personal care and pharmaceuticals
    • Lubricants and greases
    • Others
  • Source
    • Vegetable oils
    • Animal fats
  • Geography
    • APAC
      • China
      • India
      • Japan
    • North America
      • US
      • Canada
      • Mexico
    • Europe
      • Germany
      • France
      • UK
    • Middle East and Africa
      • Saudi Arabia
      • South Africa
      • UAE
    • South America
      • Brazil
      • Argentina
      • Colombia
    • Rest of World (ROW)

By Product Insights

The fatty acids segment is estimated to witness significant growth during the forecast period.

The oleochemicals market is segmented by product, application, and source, reflecting its integration into diverse industrial value chains. Product-wise, the market includes fatty acids, fatty alcohols, and glycerol, which are foundational components.

Key applications such as soaps, detergents, personal care, and polymers define demand-side segmentation. Sourcing from vegetable oils and animal fats creates another critical market division.

The fatty acids segment, crucial for manufacturing surfactants and emulsifiers, is experiencing a consistent year-over-year growth of 5.9%.

This segmentation underscores the industry's reliance on renewable feedstocks like tallow and palm oil and its role in fostering a circular economy through bio-based alternatives and the use of byproducts from hydrogenation and esterification processes.

Request Free Sample

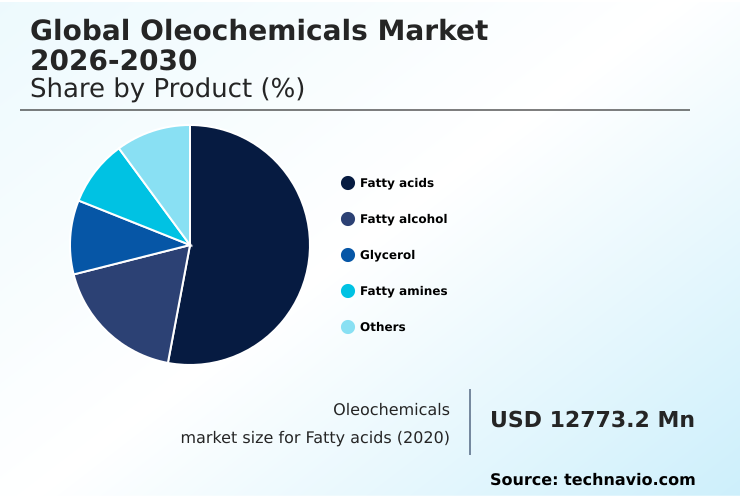
The Fatty acids segment was valued at USD 16.41 billion in 2024 and showed a gradual increase during the forecast period.

Request Free Sample

Regional Analysis

APAC is estimated to contribute 65.5% to the growth of the global market during the forecast period.Technavio’s analysts have elaborately explained the regional trends and drivers that shape the market during the forecast period.

See How Oleochemicals Market Demand is Rising in APAC Request Free Sample

The geographic landscape of the oleochemicals market is dominated by the APAC region, which accounts for the majority of global production and consumption. This leadership is built on access to abundant renewable feedstocks like palm oil and coconut oil.

The region is projected to contribute 65.5% of the market's incremental growth, driven by rapid industrialization and rising consumer demand for personal care ingredients.

Regional dynamics are also shaped by government initiatives, such as Indonesia's biofuel mandate, which impacts feedstock availability.

In contrast, North America and Europe are mature markets focused on high-value specialty esters and bio-polymers, with an emphasis on sustainable sourcing and supply chain transparency.

These regions leverage advanced hydrogenation and hydrolysis technologies to produce specialized oleochemicals, including stearic acid, for niche applications.

Market Dynamics

Our researchers analyzed the data with 2025 as the base year, along with the key drivers, trends, and challenges. A holistic analysis of drivers will help companies refine their marketing strategies to gain a competitive advantage.

  • The global oleochemicals market 2026-2030 is increasingly shaped by the dual pressures of sustainability and performance, with long-term growth tied to innovation in green chemistry. Using oleochemicals in paper recycling is a prime example, where these bio-based agents help de-ink paper more efficiently, with some facilities reporting energy consumption reductions of over 20% compared to virgin pulp methods.
  • Similarly, the environmental benefits of oleochemical surfactants are driving their adoption over petrochemical-based alternatives. The growth of biosurfactants from oleochemicals is a key trend, particularly as consumer demand for natural ingredients intensifies. Oleochemicals' role in green chemistry extends to their use in creating sustainable lubricants, where oleochemical applications in personal care are already well-established.
  • Manufacturers are focused on developing new formulations, as seen in the push for oleochemicals versus petrochemicals in polymers, where bio-based options offer a lower carbon footprint. However, challenges in oleochemical feedstock supply, stemming from competition with biofuels and agricultural uncertainties, remain a significant hurdle.
  • This has amplified the focus on both vegetable oils as oleochemical feedstock and animal fats for fatty acid production. The impact of biodiesel on glycerol supply continues to reshape the market, leading to innovations in glycerol purification for pharmaceutical use and the use of fatty amines in agrochemicals.
  • Ultimately, the market for fatty acids for soap and detergent production remains a foundational demand driver.

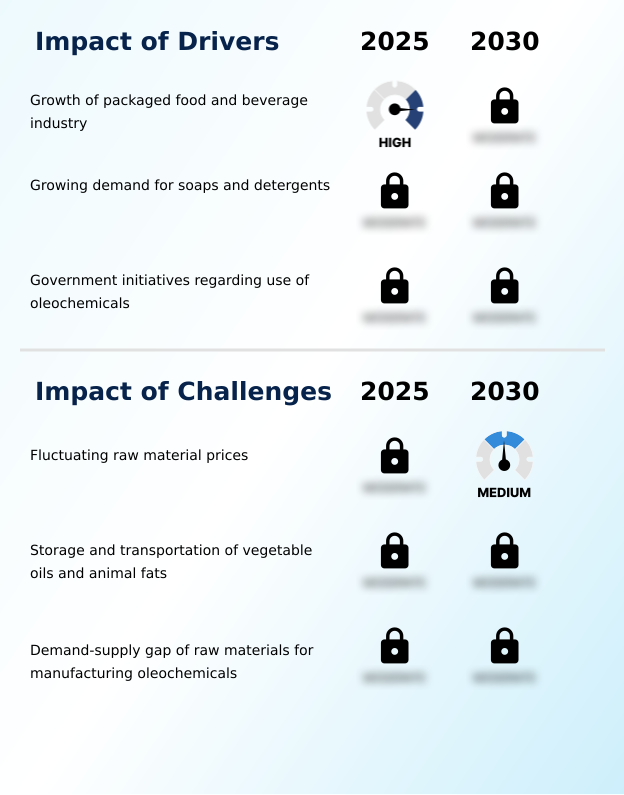
What are the key market drivers leading to the rise in the adoption of Oleochemicals Industry?

  • A key market driver is the growth of the packaged food and beverage industry, which utilizes oleochemicals as essential emulsifiers and preservatives.

  • Market growth is primarily driven by increasing demand from end-use industries for sustainable ingredients.
  • The soaps and detergents sector remains a major consumer, with a notable shift toward natural surfactants derived from oleochemicals; this transition has resulted in a 20% increase in market penetration for bio-based cleaners in some developed regions.
  • Additionally, the packaged food industry's expansion fuels demand for oleochemical-based emulsifiers and food additives that improve product texture and shelf life. Government initiatives promoting green chemistry and renewable materials provide further momentum.
  • For instance, incentives for bio-lubricants have led to a 10% year-over-year increase in their adoption in environmentally sensitive applications. This regulatory support, coupled with consumer preference for plant-derived ingredients, strengthens the market's growth trajectory.

What are the market trends shaping the Oleochemicals Industry?

  • A significant market trend is the growing demand for biosurfactants, which are gaining prominence as environmentally friendly alternatives to conventional surfactants.

  • Key trends in the oleochemicals market center on sustainability and high-performance bio-based alternatives. The rising demand for biosurfactants is a significant driver, as these compounds offer improved environmental profiles and are increasingly adopted in personal care and cleaning products, enhancing formulation stability by over 15% in certain applications.
  • Another major trend is the expanded use of oleochemicals, including specialty esters, in producing bio-polymers and biodegradable plastics. This shift aligns with circular economy principles and addresses concerns about plastic waste. Furthermore, the use of fatty acid methyl esters (fames) as biodiesel is growing, driven by government mandates for renewable fuels.
  • The use of biodiesel can reduce certain exhaust emissions by up to 50% compared to conventional diesel, creating a substantial, albeit competitive, demand for vegetable oils and animal fats.

What challenges does the Oleochemicals Industry face during its growth?

  • Fluctuating raw material prices present a key challenge that affects the industry's growth trajectory and profitability.

  • The primary challenge confronting the oleochemicals market is the significant volatility of raw material prices. Feedstock costs, which can constitute a large portion of production expenses, are subject to sharp fluctuations, impacting profit margins by as much as 20% in a single quarter.
  • This instability is driven by competition from the biofuel sector for vegetable oils and animal fats, as well as by unpredictable agricultural yields. Furthermore, stringent regulations governing the storage and transportation of these raw materials, such as the SPCC rule, add operational complexity and can increase logistics costs by over 10%.
  • This creates a difficult environment for manufacturers, who must navigate supply chain transparency demands and feedstock diversification strategies to maintain stability. The demand-supply gap for certain feedstocks like tallow further complicates long-term planning.

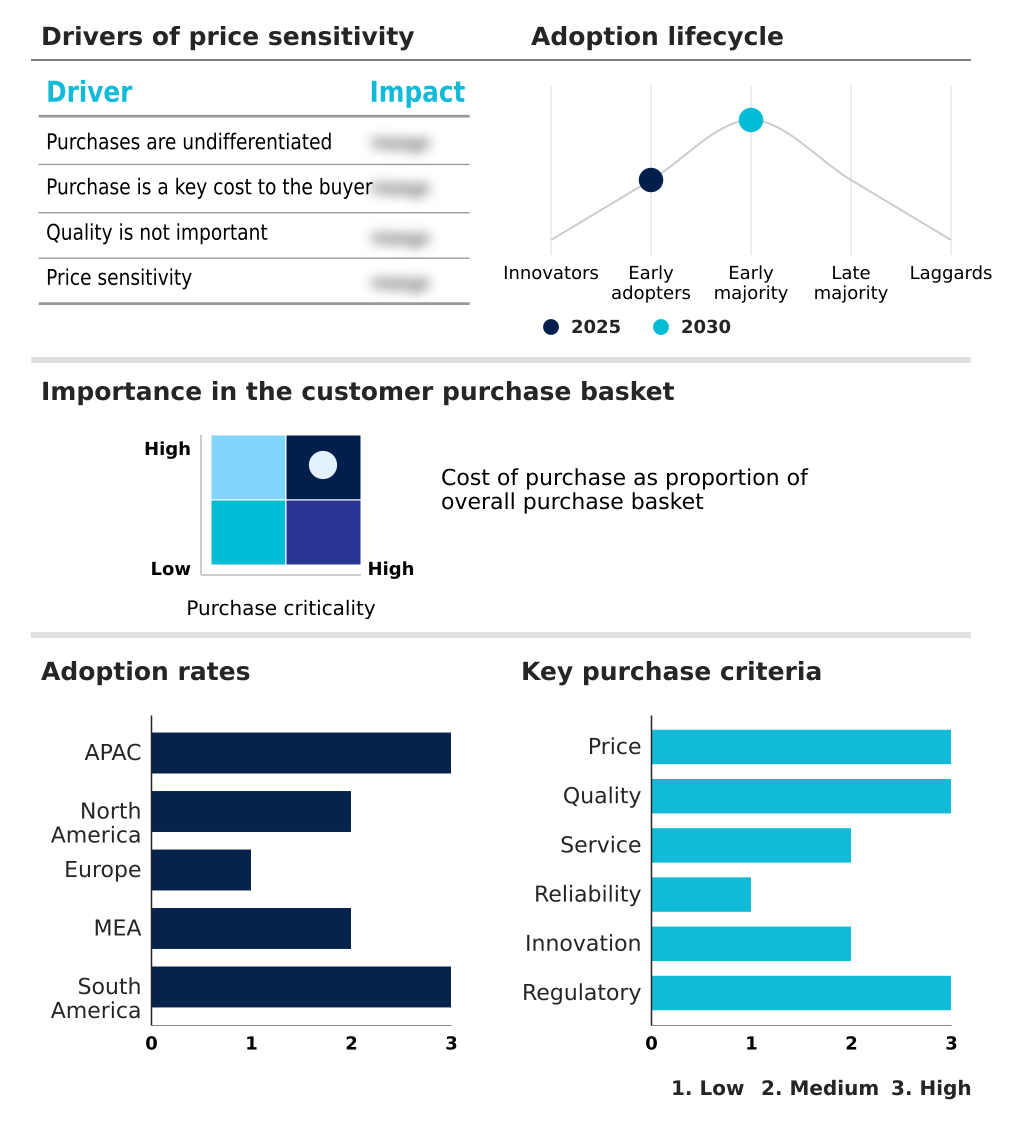
Exclusive Technavio Analysis on Customer Landscape

The oleochemicals market forecasting report includes the adoption lifecycle of the market, covering from the innovator’s stage to the laggard’s stage. It focuses on adoption rates in different regions based on penetration. Furthermore, the oleochemicals market report also includes key purchase criteria and drivers of price sensitivity to help companies evaluate and develop their market growth analysis strategies.

Customer Landscape of Oleochemicals Industry

Competitive Landscape

Companies are implementing various strategies, such as strategic alliances, oleochemicals market forecast, partnerships, mergers and acquisitions, geographical expansion, and product/service launches, to enhance their presence in the industry.

Akzo Nobel NV - Offerings include oleochemicals for metalworking lubricants, plastic additives, and paper production, addressing various industrial application needs.

The industry research and growth report includes detailed analyses of the competitive landscape of the market and information about key companies, including:

  • Akzo Nobel NV
  • BASF SE
  • Berg Schmidt GmbH
  • Cabot Corp.
  • Cargill Inc.
  • Croda International Plc
  • Ecogreen Oleochemicals
  • Emery Oleochemicals
  • Evonik Industries AG
  • Evyap Soap Oil Glycerin
  • Fairchem Organics Ltd.
  • Godrej Industries Ltd.
  • IOI Corp. BHD
  • Kao Corp.
  • KLK Oleo
  • Oleon NV
  • Procter and Gamble Co.
  • Saudi Basic Industries
  • VVF Ltd.
  • Wilmar International Ltd.

Qualitative and quantitative analysis of companies has been conducted to help clients understand the wider business environment as well as the strengths and weaknesses of key industry players. Data is qualitatively analyzed to categorize companies as pure play, category-focused, industry-focused, and diversified; it is quantitatively analyzed to categorize companies as dominant, leading, strong, tentative, and weak.

Recent Development and News in Oleochemicals market

  • In March 2025, the Indonesian government implemented its B40 biodiesel mandate, increasing the required blend of palm-based biodiesel to 40% and intensifying domestic competition for palm oil feedstock.
  • In February 2025, KLK OLEO expanded its presence in South Asia by opening a new representative office in Mumbai, India, to better serve the personal and home care sectors in the subcontinent.
  • In July 2025, Emery Oleochemicals appointed Min Chong as its new Group Chief Executive Officer to guide the company toward enhanced operational efficiency and strategic growth in sustainable chemicals.
  • In October 2025, IOI Group reported it had surpassed its 2025 greenhouse gas emission intensity reduction target one year ahead of schedule, highlighting its commitment to climate initiatives.

Dive into Technavio’s robust research methodology, blending expert interviews, extensive data synthesis, and validated models for unparalleled Oleochemicals Market insights. See full methodology.

Market Scope
Page number 311
Base year 2025
Historic period 2020-2024
Forecast period 2026-2030
Growth momentum & CAGR Accelerate at a CAGR of 6.3%
Market growth 2026-2030 USD 12000.9 million
Market structure Fragmented
YoY growth 2025-2026(%) 5.9%
Key countries China, India, Japan, South Korea, Indonesia, Thailand, US, Canada, Mexico, Germany, France, UK, Italy, Spain, The Netherlands, Saudi Arabia, South Africa, UAE, Egypt, Israel, Brazil, Argentina and Colombia
Competitive landscape Leading Companies, Market Positioning of Companies, Competitive Strategies, and Industry Risks

Request Free Sample

Research Analyst Overview

  • The oleochemicals market is undergoing a significant transformation driven by the imperative for sustainable and bio-based alternatives. Core production relies on renewable feedstocks such as palm oil, tallow, soybean oil, coconut oil, and rapeseed oil, which are processed through hydrolysis, hydrogenation, and esterification to yield foundational chemicals.
  • These include fatty acids like stearic acid, oleic acid, and lauric acid, as well as fatty alcohols and glycerol. These compounds are integral to a wide range of applications, from personal care to industrial manufacturing.
  • A critical boardroom-level concern is supply chain compliance with regulations like the EUDR, which mandates verifiable, deforestation-free sourcing and has led to a re-evaluation of procurement strategies. The industry's shift toward green chemistry is evident in the rising prominence of biosurfactants, bio-lubricants, and bio-polymers, which offer superior biodegradability.
  • For instance, the use of fatty acid methyl esters (fames) in biodiesel production has a direct impact on the availability and pricing of co-products. This intricate supply-demand relationship requires sophisticated operational planning to maintain profitability and meet the evolving demands for sustainable surfactants.

What are the Key Data Covered in this Oleochemicals Market Research and Growth Report?

  • What is the expected growth of the Oleochemicals Market between 2026 and 2030?

    • USD 12.00 billion, at a CAGR of 6.3%

  • What segmentation does the market report cover?

    • The report is segmented by Product (Fatty acids, Fatty alcohol, Glycerol, Fatty amines, and Others), Application (Soaps and detergents, Polymers, Personal care and pharmaceuticals, Lubricants and greases, and Others), Source (Vegetable oils, and Animal fats) and Geography (APAC, North America, Europe, Middle East and Africa, South America)

  • Which regions are analyzed in the report?

    • APAC, North America, Europe, Middle East and Africa and South America

  • What are the key growth drivers and market challenges?

    • Growth of packaged food and beverage industry, Fluctuating raw material prices

  • Who are the major players in the Oleochemicals Market?

    • Akzo Nobel NV, BASF SE, Berg Schmidt GmbH, Cabot Corp., Cargill Inc., Croda International Plc, Ecogreen Oleochemicals, Emery Oleochemicals, Evonik Industries AG, Evyap Soap Oil Glycerin, Fairchem Organics Ltd., Godrej Industries Ltd., IOI Corp. BHD, Kao Corp., KLK Oleo, Oleon NV, Procter and Gamble Co., Saudi Basic Industries, VVF Ltd. and Wilmar International Ltd.

Market Research Insights

  • The oleochemicals market is shaped by a dynamic interplay of cost, performance, and sustainability imperatives. The high contribution of raw materials to final product cost makes procurement efficiency critical, with inputs representing over 40% of expenses in some formulations. Consequently, enterprises are focused on feedstock diversification and securing sustainable sourcing channels to mitigate price volatility.
  • The demand for bio-based alternatives continues to rise, as their adoption can improve end-product environmental profiles, with certain bio-lubricants demonstrating a 90% higher rate of biodegradability than their mineral oil counterparts. This shift supports a circular economy model, where oleochemicals are increasingly used as plasticizers and in the formulation of biodegradable plastics.
  • The market's evolution is driven by the need for functional, renewable solutions across consumer and industrial applications.

We can help! Our analysts can customize this oleochemicals market research report to meet your requirements.

Get in touch

1. Executive Summary

1.1 Market overview

Executive Summary - Chart on Market Overview
Executive Summary - Data Table on Market Overview
Executive Summary - Chart on Global Market Characteristics
Executive Summary - Chart on Market by Geography
Executive Summary - Chart on Market Segmentation by Product
Executive Summary - Chart on Market Segmentation by Application
Executive Summary - Chart on Market Segmentation by Source
Executive Summary - Chart on Incremental Growth
Executive Summary - Data Table on Incremental Growth
Executive Summary - Chart on Company Market Positioning

2. Technavio Analysis

2.1 Analysis of price sensitivity, lifecycle, customer purchase basket, adoption rates, and purchase criteria

2.2 Criticality of inputs and Factors of differentiation

Chart on Overview on criticality of inputs and factors of differentiation

2.3 Factors of disruption

Chart on Overview on factors of disruption

2.4 Impact of drivers and challenges

Chart on Impact of drivers and challenges in 2025 and 2030

3. Market Landscape

3.1 Market ecosystem

Chart on Parent Market
Data Table on - Parent Market

3.2 Market characteristics

Chart on Market characteristics analysis

3.3 Value chain analysis

Chart on Value chain analysis

4. Market Sizing

4.1 Market definition

Data Table on Offerings of companies included in the market definition

4.2 Market segment analysis

Market segments

4.3 Market size 2025

4.4 Market outlook: Forecast for 2025-2030

Chart on Global - Market size and forecast 2025-2030 ($ million)
Data Table on Global - Market size and forecast 2025-2030 ($ million)
Chart on Global Market: Year-over-year growth 2025-2030 (%)
Data Table on Global Market: Year-over-year growth 2025-2030 (%)

5. Historic Market Size

5.1 Global Oleochemicals Market 2020 - 2024

Historic Market Size - Data Table on Global Oleochemicals Market 2020 - 2024 ($ million)

5.2 Product segment analysis 2020 - 2024

Historic Market Size - Product Segment 2020 - 2024 ($ million)

5.3 Application segment analysis 2020 - 2024

Historic Market Size - Application Segment 2020 - 2024 ($ million)

5.4 Source segment analysis 2020 - 2024

Historic Market Size - Source Segment 2020 - 2024 ($ million)

5.5 Geography segment analysis 2020 - 2024

Historic Market Size - Geography Segment 2020 - 2024 ($ million)

5.6 Country segment analysis 2020 - 2024

Historic Market Size - Country Segment 2020 - 2024 ($ million)

6. Qualitative Analysis

6.1 Impact of AI on global oleochemicals market

7. Five Forces Analysis

7.1 Five forces summary

Five forces analysis - Comparison between 2025 and 2030

7.2 Bargaining power of buyers

Bargaining power of buyers - Impact of key factors 2025 and 2030

7.3 Bargaining power of suppliers

Bargaining power of suppliers - Impact of key factors in 2025 and 2030

7.4 Threat of new entrants

Threat of new entrants - Impact of key factors in 2025 and 2030

7.5 Threat of substitutes

Threat of substitutes - Impact of key factors in 2025 and 2030

7.6 Threat of rivalry

Threat of rivalry - Impact of key factors in 2025 and 2030

7.7 Market condition

Chart on Market condition - Five forces 2025 and 2030

8. Market Segmentation by Product

8.1 Market segments

Chart on Product - Market share 2025-2030 (%)
Data Table on Product - Market share 2025-2030 (%)

8.2 Comparison by Product

Chart on Comparison by Product
Data Table on Comparison by Product

8.3 Fatty acids - Market size and forecast 2025-2030

Chart on Fatty acids - Market size and forecast 2025-2030 ($ million)
Data Table on Fatty acids - Market size and forecast 2025-2030 ($ million)
Chart on Fatty acids - Year-over-year growth 2025-2030 (%)
Data Table on Fatty acids - Year-over-year growth 2025-2030 (%)

8.4 Fatty alcohol - Market size and forecast 2025-2030

Chart on Fatty alcohol - Market size and forecast 2025-2030 ($ million)
Data Table on Fatty alcohol - Market size and forecast 2025-2030 ($ million)
Chart on Fatty alcohol - Year-over-year growth 2025-2030 (%)
Data Table on Fatty alcohol - Year-over-year growth 2025-2030 (%)

8.5 Glycerol - Market size and forecast 2025-2030

Chart on Glycerol - Market size and forecast 2025-2030 ($ million)
Data Table on Glycerol - Market size and forecast 2025-2030 ($ million)
Chart on Glycerol - Year-over-year growth 2025-2030 (%)
Data Table on Glycerol - Year-over-year growth 2025-2030 (%)

8.6 Fatty amines - Market size and forecast 2025-2030

Chart on Fatty amines - Market size and forecast 2025-2030 ($ million)
Data Table on Fatty amines - Market size and forecast 2025-2030 ($ million)
Chart on Fatty amines - Year-over-year growth 2025-2030 (%)
Data Table on Fatty amines - Year-over-year growth 2025-2030 (%)

8.7 Others - Market size and forecast 2025-2030

Chart on Others - Market size and forecast 2025-2030 ($ million)
Data Table on Others - Market size and forecast 2025-2030 ($ million)
Chart on Others - Year-over-year growth 2025-2030 (%)
Data Table on Others - Year-over-year growth 2025-2030 (%)

8.8 Market opportunity by Product

Market opportunity by Product ($ million)
Data Table on Market opportunity by Product ($ million)

9. Market Segmentation by Application

9.1 Market segments

Chart on Application - Market share 2025-2030 (%)
Data Table on Application - Market share 2025-2030 (%)

9.2 Comparison by Application

Chart on Comparison by Application
Data Table on Comparison by Application

9.3 Soaps and detergents - Market size and forecast 2025-2030

Chart on Soaps and detergents - Market size and forecast 2025-2030 ($ million)
Data Table on Soaps and detergents - Market size and forecast 2025-2030 ($ million)
Chart on Soaps and detergents - Year-over-year growth 2025-2030 (%)
Data Table on Soaps and detergents - Year-over-year growth 2025-2030 (%)

9.4 Polymers - Market size and forecast 2025-2030

Chart on Polymers - Market size and forecast 2025-2030 ($ million)
Data Table on Polymers - Market size and forecast 2025-2030 ($ million)
Chart on Polymers - Year-over-year growth 2025-2030 (%)
Data Table on Polymers - Year-over-year growth 2025-2030 (%)

9.5 Personal care and pharmaceuticals - Market size and forecast 2025-2030

Chart on Personal care and pharmaceuticals - Market size and forecast 2025-2030 ($ million)
Data Table on Personal care and pharmaceuticals - Market size and forecast 2025-2030 ($ million)
Chart on Personal care and pharmaceuticals - Year-over-year growth 2025-2030 (%)
Data Table on Personal care and pharmaceuticals - Year-over-year growth 2025-2030 (%)

9.6 Lubricants and greases - Market size and forecast 2025-2030

Chart on Lubricants and greases - Market size and forecast 2025-2030 ($ million)
Data Table on Lubricants and greases - Market size and forecast 2025-2030 ($ million)
Chart on Lubricants and greases - Year-over-year growth 2025-2030 (%)
Data Table on Lubricants and greases - Year-over-year growth 2025-2030 (%)

9.7 Others - Market size and forecast 2025-2030

Chart on Others - Market size and forecast 2025-2030 ($ million)
Data Table on Others - Market size and forecast 2025-2030 ($ million)
Chart on Others - Year-over-year growth 2025-2030 (%)
Data Table on Others - Year-over-year growth 2025-2030 (%)

9.8 Market opportunity by Application

Market opportunity by Application ($ million)
Data Table on Market opportunity by Application ($ million)

10. Market Segmentation by Source

10.1 Market segments

Chart on Source - Market share 2025-2030 (%)
Data Table on Source - Market share 2025-2030 (%)

10.2 Comparison by Source

Chart on Comparison by Source
Data Table on Comparison by Source

10.3 Vegetable oils - Market size and forecast 2025-2030

Chart on Vegetable oils - Market size and forecast 2025-2030 ($ million)
Data Table on Vegetable oils - Market size and forecast 2025-2030 ($ million)
Chart on Vegetable oils - Year-over-year growth 2025-2030 (%)
Data Table on Vegetable oils - Year-over-year growth 2025-2030 (%)

10.4 Animal fats - Market size and forecast 2025-2030

Chart on Animal fats - Market size and forecast 2025-2030 ($ million)
Data Table on Animal fats - Market size and forecast 2025-2030 ($ million)
Chart on Animal fats - Year-over-year growth 2025-2030 (%)
Data Table on Animal fats - Year-over-year growth 2025-2030 (%)

10.5 Market opportunity by Source

Market opportunity by Source ($ million)
Data Table on Market opportunity by Source ($ million)

11. Customer Landscape

11.1 Customer landscape overview

Analysis of price sensitivity, lifecycle, customer purchase basket, adoption rates, and purchase criteria

12. Geographic Landscape

12.1 Geographic segmentation

Chart on Market share by geography 2025-2030 (%)
Data Table on Market share by geography 2025-2030 (%)

12.2 Geographic comparison

Chart on Geographic comparison
Data Table on Geographic comparison

12.3 APAC - Market size and forecast 2025-2030

Chart on APAC - Market size and forecast 2025-2030 ($ million)
Data Table on APAC - Market size and forecast 2025-2030 ($ million)
Chart on APAC - Year-over-year growth 2025-2030 (%)
Data Table on APAC - Year-over-year growth 2025-2030 (%)
Chart on Regional Comparison - APAC
Data Table on Regional Comparison - APAC

12.3.1 China - Market size and forecast 2025-2030

Chart on China - Market size and forecast 2025-2030 ($ million)
Data Table on China - Market size and forecast 2025-2030 ($ million)
Chart on China - Year-over-year growth 2025-2030 (%)
Data Table on China - Year-over-year growth 2025-2030 (%)

12.3.2 India - Market size and forecast 2025-2030

Chart on India - Market size and forecast 2025-2030 ($ million)
Data Table on India - Market size and forecast 2025-2030 ($ million)
Chart on India - Year-over-year growth 2025-2030 (%)
Data Table on India - Year-over-year growth 2025-2030 (%)

12.3.3 Japan - Market size and forecast 2025-2030

Chart on Japan - Market size and forecast 2025-2030 ($ million)
Data Table on Japan - Market size and forecast 2025-2030 ($ million)
Chart on Japan - Year-over-year growth 2025-2030 (%)
Data Table on Japan - Year-over-year growth 2025-2030 (%)

12.3.4 South Korea - Market size and forecast 2025-2030

Chart on South Korea - Market size and forecast 2025-2030 ($ million)
Data Table on South Korea - Market size and forecast 2025-2030 ($ million)
Chart on South Korea - Year-over-year growth 2025-2030 (%)
Data Table on South Korea - Year-over-year growth 2025-2030 (%)

12.3.5 Indonesia - Market size and forecast 2025-2030

Chart on Indonesia - Market size and forecast 2025-2030 ($ million)
Data Table on Indonesia - Market size and forecast 2025-2030 ($ million)
Chart on Indonesia - Year-over-year growth 2025-2030 (%)
Data Table on Indonesia - Year-over-year growth 2025-2030 (%)

12.3.6 Thailand - Market size and forecast 2025-2030

Chart on Thailand - Market size and forecast 2025-2030 ($ million)
Data Table on Thailand - Market size and forecast 2025-2030 ($ million)
Chart on Thailand - Year-over-year growth 2025-2030 (%)
Data Table on Thailand - Year-over-year growth 2025-2030 (%)

12.4 North America - Market size and forecast 2025-2030

Chart on North America - Market size and forecast 2025-2030 ($ million)
Data Table on North America - Market size and forecast 2025-2030 ($ million)
Chart on North America - Year-over-year growth 2025-2030 (%)
Data Table on North America - Year-over-year growth 2025-2030 (%)
Chart on Regional Comparison - North America
Data Table on Regional Comparison - North America

12.4.1 US - Market size and forecast 2025-2030

Chart on US - Market size and forecast 2025-2030 ($ million)
Data Table on US - Market size and forecast 2025-2030 ($ million)
Chart on US - Year-over-year growth 2025-2030 (%)
Data Table on US - Year-over-year growth 2025-2030 (%)

12.4.2 Canada - Market size and forecast 2025-2030

Chart on Canada - Market size and forecast 2025-2030 ($ million)
Data Table on Canada - Market size and forecast 2025-2030 ($ million)
Chart on Canada - Year-over-year growth 2025-2030 (%)
Data Table on Canada - Year-over-year growth 2025-2030 (%)

12.4.3 Mexico - Market size and forecast 2025-2030

Chart on Mexico - Market size and forecast 2025-2030 ($ million)
Data Table on Mexico - Market size and forecast 2025-2030 ($ million)
Chart on Mexico - Year-over-year growth 2025-2030 (%)
Data Table on Mexico - Year-over-year growth 2025-2030 (%)

12.5 Europe - Market size and forecast 2025-2030

Chart on Europe - Market size and forecast 2025-2030 ($ million)
Data Table on Europe - Market size and forecast 2025-2030 ($ million)
Chart on Europe - Year-over-year growth 2025-2030 (%)
Data Table on Europe - Year-over-year growth 2025-2030 (%)
Chart on Regional Comparison - Europe
Data Table on Regional Comparison - Europe

12.5.1 Germany - Market size and forecast 2025-2030

Chart on Germany - Market size and forecast 2025-2030 ($ million)
Data Table on Germany - Market size and forecast 2025-2030 ($ million)
Chart on Germany - Year-over-year growth 2025-2030 (%)
Data Table on Germany - Year-over-year growth 2025-2030 (%)

12.5.2 France - Market size and forecast 2025-2030

Chart on France - Market size and forecast 2025-2030 ($ million)
Data Table on France - Market size and forecast 2025-2030 ($ million)
Chart on France - Year-over-year growth 2025-2030 (%)
Data Table on France - Year-over-year growth 2025-2030 (%)

12.5.3 UK - Market size and forecast 2025-2030

Chart on UK - Market size and forecast 2025-2030 ($ million)
Data Table on UK - Market size and forecast 2025-2030 ($ million)
Chart on UK - Year-over-year growth 2025-2030 (%)
Data Table on UK - Year-over-year growth 2025-2030 (%)

12.5.4 Italy - Market size and forecast 2025-2030

Chart on Italy - Market size and forecast 2025-2030 ($ million)
Data Table on Italy - Market size and forecast 2025-2030 ($ million)
Chart on Italy - Year-over-year growth 2025-2030 (%)
Data Table on Italy - Year-over-year growth 2025-2030 (%)

12.5.5 Spain - Market size and forecast 2025-2030

Chart on Spain - Market size and forecast 2025-2030 ($ million)
Data Table on Spain - Market size and forecast 2025-2030 ($ million)
Chart on Spain - Year-over-year growth 2025-2030 (%)
Data Table on Spain - Year-over-year growth 2025-2030 (%)

12.5.6 The Netherlands - Market size and forecast 2025-2030

Chart on The Netherlands - Market size and forecast 2025-2030 ($ million)
Data Table on The Netherlands - Market size and forecast 2025-2030 ($ million)
Chart on The Netherlands - Year-over-year growth 2025-2030 (%)
Data Table on The Netherlands - Year-over-year growth 2025-2030 (%)

12.6 Middle East and Africa - Market size and forecast 2025-2030

Chart on Middle East and Africa - Market size and forecast 2025-2030 ($ million)
Data Table on Middle East and Africa - Market size and forecast 2025-2030 ($ million)
Chart on Middle East and Africa - Year-over-year growth 2025-2030 (%)
Data Table on Middle East and Africa - Year-over-year growth 2025-2030 (%)
Chart on Regional Comparison - Middle East and Africa
Data Table on Regional Comparison - Middle East and Africa

12.6.1 Saudi Arabia - Market size and forecast 2025-2030

Chart on Saudi Arabia - Market size and forecast 2025-2030 ($ million)
Data Table on Saudi Arabia - Market size and forecast 2025-2030 ($ million)
Chart on Saudi Arabia - Year-over-year growth 2025-2030 (%)
Data Table on Saudi Arabia - Year-over-year growth 2025-2030 (%)

12.6.2 South Africa - Market size and forecast 2025-2030

Chart on South Africa - Market size and forecast 2025-2030 ($ million)
Data Table on South Africa - Market size and forecast 2025-2030 ($ million)
Chart on South Africa - Year-over-year growth 2025-2030 (%)
Data Table on South Africa - Year-over-year growth 2025-2030 (%)

12.6.3 UAE - Market size and forecast 2025-2030

Chart on UAE - Market size and forecast 2025-2030 ($ million)
Data Table on UAE - Market size and forecast 2025-2030 ($ million)
Chart on UAE - Year-over-year growth 2025-2030 (%)
Data Table on UAE - Year-over-year growth 2025-2030 (%)

12.6.4 Egypt - Market size and forecast 2025-2030

Chart on Egypt - Market size and forecast 2025-2030 ($ million)
Data Table on Egypt - Market size and forecast 2025-2030 ($ million)
Chart on Egypt - Year-over-year growth 2025-2030 (%)
Data Table on Egypt - Year-over-year growth 2025-2030 (%)

12.6.5 Israel - Market size and forecast 2025-2030

Chart on Israel - Market size and forecast 2025-2030 ($ million)
Data Table on Israel - Market size and forecast 2025-2030 ($ million)
Chart on Israel - Year-over-year growth 2025-2030 (%)
Data Table on Israel - Year-over-year growth 2025-2030 (%)

12.7 South America - Market size and forecast 2025-2030

Chart on South America - Market size and forecast 2025-2030 ($ million)
Data Table on South America - Market size and forecast 2025-2030 ($ million)
Chart on South America - Year-over-year growth 2025-2030 (%)
Data Table on South America - Year-over-year growth 2025-2030 (%)
Chart on Regional Comparison - South America
Data Table on Regional Comparison - South America

12.7.1 Brazil - Market size and forecast 2025-2030

Chart on Brazil - Market size and forecast 2025-2030 ($ million)
Data Table on Brazil - Market size and forecast 2025-2030 ($ million)
Chart on Brazil - Year-over-year growth 2025-2030 (%)
Data Table on Brazil - Year-over-year growth 2025-2030 (%)

12.7.2 Argentina - Market size and forecast 2025-2030

Chart on Argentina - Market size and forecast 2025-2030 ($ million)
Data Table on Argentina - Market size and forecast 2025-2030 ($ million)
Chart on Argentina - Year-over-year growth 2025-2030 (%)
Data Table on Argentina - Year-over-year growth 2025-2030 (%)

12.7.3 Colombia - Market size and forecast 2025-2030

Chart on Colombia - Market size and forecast 2025-2030 ($ million)
Data Table on Colombia - Market size and forecast 2025-2030 ($ million)
Chart on Colombia - Year-over-year growth 2025-2030 (%)
Data Table on Colombia - Year-over-year growth 2025-2030 (%)

12.8 Market opportunity by geography

Market opportunity by geography ($ million)
Data Tables on Market opportunity by geography ($ million)

13. Drivers, Challenges, and Opportunity

13.1 Market drivers

Growth of packaged food and beverage industry
Growing demand for soaps and detergents
Government initiatives regarding use of oleochemicals

13.2 Market challenges

Fluctuating raw material prices
Storage and transportation of vegetable oils and animal fats
Demand-supply gap of raw materials for manufacturing oleochemicals

13.3 Impact of drivers and challenges

Impact of drivers and challenges in 2025 and 2030

13.4 Market opportunities

Growing demand for biosurfactants
Rising application of oleochemicals in recyclability of paper
Increasing use of biodiesel

14. Competitive Landscape

14.1 Overview

14.2

Overview on criticality of inputs and factors of differentiation

14.3 Landscape disruption

Overview on factors of disruption

14.4 Industry risks

Impact of key risks on business

15. Competitive Analysis

15.1 Companies profiled

Companies covered

15.2 Company ranking index

15.3 Market positioning of companies

Matrix on companies position and classification

15.4 Akzo Nobel NV

Akzo Nobel NV - Overview
Akzo Nobel NV - Business segments
Akzo Nobel NV - Key news
Akzo Nobel NV - Key offerings
Akzo Nobel NV - Segment focus
SWOT

15.5 BASF SE

BASF SE - Overview
BASF SE - Business segments
BASF SE - Key news
BASF SE - Key offerings
BASF SE - Segment focus
SWOT

15.6 Cabot Corp.

Cabot Corp. - Overview
Cabot Corp. - Business segments
Cabot Corp. - Key news
Cabot Corp. - Key offerings
Cabot Corp. - Segment focus
SWOT

15.7 Cargill Inc.

Cargill Inc. - Overview
Cargill Inc. - Product / Service
Cargill Inc. - Key offerings
SWOT

15.8 Croda International Plc

Croda International Plc - Overview
Croda International Plc - Business segments
Croda International Plc - Key offerings
Croda International Plc - Segment focus
SWOT

15.9 Emery Oleochemicals

Emery Oleochemicals - Overview
Emery Oleochemicals - Product / Service
Emery Oleochemicals - Key offerings
SWOT

15.10 Fairchem Organics Ltd.

Fairchem Organics Ltd. - Overview
Fairchem Organics Ltd. - Product / Service
Fairchem Organics Ltd. - Key offerings
SWOT

15.11 IOI Corp. BHD

IOI Corp. BHD - Overview
IOI Corp. BHD - Business segments
IOI Corp. BHD - Key offerings
IOI Corp. BHD - Segment focus
SWOT

15.12 Kao Corp.

Kao Corp. - Overview
Kao Corp. - Business segments
Kao Corp. - Key news
Kao Corp. - Key offerings
Kao Corp. - Segment focus
SWOT

15.13 KLK Oleo

KLK Oleo - Overview
KLK Oleo - Product / Service
KLK Oleo - Key offerings
SWOT

15.14 Oleon NV

Oleon NV - Overview
Oleon NV - Product / Service
Oleon NV - Key offerings
SWOT

15.15 Procter and Gamble Co.

Procter and Gamble Co. - Overview
Procter and Gamble Co. - Business segments
Procter and Gamble Co. - Key offerings
Procter and Gamble Co. - Segment focus
SWOT

15.16 Saudi Basic Industries

Saudi Basic Industries - Overview
Saudi Basic Industries - Business segments
Saudi Basic Industries - Key offerings
Saudi Basic Industries - Segment focus
SWOT

15.17 VVF Ltd.

VVF Ltd. - Overview
VVF Ltd. - Product / Service
VVF Ltd. - Key offerings
SWOT

15.18 Wilmar International Ltd.

Wilmar International Ltd. - Overview
Wilmar International Ltd. - Business segments
Wilmar International Ltd. - Key offerings
Wilmar International Ltd. - Segment focus
SWOT

16. Appendix

16.1 Scope of the report

Market definition
Objectives
Notes and caveats

16.2 Inclusions and exclusions checklist

Inclusions checklist
Exclusions checklist

16.3 Currency conversion rates for US$

16.4 Research methodology

16.5 Data procurement

Information sources

16.6 Data validation

16.7 Validation techniques employed for market sizing

16.8 Data synthesis

16.9 360 degree market analysis

16.10 List of abbreviations

Research Methodology

Technavio presents a detailed picture of the market by way of study, synthesis, and summation of data from multiple sources. The analysts have presented the various facets of the market with a particular focus on identifying the key industry influencers. The data thus presented is comprehensive, reliable, and the result of extensive research, both primary and secondary.

INFORMATION SOURCES

Primary sources

  • Manufacturers and suppliers
  • Channel partners
  • Industry experts
  • Strategic decision makers

Secondary sources

  • Industry journals and periodicals
  • Government data
  • Financial reports of key industry players
  • Historical data
  • Press releases

DATA ANALYSIS

Data Synthesis

  • Collation of data
  • Estimation of key figures
  • Analysis of derived insights

Data Validation

  • Triangulation with data models
  • Reference against proprietary databases
  • Corroboration with industry experts

REPORT WRITING

Qualitative

  • Market drivers
  • Market challenges
  • Market trends
  • Five forces analysis

Quantitative

  • Market size and forecast
  • Market segmentation
  • Geographical insights
  • Competitive landscape

Interested in this report?

Get your sample now to see our research methodology and insights!

Download Now

Frequently Asked Questions

Oleochemicals market growth will increase by USD 12000.9 million during 2026-2030.

The Oleochemicals market is expected to grow at a CAGR of 6.3% during 2026-2030.

Oleochemicals market is segmented by Product (Fatty acids, Fatty alcohol, Glycerol, Fatty amines, Others) Application (Soaps and detergents, Polymers, Personal care and pharmaceuticals, Lubricants and greases, Others) Source (Vegetable oils, Animal fats)

Akzo Nobel NV, BASF SE, Berg Schmidt GmbH, Cabot Corp., Cargill Inc., Croda International Plc, Ecogreen Oleochemicals, Emery Oleochemicals, Evonik Industries AG, Evyap Soap Oil Glycerin, Fairchem Organics Ltd., Godrej Industries Ltd., IOI Corp. BHD, Kao Corp., KLK Oleo, Oleon NV, Procter and Gamble Co., Saudi Basic Industries, VVF Ltd., Wilmar International Ltd. are a few of the key vendors in the Oleochemicals market.

APAC will register the highest growth rate of 65.5% among the other regions. Therefore, the Oleochemicals market in APAC is expected to garner significant business opportunities for the vendors during the forecast period.

China, India, Japan, South Korea, Indonesia, Thailand, US, Canada, Mexico, Germany, France, UK, Italy, Spain, The Netherlands, Saudi Arabia, South Africa, UAE, Egypt, Israel, Brazil, Argentina, Colombia

  • Growth of packaged food and beverage industry is the driving factor this market.

The Oleochemicals market vendors should focus on grabbing business opportunities from the Product segment as it accounted for the largest market share in the base year.