
Online Financing Platform For SMBs Market Size 2025-2029
The online financing platform for smbs market size is forecast to increase by USD 23.48 billion, at a CAGR of 21.4% between 2024 and 2029.
- The market is experiencing significant growth, driven by the increasing trend of digital transformation in business financing. The surge in the number of small and medium-sized businesses (SMBs) worldwide is a key factor fueling this growth. These businesses are increasingly turning to online financing platforms for their funding needs due to the convenience, speed, and flexibility they offer. However, the market is not without challenges. Privacy and security concerns are a significant obstacle, as SMBs must ensure the protection of their financial data when using these platforms.
- Additionally, regulatory compliance and the need for transparency are crucial considerations for both financing platforms and SMBs. Navigating these challenges requires a robust security framework, clear communication, and a strong commitment to regulatory compliance. Companies seeking to capitalize on the opportunities in this market must prioritize these factors to build trust and confidence among their SMB clientele.
What will be the Size of the Online Financing Platform For SMBs Market during the forecast period?
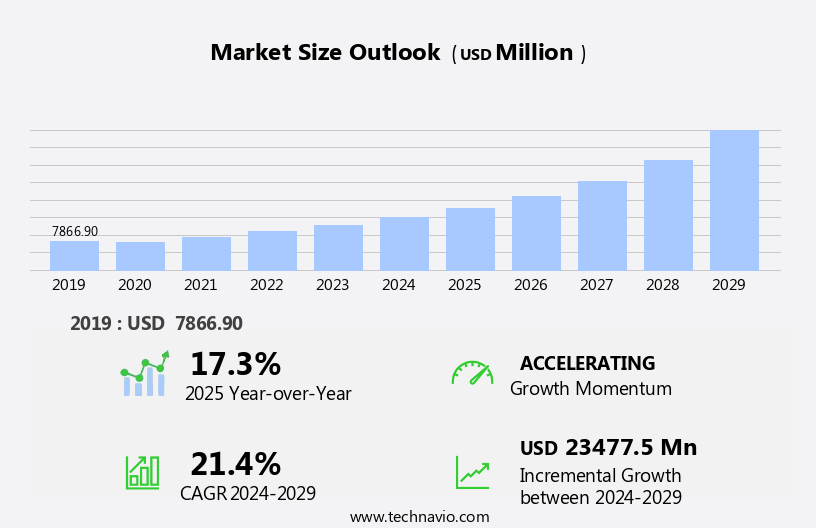
Explore in-depth regional segment analysis with market size data - historical 2019-2023 and forecasts 2025-2029 - in the full report.
Request Free Sample
The online financing market for Small and Medium-sized Businesses (SMBs) continues to evolve, with dynamic market activities unfolding across various sectors. Entities offering lines of credit, financial statements analysis, decisioning engines, real estate financing, equipment financing, automated underwriting, risk assessment, invoice financing, and online application processes are seamlessly integrated into comprehensive loan management systems. These systems enable SMBs to access essential funding options, including working capital loans, startup funding, and growth capital, through digital lending platforms. Fraud prevention measures, such as Anti-Money Laundering (AML) protocols, are also integrated into these systems to ensure secure transactions.
The ongoing development of digital lending platforms encompasses API integration, mobile lending apps, and loan origination, enabling SMBs to apply for loans and manage their portfolios online. Credit reports, loan amortization, interest rates, and debt financing are assessed through credit scoring and cash flow projections. Entities providing loan servicing, merchant cash advances, venture capital, equity financing, debt collection, business plans, and due diligence contribute to the evolving landscape of online financing for SMBs. The integration of data encryption and data privacy measures further enhances the security of these platforms, ensuring that sensitive business information remains protected.
As market dynamics continue to shift, the online financing market for SMBs will remain a vital source of growth capital and essential funding solutions.
How is this Online Financing Platform For SMBs Industry segmented?
The online financing platform for smbs industry research report provides comprehensive data (region-wise segment analysis), with forecasts and estimates in "USD million" for the period 2025-2029, as well as historical data from 2019-2023 for the following segments.
- Type
- Equity financing
- Debt financing
- Service
- Bank-led online lending platforms
- Alternative lenders and fintech platforms
- Peer-to-peer (P2P) lending
- End-user
- Interest-based revenue
- Transaction fees
- Referral and partnership fees
- Platform
- Peer-to-Peer Lending
- Bank-Affiliated
- Independent Platforms
- Geography
- North America
- US
- Mexico
- Europe
- France
- Germany
- Italy
- Spain
- UK
- Middle East and Africa
- UAE
- APAC
- Australia
- China
- India
- Japan
- South Korea
- South America
- Brazil
- Rest of World (ROW)
- North America
By Type Insights
The equity financing segment is estimated to witness significant growth during the forecast period.
The online financing market for Small and Medium-sized Businesses (SMBs) is witnessing significant activity and evolving trends. Equity financing, which involves selling an ownership interest of a business in exchange for capital, held the largest market share in 2024. However, the process of securing equity financing is challenging, as finding investors willing to buy the business is a significant hurdle. The amount of equity financing a borrower takes also impacts their management control and future sale options. Digital lending platforms and online application processes streamline the loan origination process, enabling quicker access to various financing options.
These include working capital loans, merchant cash advances, lines of credit, and term loans. Credit reports and credit scoring are crucial components of the decisioning engines used by these platforms to assess risk and make informed lending decisions. Real estate financing, equipment financing, and invoice financing are other financing segments catering to specific business needs. Automated underwriting and risk assessment tools help minimize fraud and ensure due diligence. Portfolio management, loan amortization, and debt collection are essential services that support the efficient handling of loan servicing. Venture capital, growth capital, and angel investors provide alternative financing avenues for SMBs.
Payment gateways and API integration facilitate seamless transactions, while debt financing and business plans are integral components of securing various financing options. Data encryption and compliance with anti-money laundering regulations are crucial aspects of maintaining trust and security in the digital lending ecosystem. The market is also witnessing the emergence of mobile lending apps, further expanding accessibility to various financing solutions.
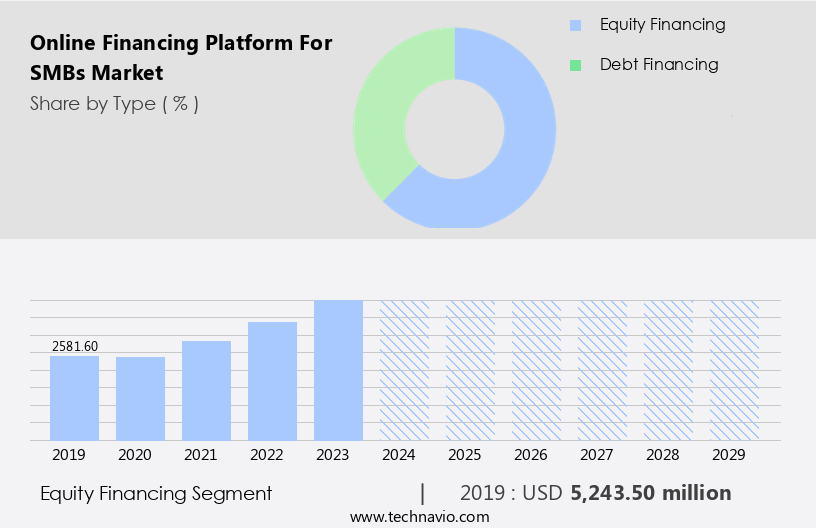
The Equity financing segment was valued at USD 5.24 billion in 2019 and showed a gradual increase during the forecast period.
Regional Analysis
North America is estimated to contribute 39% to the growth of the global market during the forecast period.Technavio’s analysts have elaborately explained the regional trends and drivers that shape the market during the forecast period.
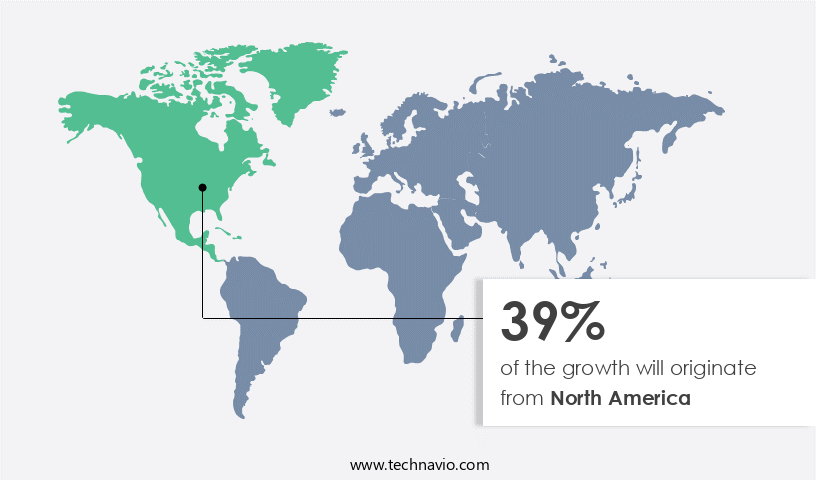
The online financing market for Small and Medium-sized Businesses (SMBs) in North America is experiencing significant growth due to the increasing demand for accessible financial services. This demand stems from the expanding awareness to include traditionally underserved populations and the rising number of SMBs in the region. Technological advancements, such as automated underwriting, digital lending platforms, and online application processes, have streamlined the loan origination and decision-making process. Payment gateways, credit reports, and fraud prevention measures ensure secure transactions, while loan servicing, loan amortization, and loan management systems facilitate efficient loan administration. Merchant cash advances, working capital loans, and lines of credit provide essential funding for businesses, with interest rates and credit scoring determining affordability.
Real estate financing, equipment financing, and invoice financing cater to various business needs, while debt financing, equity financing, and venture capital offer alternative financing solutions. Debt collection, risk assessment, and due diligence ensure the sustainability of these financing options. The integration of APIs and mobile lending apps has made financing more accessible and convenient, allowing businesses to manage their finances on-the-go. The market's growth is further driven by the presence of digital lending platforms, online lending, and portfolio management companies, which have made financing more accessible and efficient for SMBs in North America.
Market Dynamics
Our researchers analyzed the data with 2024 as the base year, along with the key drivers, trends, and challenges. A holistic analysis of drivers will help companies refine their marketing strategies to gain a competitive advantage.
In the dynamic business landscape, Small and Medium Businesses (SMBs) seek flexible and efficient financing solutions to fuel growth and manage cash flow. Enter the online financing platform market, a game-changer for SMB financing. These platforms leverage advanced technology to streamline applications, offering quick approval and disbursal. Business owners can access various loan types, including invoice financing, lines of credit, and term loans. The user-friendly interfaces enable easy application processes, while robust security measures protect sensitive information. Transparent pricing and flexible repayment terms cater to diverse business needs. Furthermore, these platforms integrate with accounting software, simplifying financial management. With 24/7 accessibility and personalized customer support, online financing platforms empower SMBs to seize opportunities and overcome challenges in today's competitive market.
What are the key market drivers leading to the rise in the adoption of Online Financing Platform For SMBs Industry?
- The significant increase in lending to small and medium-sized businesses (SMBs) serves as the primary catalyst for market growth.
- Online financing platforms have emerged as a viable solution for Small and Medium-sized Businesses (SMBs) in the wake of stricter regulatory requirements that have led traditional banks to limit loan origination for individual borrowers and SMBs, perceived as high-risk. These new financing methods, which include online marketplaces, peer-to-peer platforms, and balance sheets, have gained traction due to their ability to streamline the loan origination process and provide easier access to working capital. Several financing options are available for SMBs in the online financing market. Marketplace loans, merchant and e-commerce finance, invoice financing, supply chain financing, and trade financing are some of the popular choices.
- While the specifics of each product may vary, they all share the common goal of providing businesses with the necessary cash flow to meet their operational needs. Credit reports and credit scoring play a crucial role in the online financing process. Lenders use these reports to assess a business's creditworthiness and determine interest rates and loan terms. Loan amortization schedules and cash flow projections are essential components of the business plan that borrowers must submit to secure financing. Debt collection and debt financing are also critical aspects of the online financing ecosystem, ensuring that lenders are repaid in a timely and efficient manner.
- Despite the benefits of online financing, it is essential to note that there are risks involved. Borrowers must carefully evaluate the terms and conditions of their loan agreements and ensure that they can meet their repayment obligations. Additionally, businesses should be aware of the potential for fraud and other risks associated with online transactions. In conclusion, the online financing market offers SMBs a range of financing options that can help them meet their operational needs. Marketplace loans, merchant and e-commerce finance, invoice financing, supply chain financing, and trade financing are just a few of the available choices.
- While these products offer many benefits, it is crucial for businesses to carefully evaluate the terms and conditions and understand the risks involved before securing financing.
What are the market trends shaping the Online Financing Platform For SMBs Industry?
- The increasing growth of small and medium-sized businesses (SMBs) represents a significant market trend. This upward trajectory is a reflection of the dynamic business landscape and the increasing entrepreneurial spirit.
- Online financing platforms have emerged as a significant solution for Small and Medium-sized Businesses (SMBs) worldwide, providing them with various financing options to meet their unique financial needs. These platforms offer lines of credit, real estate financing, equipment financing, invoice financing, and more, all through an automated online application process. Financial statements and business data are analyzed using advanced decisioning engines and automated underwriting systems to assess risk and make quick funding decisions. Rigorous risk assessment and anti-money laundering (AML) measures are implemented to ensure the integrity of the financing process. SMBs, which account for approximately 90% of all enterprises and over 50% of global employment, are crucial contributors to economic growth and development.
- With the increasing demand for employment opportunities, it is estimated that 600 million new jobs will be needed by 2030 to accommodate the expanding workforce. Financing platforms catering to SMBs can significantly contribute to the creation of these new jobs by providing the necessary capital for business expansion and growth. In conclusion, online financing platforms have become essential tools for SMBs, offering flexible financing solutions, streamlined application processes, and efficient risk assessment. These platforms are instrumental in fostering economic growth and job creation, making them an indispensable resource for businesses and governments alike.
What challenges does the Online Financing Platform For SMBs Industry face during its growth?
- The growth of the industry is significantly impacted by the complex issue of balancing privacy and security concerns. This challenge, which is of paramount importance, necessitates the implementation of robust and effective measures to protect sensitive information and maintain trust with customers.
- The online financing platform market for Small and Medium-sized Businesses (SMBs) is experiencing steady growth, driven by the increasing demand for efficient loan management systems and the convenience of mobile lending apps. While Internet penetration is high, adoption rates are still low due to a lack of awareness and trust in digital financing solutions. To accelerate market expansion, policymakers and leading companies must implement initiatives that promote the use of online financing platforms. Payment service providers play a crucial role in the online financing ecosystem by collecting and analyzing customer data. This data is utilized for customer profiling, behavior analysis, and data mining, enabling targeted advertising and customized loan offerings.
- API integration facilitates seamless data exchange between various systems, ensuring a harmonious user experience. Despite the benefits, data security remains a significant concern. Stringent data encryption protocols and thorough due diligence processes are essential to maintain customer trust and protect sensitive financial information. As angel investors and term loan providers increasingly turn to online financing platforms for growth capital, it is essential to prioritize security and transparency in the market.
Exclusive Customer Landscape
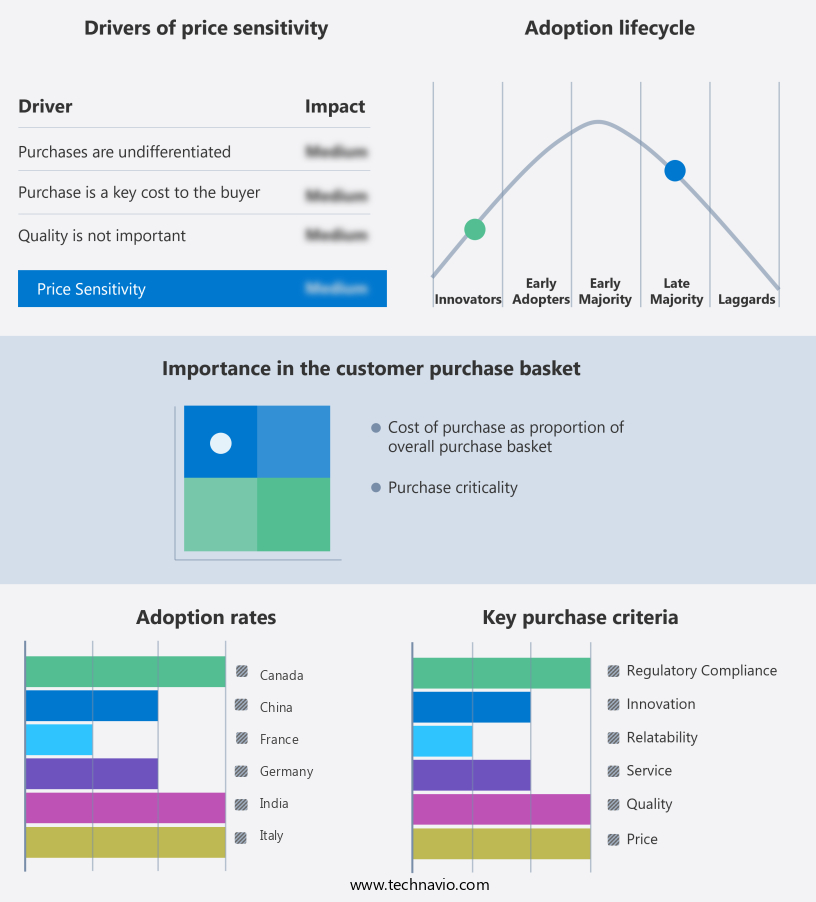
The online financing platform for smbs market forecasting report includes the adoption lifecycle of the market, covering from the innovator’s stage to the laggard’s stage. It focuses on adoption rates in different regions based on penetration. Furthermore, the online financing platform for smbs market report also includes key purchase criteria and drivers of price sensitivity to help companies evaluate and develop their market growth analysis strategies.
Customer Landscape
Key Companies & Market Insights
Companies are implementing various strategies, such as strategic alliances, online financing platform for smbs market forecast, partnerships, mergers and acquisitions, geographical expansion, and product/service launches, to enhance their presence in the industry.
Kabbage - The company provides an innovative online financing solution for small and medium businesses, offering checking and funding services to help manage cash flow and access capital. This user-friendly platform streamlines the application process and delivers funding in a timely manner, empowering businesses to grow and thrive.
The industry research and growth report includes detailed analyses of the competitive landscape of the market and information about key companies, including:
- Kabbage
- OnDeck
- BlueVine
- Fundbox
- PayPal Working Capital
- Square Capital
- Stripe Capital
- Intuit QuickBooks Financing
- Lendio
- Credibly
- Funding Circle
- Biz2Credit
- National Funding
- Balboa Capital
- Fora Financial
- Rapid Finance
- Headway Capital
- StreetShares
- CAN Capital
- Kapitus
Qualitative and quantitative analysis of companies has been conducted to help clients understand the wider business environment as well as the strengths and weaknesses of key industry players. Data is qualitatively analyzed to categorize companies as pure play, category-focused, industry-focused, and diversified; it is quantitatively analyzed to categorize companies as dominant, leading, strong, tentative, and weak.
Recent Development and News in Online Financing Platform For SMBs Market
- In January 2024, BlueVine, a leading online financing platform for small and medium-sized businesses (SMBs), announced the launch of its new invoice factoring service, allowing businesses to receive cash for their unpaid invoices within 24 hours (BlueVine Press Release, 2024). This expansion broadened BlueVine's product offerings, catering to a wider range of SMB financing needs.
- In March 2024, OnDeck, a prominent online lender, entered into a strategic partnership with Intuit, the accounting software giant. This collaboration enabled OnDeck to integrate its loan application process directly into Intuit's QuickBooks platform, streamlining the loan application process for SMBs using QuickBooks (OnDeck Press Release, 2024).
- In May 2025, Square Capital, a lending division of Square Inc., secured a USD100 million equity investment from BlackRock, a global investment firm. This investment fueled Square Capital's growth and expansion, enabling it to offer more financing options and services to SMBs (Square Press Release, 2025).
- In the same month, the Small Business Administration (SBA) announced the launch of its new Express Bridge Program, which streamlined the process for SBA loan applications through online financing platforms. This initiative aimed to reduce the time it takes for SMBs to secure SBA-backed loans, making financing more accessible during economic downturns (SBA Press Release, 2025).
Research Analyst Overview
- In the Small and Medium Business (SMB) financing market, Fintech innovations continue to reshape the landscape. UI design enhances user experience (UX), making loan applications more accessible. Credit risk modeling leverages machine learning (ML) and artificial intelligence (AI) for accurate assessments. Marketing automation and lead generation tools boost borrower acquisition. Customer retention relies on data analytics for personalized services. Peer-to-peer lending and alternative lending platforms challenge traditional banking.
- Blockchain technology ensures data privacy and regulatory compliance. Business development thrives through strategic partnerships and predictive analytics. Sales conversion improves with AI-driven pricing models. Open banking facilitates financial reporting and investor relations. Security protocols safeguard financial transactions. Fintech solutions streamline debt management and streamline financial operations.
Dive into Technavio’s robust research methodology, blending expert interviews, extensive data synthesis, and validated models for unparalleled Online Financing Platform For SMBs Market insights. See full methodology.
|
Market Scope |
|
|
Report Coverage |
Details |
|
Page number |
0 |
|
Base year |
2024 |
|
Historic period |
2019-2023 |
|
Forecast period |
2025-2029 |
|
Growth momentum & CAGR |
Accelerate at a CAGR of 21.4% |
|
Market growth 2025-2029 |
USD 23477.5 million |
|
Market structure |
Fragmented |
|
YoY growth 2024-2025(%) |
17.3 |
|
Key countries |
US, China, Germany, Japan, UK, Australia, India, France, Brazil, UAE, Rest of World (ROW), Saudi Arabia, France, South Korea, Mexico, Italy, and Spain |
|
Competitive landscape |
Leading Companies, Market Positioning of Companies, Competitive Strategies, and Industry Risks |
What are the Key Data Covered in this Online Financing Platform For SMBs Market Research and Growth Report?
- CAGR of the Online Financing Platform For SMBs industry during the forecast period
- Detailed information on factors that will drive the growth and forecasting between 2025 and 2029
- Precise estimation of the size of the market and its contribution of the industry in focus to the parent market
- Accurate predictions about upcoming growth and trends and changes in consumer behaviour
- Growth of the market across North America, Europe, APAC, South America, and Middle East and Africa
- Thorough analysis of the market’s competitive landscape and detailed information about companies
- Comprehensive analysis of factors that will challenge the online financing platform for smbs market growth of industry companies
We can help! Our analysts can customize this online financing platform for smbs market research report to meet your requirements.
 RIA -
RIA - 
