Business Information Market Analysis, Size, and Forecast 2026-2030: North America (US, Canada, and Mexico), Europe (UK, Germany, and France), APAC (China, Japan, and India), Middle East and Africa (UAE, Saudi Arabia, and South Africa), South America (Brazil, Argentina, and Colombia), and Rest of World (ROW)

Business Information Market Analysis, Size, and Forecast 2026-2030:
North America (US, Canada, and Mexico), Europe (UK, Germany, and France), APAC (China, Japan, and India), Middle East and Africa (UAE, Saudi Arabia, and South Africa), South America (Brazil, Argentina, and Colombia), and Rest of World (ROW)

Published: Mar 2026 302 Pages SKU: IRTNTR46468

Market Overview at a Glance

$62.71 B
Market Opportunity
6%
CAGR 2025 - 2030
36.4%
North America Growth
$53.12 B
BFSI segment 2024

Business Information Market Size 2026-2030

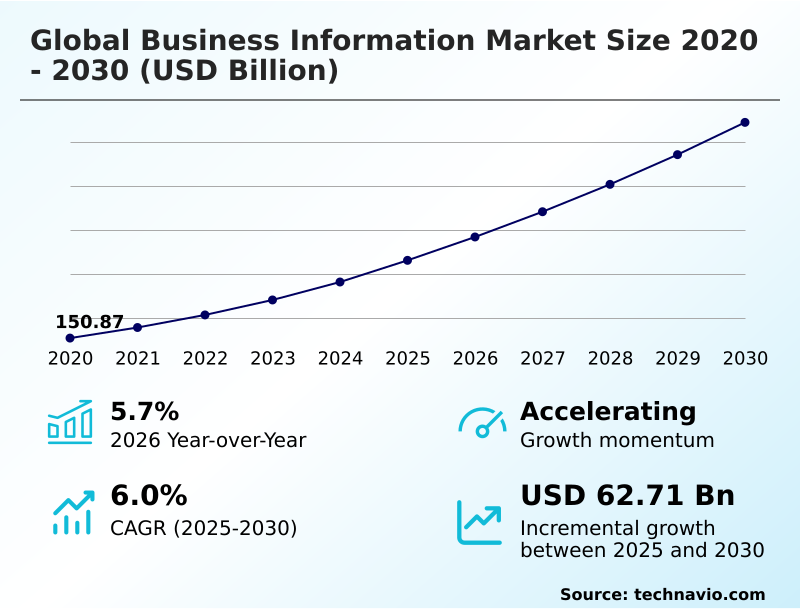
The business information market size is valued to increase by USD 62.71 billion, at a CAGR of 6% from 2025 to 2030. Mainstreaming of agentic AI and autonomous knowledge workflows will drive the business information market.

Major Market Trends & Insights

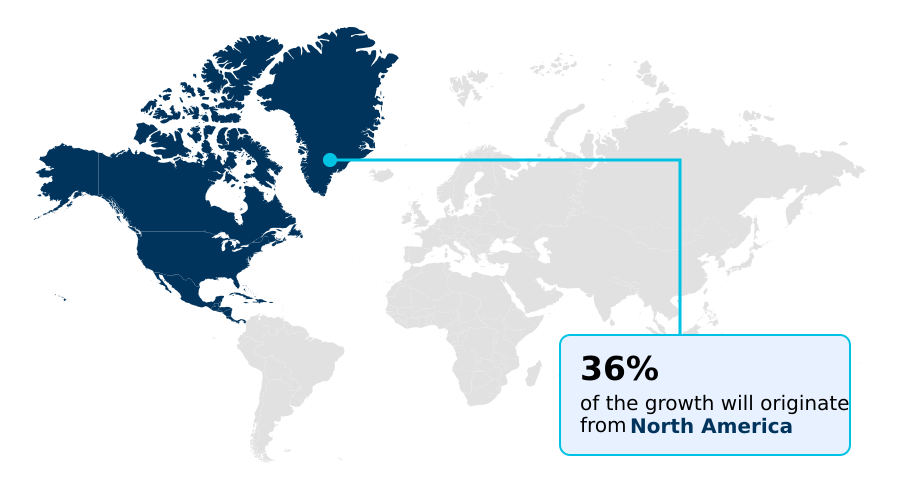
  • North America dominated the market and accounted for a 36.4% growth during the forecast period.
  • By End-user - BFSI segment was valued at USD 53.12 billion in 2024
  • By Application - B2B segment accounted for the largest market revenue share in 2024

Market Size & Forecast

  • Market Opportunities: USD 98.05 billion
  • Market Future Opportunities: USD 62.71 billion
  • CAGR from 2025 to 2030 : 6%

Market Summary

  • The Business Information Market is undergoing a structural transformation, moving beyond static data provision to dynamic, intelligence-as-a-service models. This shift is propelled by the integration of agentic AI workflows and autonomous knowledge systems, which are becoming default infrastructure capabilities for routine research and data summarization.
  • Organizations now prioritize sovereign compute infrastructure and localized data autonomy to meet stringent data residency requirements. A key application is in supply chain management, where esg intelligence platforms and circular economy compliance tools provide verifiable data on carbon intensity and supply chain ethics tracking.
  • This allows companies to leverage high-frequency market data for real-time monitoring, significantly reducing time-to-insight and enabling a focus on high-level validation. The use of data clean room technology and privacy-preserving analytics facilitates secure collaboration, while no-code bi platforms and natural language query interfaces democratize access to sophisticated analysis, empowering non-technical users to derive insights and improve operational efficiency.
  • This evolution is underpinned by a growing demand for generative model transparency and reliable human-in-the-loop verification to maintain trust in AI-generated content.

What will be the Size of the Business Information Market during the forecast period?

Get Key Insights on Market Forecast (PDF) Request Free Sample

How is the Business Information Market Segmented?

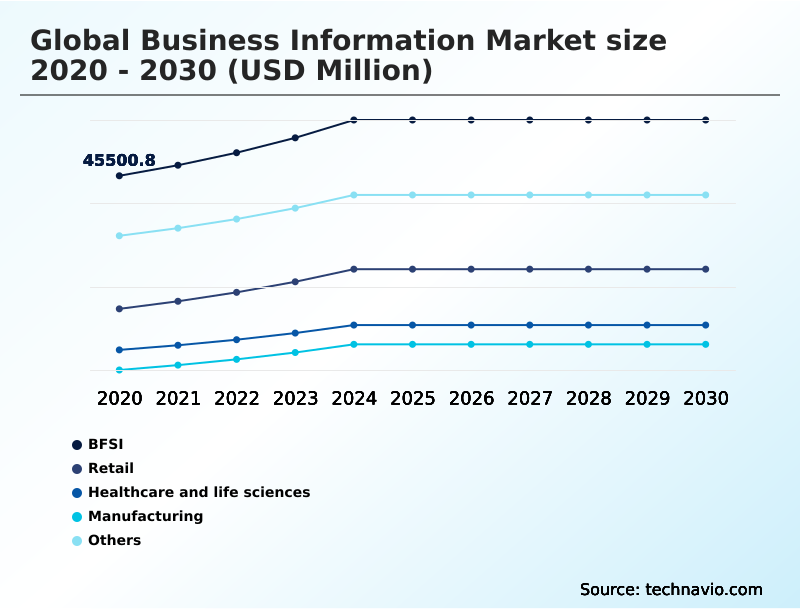
The business information industry research report provides comprehensive data (region-wise segment analysis), with forecasts and estimates in "USD million" for the period 2026-2030, as well as historical data from 2020-2024 for the following segments.

  • End-user
    • BFSI
    • Retail
    • Healthcare and life sciences
    • Manufacturing
    • Others
  • Application
    • B2B
    • B2C
  • Component
    • Software
    • Services
  • Geography
    • North America
      • US
      • Canada
      • Mexico
    • Europe
      • UK
      • Germany
      • France
    • APAC
      • China
      • Japan
      • India
    • Middle East and Africa
      • UAE
      • Saudi Arabia
      • South Africa
    • South America
      • Brazil
      • Argentina
      • Colombia
    • Rest of World (ROW)

By End-user Insights

The bfsi segment is estimated to witness significant growth during the forecast period.

The BFSI segment is the largest consumer in the Business Information Market, driven by a fundamental need for high-fidelity data to manage risk and ensure regulatory adherence.

Financial institutions utilize comprehensive firmographic data feeds and api-first solutions for rigorous credit risk assessments and first-party fraud detection.

The adoption of predictive modeling software and hyper-personalization engines is critical for optimizing portfolio management and refining underwriting models, where the accuracy of real-time brand health tracking can impact investment strategies.

As institutions face increasing pressure, api-driven connectivity allows for seamless integration into enterprise decision engines, improving risk management and compliance functions.

Advanced credit abuse risk modeling has become essential, reducing customer churn prediction errors by over 15% and delivering actionable intelligence delivery for account-based marketing intelligence.

Request Free Sample

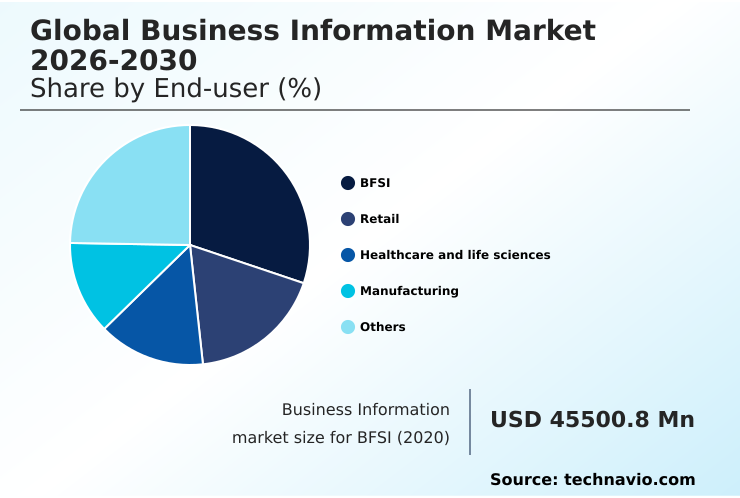
The BFSI segment was valued at USD 53.12 billion in 2024 and showed a gradual increase during the forecast period.

Request Free Sample

Regional Analysis

North America is estimated to contribute 36.4% to the growth of the global market during the forecast period.Technavio’s analysts have elaborately explained the regional trends and drivers that shape the market during the forecast period.

See How Business Information Market Demand is Rising in North America Request Free Sample

The global geographic landscape is increasingly shaped by the push for sovereign compute infrastructure and localized data autonomy, with North America contributing over 36% of the market's incremental growth.

Regions like APAC are rapidly adopting digital public infrastructure and no-code bi platforms to support data-driven governance and democratization of analytics.

This trend empowers local enterprises with natural language query interfaces, enabling automated consumer profiling and account-based experience data without extensive technical expertise. In Europe, the focus is on stringent regulatory compliance, driving investment in localized data centers.

For instance, manufacturers use insights from predictive maintenance data to optimize operations and sustainability metrics reporting to meet ESG goals, while retailers leverage dynamic pricing models for competitive advantage.

Market Dynamics

Our researchers analyzed the data with 2025 as the base year, along with the key drivers, trends, and challenges. A holistic analysis of drivers will help companies refine their marketing strategies to gain a competitive advantage.

  • Strategic decision-making is increasingly dependent on integrating real-time alternative data sources, which provides a competitive edge over reliance on delayed public filings. The use of agentic ai for financial modeling and generative ai in corporate research is revolutionizing how organizations synthesize complex information, allowing for unified search across proprietary data to accelerate insight generation.
  • Concurrently, esg compliance tracking for supply chains and localized processing for trade compliance have become non-negotiable, driven by regulatory pressures and consumer demand for transparency, which is further supported by blockchain traceability for raw materials. To navigate privacy mandates, firms are turning to data clean rooms for collaborative analytics and privacy-preserving technology in fintech.
  • The challenge of ai-generated information integrity verification is being addressed through robust human-in-the-loop for ai accuracy protocols. The market is also seeing widespread adoption of no-code business intelligence platform adoption and natural language interfaces for data analysis, which democratize access to tools for predictive analytics for retail inventory and credit risk assessment automation.
  • This shift toward accessible, secure, and real-time intelligence is enabled by api integration for enterprise workflows and sovereign compute for data residency, while process intelligence for operational efficiency and geospatial data for location analysis deliver tangible business outcomes, with firms reporting efficiency gains of over 20% in logistics planning.

What are the key market drivers leading to the rise in the adoption of Business Information Industry?

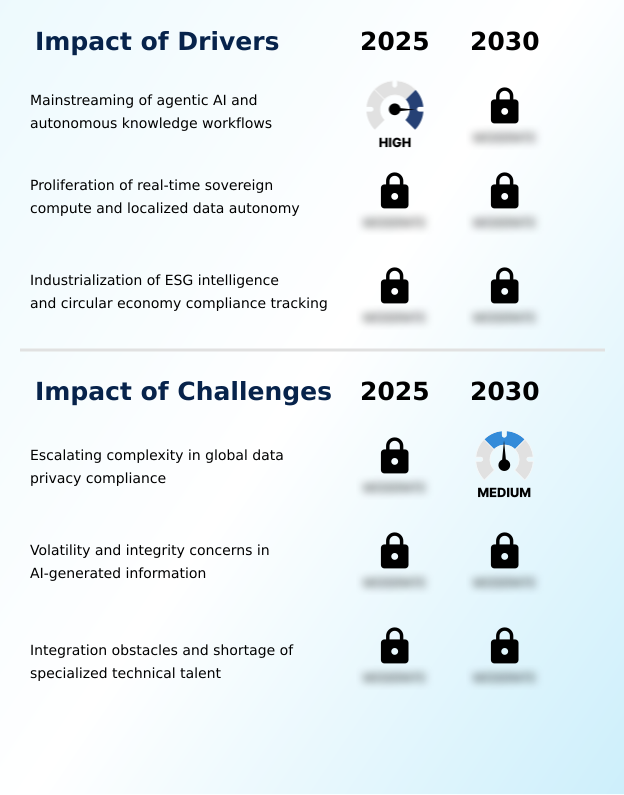
  • The mainstreaming of agentic AI and autonomous knowledge workflows that independently plan, execute, and synthesize complex research tasks represents a key driver for the market.

  • A primary driver is the mainstreaming of agentic ai workflows and autonomous knowledge systems, which transform raw data into an intelligence-as-a-service model.
  • These tools, which are now used by nearly 75% of knowledge workers, allow for unstructured data processing and decentralized decision-making. The industrialization of esg intelligence platforms is also critical, as corporate accountability metrics become foundational to corporate strategy.
  • Circular economy compliance tracking is now mandatory in many regions, fueling demand for verifiable data. Technologies like farm-to-face traceability and supply chain ethics tracking, often powered by blockchain, provide unprecedented transparency.
  • This evolution supports b2b marketing technology and enhances the capabilities of human-in-the-loop verification systems to ensure data integrity within unified search workspaces.

What are the market trends shaping the Business Information Industry?

  • The market is increasingly defined by a shift toward high-frequency market intelligence, where the value of information is measured by its real-time availability. This is driven by the integration of alternative data sources into core financial and operational streams.

  • The market is shifting toward a high-frequency market data model, where latency is a key performance metric. The integration of real-time alternative data, such as satellite imagery and real-time market sentiment, provides a significant competitive advantage, with advanced real-time purchasing managers index surveys now serving as a primary indicator for GDP projections.
  • This trend facilitates the creation of collaborative data ecosystems through data clean room technology and privacy-preserving analytics. It also enables new data monetization strategies and dark data utilization, unlocking value from previously untapped information sources. This approach supports enhanced strategic decision support for digital-native brand partnerships.
  • The use of federated learning models and geospatial data analysis is also growing, allowing firms to gain deeper insights while maintaining compliance.

What challenges does the Business Information Industry face during its growth?

  • The escalating complexity and fragmentation of the global data privacy regulatory landscape presents a key challenge to market growth.

  • A significant challenge is navigating complex information governance policies and ensuring data residency compliance amid fragmented global regulations, which complicates cross-border data transfers. The need for generative model transparency is paramount to combat AI hallucinations and maintain trust in ai-augmented insights. However, the scarcity of talent for data-literate workforce development creates a major bottleneck.
  • Integrating disparate systems requires robust interoperability frameworks and effective process mining and optimization strategies. Many firms are now turning to managed data services for specialized expertise. The adoption of process intelligence integration is hindered by legacy architectures, while handling corporate transaction intelligence and identity resolution services requires advanced tools like homomorphic encryption processing to ensure security and privacy.

Exclusive Technavio Analysis on Customer Landscape

The business information market forecasting report includes the adoption lifecycle of the market, covering from the innovator’s stage to the laggard’s stage. It focuses on adoption rates in different regions based on penetration. Furthermore, the business information market report also includes key purchase criteria and drivers of price sensitivity to help companies evaluate and develop their market growth analysis strategies.

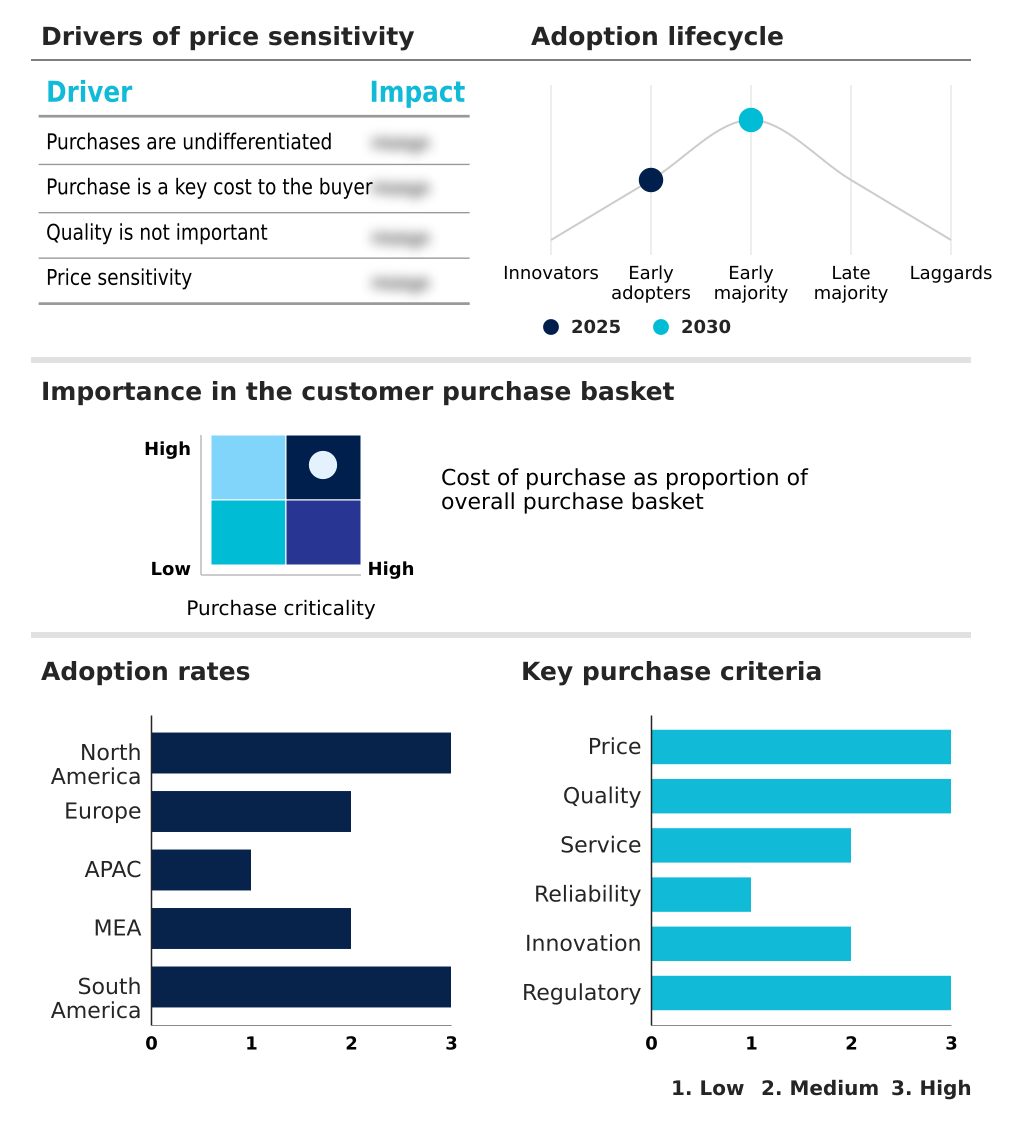
Customer Landscape of Business Information Industry

Competitive Landscape

Companies are implementing various strategies, such as strategic alliances, business information market forecast, partnerships, mergers and acquisitions, geographical expansion, and product/service launches, to enhance their presence in the industry.

Bloomberg LP - A leading provider of real-time financial data, analytics, and news, delivering actionable business information to global markets, investors, and enterprises.

The industry research and growth report includes detailed analyses of the competitive landscape of the market and information about key companies, including:

  • Bloomberg LP
  • Capita Plc
  • CQG
  • Deloitte Touche Tohmatsu Ltd.
  • Dun and Bradstreet Holdings Inc
  • Equifax Inc.
  • Ernst and Young Global Ltd.
  • Experian Plc
  • FactSet Research Systems Inc.
  • Informa PLC
  • KPMG International Ltd.
  • Moodys Corp.
  • Morningstar Inc.
  • News Corp.
  • PricewaterhouseCoopers LLP
  • Refinitiv
  • RELX Plc
  • S and P Global Inc.
  • Thomson Reuters Corp.
  • Wolters Kluwer NV

Qualitative and quantitative analysis of companies has been conducted to help clients understand the wider business environment as well as the strengths and weaknesses of key industry players. Data is qualitatively analyzed to categorize companies as pure play, category-focused, industry-focused, and diversified; it is quantitatively analyzed to categorize companies as dominant, leading, strong, tentative, and weak.

Recent Development and News in Business information market

  • In March, 2025, Databricks entered into a strategic five-year agreement with Anthropic valued at $100 million to integrate sophisticated AI models directly into enterprise data platforms, accelerating the deployment of autonomous agents for complex business analysis.
  • In November, 2024, Thomson Reuters Corp. completed its acquisition of Noetica, Inc., an AI-native platform specializing in corporate transaction intelligence, to embed structured market intelligence and benchmarking tools into legal and financial workflows.
  • In January, 2025, Equifax Inc. launched its Equifax Credit Abuse Risk Model, a new tool designed to protect lenders from the financial impact of first-party fraud by identifying high-risk behaviors.
  • In October, 2024, NTT DATA officially expanded its presence into the Middle East by acquiring the cloud consultancy Zero and One, securing specialized generative AI and data analytics competencies to meet regional compliance and intelligence needs.

Dive into Technavio’s robust research methodology, blending expert interviews, extensive data synthesis, and validated models for unparalleled Business Information Market insights. See full methodology.

Market Scope
Page number 302
Base year 2025
Historic period 2020-2024
Forecast period 2026-2030
Growth momentum & CAGR Accelerate at a CAGR of 6%
Market growth 2026-2030 USD 62710.9 million
Market structure Fragmented
YoY growth 2025-2026(%) 5.7%
Key countries US, Canada, Mexico, UK, Germany, France, Italy, Spain, The Netherlands, China, Japan, India, South Korea, Australia, Indonesia, UAE, Saudi Arabia, South Africa, Egypt, Israel, Brazil, Argentina and Colombia
Competitive landscape Leading Companies, Market Positioning of Companies, Competitive Strategies, and Industry Risks

Request Free Sample

Research Analyst Overview

  • The Business Information Market is defined by a technological pivot toward ai-augmented insights and automated decision-support systems. Agentic ai workflows and autonomous knowledge systems are fundamentally rearchitecting the value proposition, shifting from raw data to intelligence-as-a-service models. Organizations prioritize sovereign compute infrastructure and localized data autonomy to navigate complex data residency laws.
  • The industrialization of esg intelligence platforms and circular economy compliance tracking is a major driver, compelling firms to adopt supply chain ethics tracking and transparent reporting. The integration of high-frequency market data with real-time alternative data using predictive modeling software provides a significant competitive edge. In response to privacy regulations, data clean room technology and privacy-preserving analytics are becoming standard.
  • Meanwhile, no-code bi platforms and natural language query interfaces are democratizing access to firmographic data feeds and corporate transaction intelligence. Ensuring accuracy in this automated environment requires generative model transparency, federated learning models, and rigorous human-in-the-loop verification.
  • Companies that successfully implement process intelligence integration have reported a 30% reduction in workflow processing times, directly impacting boardroom-level strategies for operational efficiency and compliance.

What are the Key Data Covered in this Business Information Market Research and Growth Report?

  • What is the expected growth of the Business Information Market between 2026 and 2030?

    • USD 62.71 billion, at a CAGR of 6%

  • What segmentation does the market report cover?

    • The report is segmented by End-user (BFSI, Retail, Healthcare and life sciences, Manufacturing, and Others), Application (B2B, and B2C), Component (Software, and Services) and Geography (North America, Europe, APAC, Middle East and Africa, South America)

  • Which regions are analyzed in the report?

    • North America, Europe, APAC, Middle East and Africa and South America

  • What are the key growth drivers and market challenges?

    • Mainstreaming of agentic AI and autonomous knowledge workflows, Escalating complexity in global data privacy compliance

  • Who are the major players in the Business Information Market?

    • Bloomberg LP, Capita Plc, CQG, Deloitte Touche Tohmatsu Ltd., Dun and Bradstreet Holdings Inc, Equifax Inc., Ernst and Young Global Ltd., Experian Plc, FactSet Research Systems Inc., Informa PLC, KPMG International Ltd., Moodys Corp., Morningstar Inc., News Corp., PricewaterhouseCoopers LLP, Refinitiv, RELX Plc, S and P Global Inc., Thomson Reuters Corp. and Wolters Kluwer NV

Market Research Insights

  • The market's dynamism is shaped by the transition toward actionable intelligence delivery and sophisticated strategic decision support. The adoption of an intelligence-as-a-service model allows organizations to move beyond raw data, with nearly 75% of knowledge workers now leveraging autonomous tools for reporting. This is critical for risk management and compliance, where real-time monitoring of regulatory shifts is paramount.
  • As enterprises prioritize corporate accountability metrics and transparent sustainability metrics reporting, the demand for verified data has intensified. This is particularly true for digital-native brand partnerships, which rely on secure data monetization strategies to grow. The challenge of a 16% growth in demand for specialized roles highlights the need for better data-literate workforce development to manage these advanced systems effectively.

We can help! Our analysts can customize this business information market research report to meet your requirements.

Get in touch

1. Executive Summary

1.1 Market overview

Executive Summary - Chart on Market Overview
Executive Summary - Data Table on Market Overview
Executive Summary - Chart on Global Market Characteristics
Executive Summary - Chart on Market by Geography
Executive Summary - Chart on Market Segmentation by End-user
Executive Summary - Chart on Market Segmentation by Application
Executive Summary - Chart on Market Segmentation by Component
Executive Summary - Chart on Incremental Growth
Executive Summary - Data Table on Incremental Growth
Executive Summary - Chart on Company Market Positioning

2. Technavio Analysis

2.1 Analysis of price sensitivity, lifecycle, customer purchase basket, adoption rates, and purchase criteria

2.2 Criticality of inputs and Factors of differentiation

Chart on Overview on criticality of inputs and factors of differentiation

2.3 Factors of disruption

Chart on Overview on factors of disruption

2.4 Impact of drivers and challenges

Chart on Impact of drivers and challenges in 2025 and 2030

3. Market Landscape

3.1 Market ecosystem

Chart on Parent Market
Data Table on - Parent Market

3.2 Market characteristics

Chart on Market characteristics analysis

3.3 Value chain analysis

Chart on Value chain analysis

4. Market Sizing

4.1 Market definition

Data Table on Offerings of companies included in the market definition

4.2 Market segment analysis

Market segments

4.3 Market size 2025

4.4 Market outlook: Forecast for 2025-2030

Chart on Global - Market size and forecast 2025-2030 ($ million)
Data Table on Global - Market size and forecast 2025-2030 ($ million)
Chart on Global Market: Year-over-year growth 2025-2030 (%)
Data Table on Global Market: Year-over-year growth 2025-2030 (%)

5. Historic Market Size

5.1 Global Business Information Market 2020 - 2024

Historic Market Size - Data Table on Global Business Information Market 2020 - 2024 ($ million)

5.2 End-user segment analysis 2020 - 2024

Historic Market Size - End-user Segment 2020 - 2024 ($ million)

5.3 Application segment analysis 2020 - 2024

Historic Market Size - Application Segment 2020 - 2024 ($ million)

5.4 Component segment analysis 2020 - 2024

Historic Market Size - Component Segment 2020 - 2024 ($ million)

5.5 Geography segment analysis 2020 - 2024

Historic Market Size - Geography Segment 2020 - 2024 ($ million)

5.6 Country segment analysis 2020 - 2024

Historic Market Size - Country Segment 2020 - 2024 ($ million)

6. Qualitative Analysis

6.1 Impact of AI in global business information market

7. Five Forces Analysis

7.1 Five forces summary

Five forces analysis - Comparison between 2025 and 2030

7.2 Bargaining power of buyers

Bargaining power of buyers - Impact of key factors 2025 and 2030

7.3 Bargaining power of suppliers

Bargaining power of suppliers - Impact of key factors in 2025 and 2030

7.4 Threat of new entrants

Threat of new entrants - Impact of key factors in 2025 and 2030

7.5 Threat of substitutes

Threat of substitutes - Impact of key factors in 2025 and 2030

7.6 Threat of rivalry

Threat of rivalry - Impact of key factors in 2025 and 2030

7.7 Market condition

Chart on Market condition - Five forces 2025 and 2030

8. Market Segmentation by End-user

8.1 Market segments

Chart on End-user - Market share 2025-2030 (%)
Data Table on End-user - Market share 2025-2030 (%)

8.2 Comparison by End-user

Chart on Comparison by End-user
Data Table on Comparison by End-user

8.3 BFSI - Market size and forecast 2025-2030

Chart on BFSI - Market size and forecast 2025-2030 ($ million)
Data Table on BFSI - Market size and forecast 2025-2030 ($ million)
Chart on BFSI - Year-over-year growth 2025-2030 (%)
Data Table on BFSI - Year-over-year growth 2025-2030 (%)

8.4 Retail - Market size and forecast 2025-2030

Chart on Retail - Market size and forecast 2025-2030 ($ million)
Data Table on Retail - Market size and forecast 2025-2030 ($ million)
Chart on Retail - Year-over-year growth 2025-2030 (%)
Data Table on Retail - Year-over-year growth 2025-2030 (%)

8.5 Healthcare and life sciences - Market size and forecast 2025-2030

Chart on Healthcare and life sciences - Market size and forecast 2025-2030 ($ million)
Data Table on Healthcare and life sciences - Market size and forecast 2025-2030 ($ million)
Chart on Healthcare and life sciences - Year-over-year growth 2025-2030 (%)
Data Table on Healthcare and life sciences - Year-over-year growth 2025-2030 (%)

8.6 Manufacturing - Market size and forecast 2025-2030

Chart on Manufacturing - Market size and forecast 2025-2030 ($ million)
Data Table on Manufacturing - Market size and forecast 2025-2030 ($ million)
Chart on Manufacturing - Year-over-year growth 2025-2030 (%)
Data Table on Manufacturing - Year-over-year growth 2025-2030 (%)

8.7 Others - Market size and forecast 2025-2030

Chart on Others - Market size and forecast 2025-2030 ($ million)
Data Table on Others - Market size and forecast 2025-2030 ($ million)
Chart on Others - Year-over-year growth 2025-2030 (%)
Data Table on Others - Year-over-year growth 2025-2030 (%)

8.8 Market opportunity by End-user

Market opportunity by End-user ($ million)
Data Table on Market opportunity by End-user ($ million)

9. Market Segmentation by Application

9.1 Market segments

Chart on Application - Market share 2025-2030 (%)
Data Table on Application - Market share 2025-2030 (%)

9.2 Comparison by Application

Chart on Comparison by Application
Data Table on Comparison by Application

9.3 B2B - Market size and forecast 2025-2030

Chart on B2B - Market size and forecast 2025-2030 ($ million)
Data Table on B2B - Market size and forecast 2025-2030 ($ million)
Chart on B2B - Year-over-year growth 2025-2030 (%)
Data Table on B2B - Year-over-year growth 2025-2030 (%)

9.4 B2C - Market size and forecast 2025-2030

Chart on B2C - Market size and forecast 2025-2030 ($ million)
Data Table on B2C - Market size and forecast 2025-2030 ($ million)
Chart on B2C - Year-over-year growth 2025-2030 (%)
Data Table on B2C - Year-over-year growth 2025-2030 (%)

9.5 Market opportunity by Application

Market opportunity by Application ($ million)
Data Table on Market opportunity by Application ($ million)

10. Market Segmentation by Component

10.1 Market segments

Chart on Component - Market share 2025-2030 (%)
Data Table on Component - Market share 2025-2030 (%)

10.2 Comparison by Component

Chart on Comparison by Component
Data Table on Comparison by Component

10.3 Software - Market size and forecast 2025-2030

Chart on Software - Market size and forecast 2025-2030 ($ million)
Data Table on Software - Market size and forecast 2025-2030 ($ million)
Chart on Software - Year-over-year growth 2025-2030 (%)
Data Table on Software - Year-over-year growth 2025-2030 (%)

10.4 Services - Market size and forecast 2025-2030

Chart on Services - Market size and forecast 2025-2030 ($ million)
Data Table on Services - Market size and forecast 2025-2030 ($ million)
Chart on Services - Year-over-year growth 2025-2030 (%)
Data Table on Services - Year-over-year growth 2025-2030 (%)

10.5 Market opportunity by Component

Market opportunity by Component ($ million)
Data Table on Market opportunity by Component ($ million)

11. Customer Landscape

11.1 Customer landscape overview

Analysis of price sensitivity, lifecycle, customer purchase basket, adoption rates, and purchase criteria

12. Geographic Landscape

12.1 Geographic segmentation

Chart on Market share by geography 2025-2030 (%)
Data Table on Market share by geography 2025-2030 (%)

12.2 Geographic comparison

Chart on Geographic comparison
Data Table on Geographic comparison

12.3 North America - Market size and forecast 2025-2030

Chart on North America - Market size and forecast 2025-2030 ($ million)
Data Table on North America - Market size and forecast 2025-2030 ($ million)
Chart on North America - Year-over-year growth 2025-2030 (%)
Data Table on North America - Year-over-year growth 2025-2030 (%)
Chart on Regional Comparison - North America
Data Table on Regional Comparison - North America

12.3.1 US - Market size and forecast 2025-2030

Chart on US - Market size and forecast 2025-2030 ($ million)
Data Table on US - Market size and forecast 2025-2030 ($ million)
Chart on US - Year-over-year growth 2025-2030 (%)
Data Table on US - Year-over-year growth 2025-2030 (%)

12.3.2 Canada - Market size and forecast 2025-2030

Chart on Canada - Market size and forecast 2025-2030 ($ million)
Data Table on Canada - Market size and forecast 2025-2030 ($ million)
Chart on Canada - Year-over-year growth 2025-2030 (%)
Data Table on Canada - Year-over-year growth 2025-2030 (%)

12.3.3 Mexico - Market size and forecast 2025-2030

Chart on Mexico - Market size and forecast 2025-2030 ($ million)
Data Table on Mexico - Market size and forecast 2025-2030 ($ million)
Chart on Mexico - Year-over-year growth 2025-2030 (%)
Data Table on Mexico - Year-over-year growth 2025-2030 (%)

12.4 Europe - Market size and forecast 2025-2030

Chart on Europe - Market size and forecast 2025-2030 ($ million)
Data Table on Europe - Market size and forecast 2025-2030 ($ million)
Chart on Europe - Year-over-year growth 2025-2030 (%)
Data Table on Europe - Year-over-year growth 2025-2030 (%)
Chart on Regional Comparison - Europe
Data Table on Regional Comparison - Europe

12.4.1 UK - Market size and forecast 2025-2030

Chart on UK - Market size and forecast 2025-2030 ($ million)
Data Table on UK - Market size and forecast 2025-2030 ($ million)
Chart on UK - Year-over-year growth 2025-2030 (%)
Data Table on UK - Year-over-year growth 2025-2030 (%)

12.4.2 Germany - Market size and forecast 2025-2030

Chart on Germany - Market size and forecast 2025-2030 ($ million)
Data Table on Germany - Market size and forecast 2025-2030 ($ million)
Chart on Germany - Year-over-year growth 2025-2030 (%)
Data Table on Germany - Year-over-year growth 2025-2030 (%)

12.4.3 France - Market size and forecast 2025-2030

Chart on France - Market size and forecast 2025-2030 ($ million)
Data Table on France - Market size and forecast 2025-2030 ($ million)
Chart on France - Year-over-year growth 2025-2030 (%)
Data Table on France - Year-over-year growth 2025-2030 (%)

12.4.4 Italy - Market size and forecast 2025-2030

Chart on Italy - Market size and forecast 2025-2030 ($ million)
Data Table on Italy - Market size and forecast 2025-2030 ($ million)
Chart on Italy - Year-over-year growth 2025-2030 (%)
Data Table on Italy - Year-over-year growth 2025-2030 (%)

12.4.5 Spain - Market size and forecast 2025-2030

Chart on Spain - Market size and forecast 2025-2030 ($ million)
Data Table on Spain - Market size and forecast 2025-2030 ($ million)
Chart on Spain - Year-over-year growth 2025-2030 (%)
Data Table on Spain - Year-over-year growth 2025-2030 (%)

12.4.6 The Netherlands - Market size and forecast 2025-2030

Chart on The Netherlands - Market size and forecast 2025-2030 ($ million)
Data Table on The Netherlands - Market size and forecast 2025-2030 ($ million)
Chart on The Netherlands - Year-over-year growth 2025-2030 (%)
Data Table on The Netherlands - Year-over-year growth 2025-2030 (%)

12.5 APAC - Market size and forecast 2025-2030

Chart on APAC - Market size and forecast 2025-2030 ($ million)
Data Table on APAC - Market size and forecast 2025-2030 ($ million)
Chart on APAC - Year-over-year growth 2025-2030 (%)
Data Table on APAC - Year-over-year growth 2025-2030 (%)
Chart on Regional Comparison - APAC
Data Table on Regional Comparison - APAC

12.5.1 China - Market size and forecast 2025-2030

Chart on China - Market size and forecast 2025-2030 ($ million)
Data Table on China - Market size and forecast 2025-2030 ($ million)
Chart on China - Year-over-year growth 2025-2030 (%)
Data Table on China - Year-over-year growth 2025-2030 (%)

12.5.2 Japan - Market size and forecast 2025-2030

Chart on Japan - Market size and forecast 2025-2030 ($ million)
Data Table on Japan - Market size and forecast 2025-2030 ($ million)
Chart on Japan - Year-over-year growth 2025-2030 (%)
Data Table on Japan - Year-over-year growth 2025-2030 (%)

12.5.3 India - Market size and forecast 2025-2030

Chart on India - Market size and forecast 2025-2030 ($ million)
Data Table on India - Market size and forecast 2025-2030 ($ million)
Chart on India - Year-over-year growth 2025-2030 (%)
Data Table on India - Year-over-year growth 2025-2030 (%)

12.5.4 South Korea - Market size and forecast 2025-2030

Chart on South Korea - Market size and forecast 2025-2030 ($ million)
Data Table on South Korea - Market size and forecast 2025-2030 ($ million)
Chart on South Korea - Year-over-year growth 2025-2030 (%)
Data Table on South Korea - Year-over-year growth 2025-2030 (%)

12.5.5 Australia - Market size and forecast 2025-2030

Chart on Australia - Market size and forecast 2025-2030 ($ million)
Data Table on Australia - Market size and forecast 2025-2030 ($ million)
Chart on Australia - Year-over-year growth 2025-2030 (%)
Data Table on Australia - Year-over-year growth 2025-2030 (%)

12.5.6 Indonesia - Market size and forecast 2025-2030

Chart on Indonesia - Market size and forecast 2025-2030 ($ million)
Data Table on Indonesia - Market size and forecast 2025-2030 ($ million)
Chart on Indonesia - Year-over-year growth 2025-2030 (%)
Data Table on Indonesia - Year-over-year growth 2025-2030 (%)

12.6 Middle East and Africa - Market size and forecast 2025-2030

Chart on Middle East and Africa - Market size and forecast 2025-2030 ($ million)
Data Table on Middle East and Africa - Market size and forecast 2025-2030 ($ million)
Chart on Middle East and Africa - Year-over-year growth 2025-2030 (%)
Data Table on Middle East and Africa - Year-over-year growth 2025-2030 (%)
Chart on Regional Comparison - Middle East and Africa
Data Table on Regional Comparison - Middle East and Africa

12.6.1 UAE - Market size and forecast 2025-2030

Chart on UAE - Market size and forecast 2025-2030 ($ million)
Data Table on UAE - Market size and forecast 2025-2030 ($ million)
Chart on UAE - Year-over-year growth 2025-2030 (%)
Data Table on UAE - Year-over-year growth 2025-2030 (%)

12.6.2 Saudi Arabia - Market size and forecast 2025-2030

Chart on Saudi Arabia - Market size and forecast 2025-2030 ($ million)
Data Table on Saudi Arabia - Market size and forecast 2025-2030 ($ million)
Chart on Saudi Arabia - Year-over-year growth 2025-2030 (%)
Data Table on Saudi Arabia - Year-over-year growth 2025-2030 (%)

12.6.3 South Africa - Market size and forecast 2025-2030

Chart on South Africa - Market size and forecast 2025-2030 ($ million)
Data Table on South Africa - Market size and forecast 2025-2030 ($ million)
Chart on South Africa - Year-over-year growth 2025-2030 (%)
Data Table on South Africa - Year-over-year growth 2025-2030 (%)

12.6.4 Egypt - Market size and forecast 2025-2030

Chart on Egypt - Market size and forecast 2025-2030 ($ million)
Data Table on Egypt - Market size and forecast 2025-2030 ($ million)
Chart on Egypt - Year-over-year growth 2025-2030 (%)
Data Table on Egypt - Year-over-year growth 2025-2030 (%)

12.6.5 Israel - Market size and forecast 2025-2030

Chart on Israel - Market size and forecast 2025-2030 ($ million)
Data Table on Israel - Market size and forecast 2025-2030 ($ million)
Chart on Israel - Year-over-year growth 2025-2030 (%)
Data Table on Israel - Year-over-year growth 2025-2030 (%)

12.7 South America - Market size and forecast 2025-2030

Chart on South America - Market size and forecast 2025-2030 ($ million)
Data Table on South America - Market size and forecast 2025-2030 ($ million)
Chart on South America - Year-over-year growth 2025-2030 (%)
Data Table on South America - Year-over-year growth 2025-2030 (%)
Chart on Regional Comparison - South America
Data Table on Regional Comparison - South America

12.7.1 Brazil - Market size and forecast 2025-2030

Chart on Brazil - Market size and forecast 2025-2030 ($ million)
Data Table on Brazil - Market size and forecast 2025-2030 ($ million)
Chart on Brazil - Year-over-year growth 2025-2030 (%)
Data Table on Brazil - Year-over-year growth 2025-2030 (%)

12.7.2 Argentina - Market size and forecast 2025-2030

Chart on Argentina - Market size and forecast 2025-2030 ($ million)
Data Table on Argentina - Market size and forecast 2025-2030 ($ million)
Chart on Argentina - Year-over-year growth 2025-2030 (%)
Data Table on Argentina - Year-over-year growth 2025-2030 (%)

12.7.3 Colombia - Market size and forecast 2025-2030

Chart on Colombia - Market size and forecast 2025-2030 ($ million)
Data Table on Colombia - Market size and forecast 2025-2030 ($ million)
Chart on Colombia - Year-over-year growth 2025-2030 (%)
Data Table on Colombia - Year-over-year growth 2025-2030 (%)

12.8 Market opportunity by geography

Market opportunity by geography ($ million)
Data Tables on Market opportunity by geography ($ million)

13. Drivers, Challenges, and Opportunity

13.1 Market drivers

Mainstreaming of agentic AI and autonomous knowledge workflows
Proliferation of real-time sovereign compute and localized data autonomy
Industrialization of ESG intelligence and circular economy compliance tracking

13.2 Market challenges

Escalating complexity in global data privacy compliance
Volatility and integrity concerns in AI-generated information
Integration obstacles and shortage of specialized technical talent

13.3 Impact of drivers and challenges

Impact of drivers and challenges in 2025 and 2030

13.4 Market opportunities

High-frequency market intelligence and integration of real-time alternative data
Emergence of data clean rooms and preserving collaborative analytics
Democratization of business intelligence through no-code and natural language interfaces

14. Competitive Landscape

14.1 Overview

14.2

Overview on criticality of inputs and factors of differentiation

14.3 Landscape disruption

Overview on factors of disruption

14.4 Industry risks

Impact of key risks on business

15. Competitive Analysis

15.1 Companies profiled

Companies covered

15.2 Company ranking index

15.3 Market positioning of companies

Matrix on companies position and classification

15.4 Bloomberg LP

Bloomberg LP - Overview
Bloomberg LP - Product / Service
Bloomberg LP - Key offerings
SWOT

15.5 Deloitte Touche Tohmatsu Ltd.

Deloitte Touche Tohmatsu Ltd. - Overview
Deloitte Touche Tohmatsu Ltd. - Business segments
Deloitte Touche Tohmatsu Ltd. - Key offerings
Deloitte Touche Tohmatsu Ltd. - Segment focus
SWOT

15.6 Dun and Bradstreet Holdings Inc

Dun and Bradstreet Holdings Inc - Overview
Dun and Bradstreet Holdings Inc - Business segments
Dun and Bradstreet Holdings Inc - Key offerings
Dun and Bradstreet Holdings Inc - Segment focus
SWOT

15.7 Equifax Inc.

Equifax Inc. - Overview
Equifax Inc. - Business segments
Equifax Inc. - Key offerings
Equifax Inc. - Segment focus
SWOT

15.8 Ernst and Young Global Ltd.

Ernst and Young Global Ltd. - Overview
Ernst and Young Global Ltd. - Product / Service
Ernst and Young Global Ltd. - Key offerings
SWOT

15.9 Experian Plc

Experian Plc - Overview
Experian Plc - Business segments
Experian Plc - Key offerings
Experian Plc - Segment focus
SWOT

15.10 FactSet Research Systems Inc.

FactSet Research Systems Inc. - Overview
FactSet Research Systems Inc. - Business segments
FactSet Research Systems Inc. - Key offerings
FactSet Research Systems Inc. - Segment focus
SWOT

15.11 Informa PLC

Informa PLC - Overview
Informa PLC - Business segments
Informa PLC - Key offerings
Informa PLC - Segment focus
SWOT

15.12 KPMG International Ltd.

KPMG International Ltd. - Overview
KPMG International Ltd. - Product / Service
KPMG International Ltd. - Key offerings
SWOT

15.13 Moodys Corp.

Moodys Corp. - Overview
Moodys Corp. - Business segments
Moodys Corp. - Key news
Moodys Corp. - Key offerings
Moodys Corp. - Segment focus
SWOT

15.14 Morningstar Inc.

Morningstar Inc. - Overview
Morningstar Inc. - Product / Service
Morningstar Inc. - Key offerings
SWOT

15.15 News Corp.

News Corp. - Overview
News Corp. - Business segments
News Corp. - Key offerings
News Corp. - Segment focus
SWOT

15.16 PricewaterhouseCoopers LLP

PricewaterhouseCoopers LLP - Overview
PricewaterhouseCoopers LLP - Product / Service
PricewaterhouseCoopers LLP - Key offerings
SWOT

15.17 S and P Global Inc.

S and P Global Inc. - Overview
S and P Global Inc. - Business segments
S and P Global Inc. - Key offerings
S and P Global Inc. - Segment focus
SWOT

15.18 Thomson Reuters Corp.

Thomson Reuters Corp. - Overview
Thomson Reuters Corp. - Business segments
Thomson Reuters Corp. - Key news
Thomson Reuters Corp. - Key offerings
Thomson Reuters Corp. - Segment focus
SWOT

16. Appendix

16.1 Scope of the report

Market definition
Objectives
Notes and caveats

16.2 Inclusions and exclusions checklist

Inclusions checklist
Exclusions checklist

16.3 Currency conversion rates for US$

16.4 Research methodology

16.5 Data procurement

Information sources

16.6 Data validation

16.7 Validation techniques employed for market sizing

16.8 Data synthesis

16.9 360 degree market analysis

16.10 List of abbreviations

Research Methodology

Technavio presents a detailed picture of the market by way of study, synthesis, and summation of data from multiple sources. The analysts have presented the various facets of the market with a particular focus on identifying the key industry influencers. The data thus presented is comprehensive, reliable, and the result of extensive research, both primary and secondary.

INFORMATION SOURCES

Primary sources

  • Manufacturers and suppliers
  • Channel partners
  • Industry experts
  • Strategic decision makers

Secondary sources

  • Industry journals and periodicals
  • Government data
  • Financial reports of key industry players
  • Historical data
  • Press releases

DATA ANALYSIS

Data Synthesis

  • Collation of data
  • Estimation of key figures
  • Analysis of derived insights

Data Validation

  • Triangulation with data models
  • Reference against proprietary databases
  • Corroboration with industry experts

REPORT WRITING

Qualitative

  • Market drivers
  • Market challenges
  • Market trends
  • Five forces analysis

Quantitative

  • Market size and forecast
  • Market segmentation
  • Geographical insights
  • Competitive landscape

Interested in this report?

Get your sample now to see our research methodology and insights!

Download Now

Frequently Asked Questions

Business Information market growth will increase by USD 62710.9 million during 2026-2030.

The Business Information market is expected to grow at a CAGR of 6% during 2026-2030.

Business Information market is segmented by End-user (BFSI, Retail, Healthcare and life sciences, Manufacturing, Others) Application (B2B, B2C) Component (Software, Services)

Bloomberg LP, Capita Plc, CQG, Deloitte Touche Tohmatsu Ltd., Dun and Bradstreet Holdings Inc, Equifax Inc., Ernst and Young Global Ltd., Experian Plc, FactSet Research Systems Inc., Informa PLC, KPMG International Ltd., Moodys Corp., Morningstar Inc., News Corp., PricewaterhouseCoopers LLP, Refinitiv, RELX Plc, S and P Global Inc., Thomson Reuters Corp., Wolters Kluwer NV are a few of the key vendors in the Business Information market.

North America will register the highest growth rate of 36.4% among the other regions. Therefore, the Business Information market in North America is expected to garner significant business opportunities for the vendors during the forecast period.

US, Canada, Mexico, UK, Germany, France, Italy, Spain, The Netherlands, China, Japan, India, South Korea, Australia, Indonesia, UAE, Saudi Arabia, South Africa, Egypt, Israel, Brazil, Argentina, Colombia

  • Mainstreaming of agentic AI and autonomous knowledge workflows is the driving factor this market.

The Business Information market vendors should focus on grabbing business opportunities from the End-user segment as it accounted for the largest market share in the base year.
RIA - Research AI Assistant
Ask RIA