Online Trading Platform Market Size 2025-2029
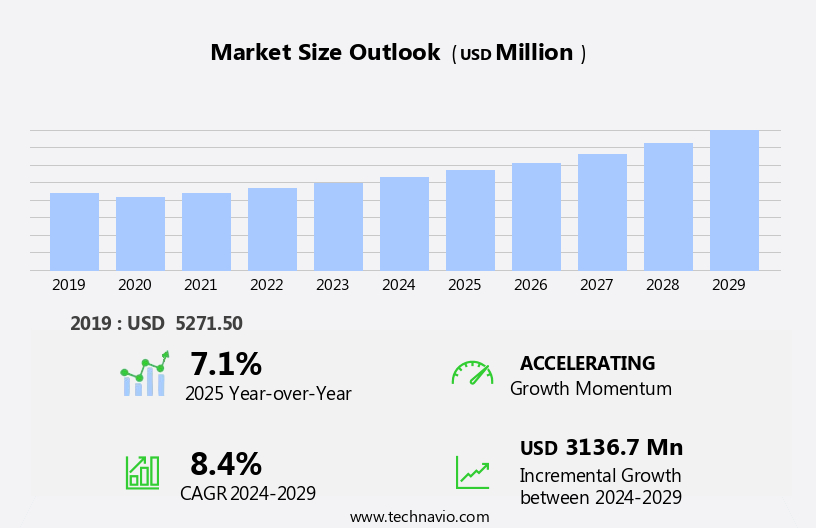
The online trading platform market size is forecast to increase by USD 3.14 billion at a CAGR of 8.4% between 2024 and 2029.
- The market in APAC is experiencing significant growth, driven by increasing financial literacy and digitalization. With the region's large and growing population of tech-savvy investors, there is a surging demand for convenient and accessible trading solutions. Moreover, the adoption of advanced technologies such as machine learning and AI is revolutionizing the trading landscape, offering personalized investment recommendations and automated trading. However, this market is not without challenges. Security concerns, regulatory compliance, and the need for reliable internet connectivity remain significant barriers to entry.
- The market's growth is further facilitated by cloud-based solutions, mobile apps, and commissions. Additionally, the high competition among established players and new entrants necessitates continuous innovation and differentiation to capture market share. Companies seeking to capitalize on this market's opportunities must navigate these challenges effectively by focusing on strong security measures, regulatory compliance, and user-friendly interfaces. By staying abreast of the latest technological trends and investor demands, they can position themselves as leaders in the evolving market.
What will be the Size of the Online Trading Platform Market during the forecast period?
- The market encompasses software solutions that enable users to buy and sell financial assets, including international currencies and stocks, via live market prices. These platforms offer a range of financial tools, often accessible through banks, smartphones, and nonprofit banks. Cloud-based solutions, powered by big data, machine learning, and predictive analytics, dominate the landscape. Commissions are typically charged based on transaction volume, attracting institutional investors and electronic trading platforms. Market abuse and trade surveillance systems ensure market stability and integrity, while high-frequency trading and real-time data cater to the needs of sophisticated investors. The market for trading platforms includes user-friendly interfaces, mobile trading apps, digital brokers, and automated trading systems for equity, options, and cryptocurrency trading.
- Account security and transaction fees are crucial considerations for users, with market access and portfolio management features adding value. The global trading platform market continues to grow, driven by the increasing digitization of financial services and the demand for efficient, accessible investment tools.
How is this Online Trading Platform Industry segmented?
The online trading platform industry research report provides comprehensive data (region-wise segment analysis), with forecasts and estimates in "USD million" for the period 2025-2029, as well as historical data from 2019-2023 for the following segments.
- Type
- Commissions
- Transaction fees
- Deployment
- Cloud
- On-premises
- Application
- Institutional investors
- Retail investors
- Geography
- North America
- US
- Canada
- Europe
- France
- Germany
- Italy
- UK
- APAC
- China
- India
- Japan
- Middle East and Africa
- South America
- Brazil
- North America
By Type Insights
The commissions segment is estimated to witness significant growth during the forecast period. The market is segmented into commissions and transaction fees based on payment structures. Commissions, the larger market shareholder, are fees charged by brokers or investment advisors for their services, including investment advice and securities transactions. Clients benefit from commissions as they only pay when executing trades. However, commissions serve as incentives for brokers to facilitate a high volume of transactions, leading to their regulation by the Securities and Exchange Commission (SEC). This market encompasses various financial tools, individual brokers, and customized trading platforms, catering to retail investors, private banking institutions, and institutional investors. It includes cloud-based solutions, machine learning, predictive analytics, and market surveillance systems for market stability and integrity.
Additionally, the market incorporates non-profit banks, perpetual trading platforms, and the emerging digital asset ecosystem, including Bitcoin NFTs, Blockchain technology, decentralized finance protocols, and Artificial Intelligence applications such as generative AI, recurrent neural networks, and generative adversarial networks. Transaction fees, an alternative payment structure, are a flat rate or percentage of the trade value. Both commission and transaction fee structures cater to various market participants and trading scenarios.
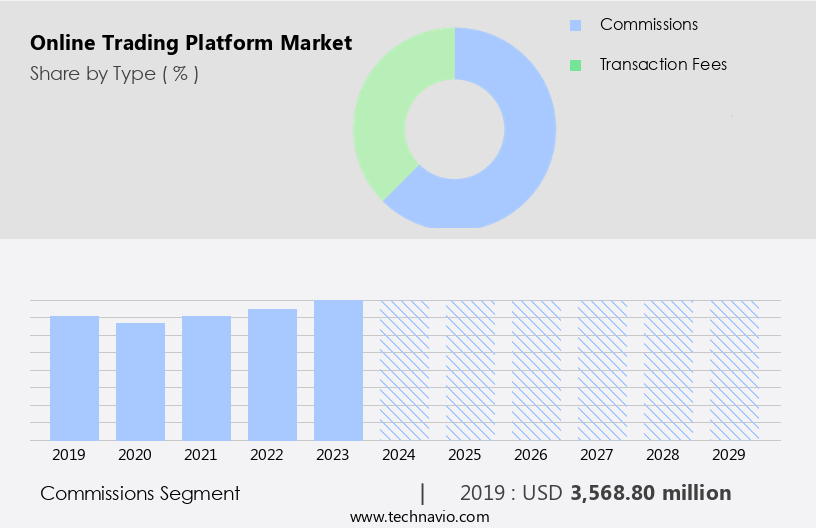
Get a glance at the market report of share of various segments Request Free Sample
The Commissions segment was valued at USD 3.57 billion in 2019 and showed a gradual increase during the forecast period.
Regional Analysis
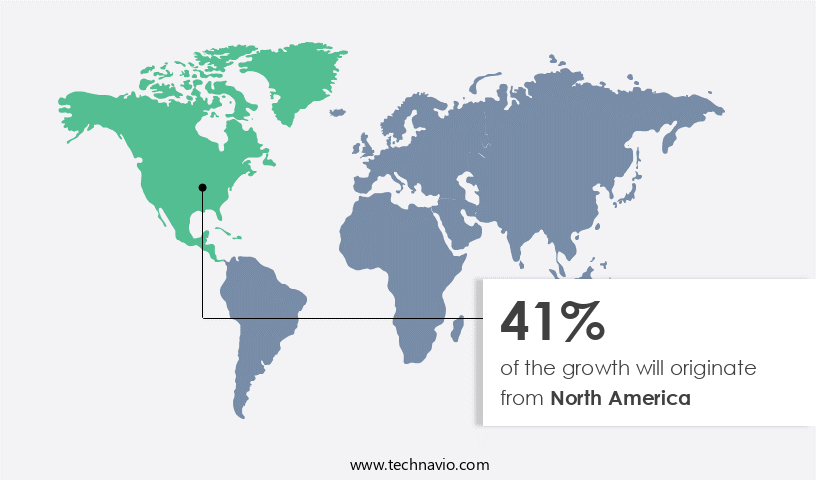
North America is estimated to contribute 41% to the growth of the global market during the forecast period. Technavio's analysts have elaborately explained the regional trends and drivers that shape the market during the forecast period.
For more insights on the market size of various regions, Request Free Sample
The market in North America is expected to maintain its dominance with the largest market share through 2024. Factors contributing to this growth include increasing urbanization and digitalization, continuous trade monitoring and surveillance, the presence of retail and institutional traders, and a focus on technology development. The region's market is further driven by the adoption of advanced financial tools such as Artificial Intelligence (AI) and machine learning. Key players, including Chetu Inc., ETNA, Artezio LLC, and EffectiveSoft Corp., are based in North America and contribute significantly to the market's growth. The integration of non-profit banks, perpetual trading platforms, and digital asset ecosystems, including Bitcoin NFTs and Decentralized Finance protocols, is also driving market expansion.
Institutional investors and large enterprises are increasingly partnering with trading platforms for strategy testing and transaction fees. Market integrity and market stability remain crucial, with electronic trading platforms implementing market abuse surveillance and trade surveillance systems to ensure high frequency trading and market integrity.
Market Dynamics
Our researchers analyzed the data with 2024 as the base year, along with the key drivers, trends, and challenges. A holistic analysis of drivers will help companies refine their marketing strategies to gain a competitive advantage.
What are the key market drivers leading to the rise in the adoption of Online Trading Platform Industry?
- Growth opportunities and demand for online trading platforms in APAC is the key driver of the market. In developed economies of North America and Europe, the adoption of advanced online trading platforms is on the rise among hedge funds, financial institutions, and brokers. This trend is driven by the need to expand business operations effectively. The market is witnessing significant growth as companies expand their reach to countries like China, Japan, Singapore, and India in the Asia Pacific region (APAC). This strategic move presents ample opportunities for market participants to gain a competitive edge. Furthermore, the focus on developing advanced online trading solutions is a key trend, enabling companies to stay informed about market trends in APAC.
- Global players and startups are investing in innovative technologies to cater to the evolving needs of trading entities. This dynamic market landscape underscores the importance of staying updated on the latest developments to capitalize on opportunities.
What are the market trends shaping the Online Trading Platform Industry?
- Adoption of machine learning and AI is the upcoming market trend. The integration of artificial intelligence (AI) and machine learning tools in online trading platforms is gaining momentum due to the demands of financial traders for advanced technological solutions. Traders face significant pressure to monitor markets and make informed decisions quickly, leading to the adoption of AI and machine learning technologies. These advanced tools enable the analysis of complex trading data without the need for direct human inputs, reducing time and cost.
- AI and machine learning utilize sophisticated algorithms and software to deliver accurate and timely insights, enhancing profitability in online trading. The increasing need for a technologically advanced landscape in trading, coupled with the pressure to improve profit margins, is driving the market growth.
What challenges does the Online Trading Platform Industry face during its growth?
- Limitations associated with online trading platforms is a key challenge affecting the industry growth. The market faces challenges from technical issues and the necessity for constant monitoring. Trading systems may experience connectivity problems and other technical difficulties, leading to potential losses and disruptions. Power outages, system quirks, and computer crashes can also negatively impact the trading process. To mitigate these risks, trading companies employ automated systems and continuously monitor their platforms. This proactive approach enables them to quickly identify and address any issues, reducing errors and minimizing potential losses.
- However, overoptimization of trading plans can lead to unrealistic expectations of 100% profitability, potentially misguiding traders into making decisions based on flawed assumptions. It is crucial for market participants to maintain a balanced and informed approach to online trading.
Exclusive Customer Landscape
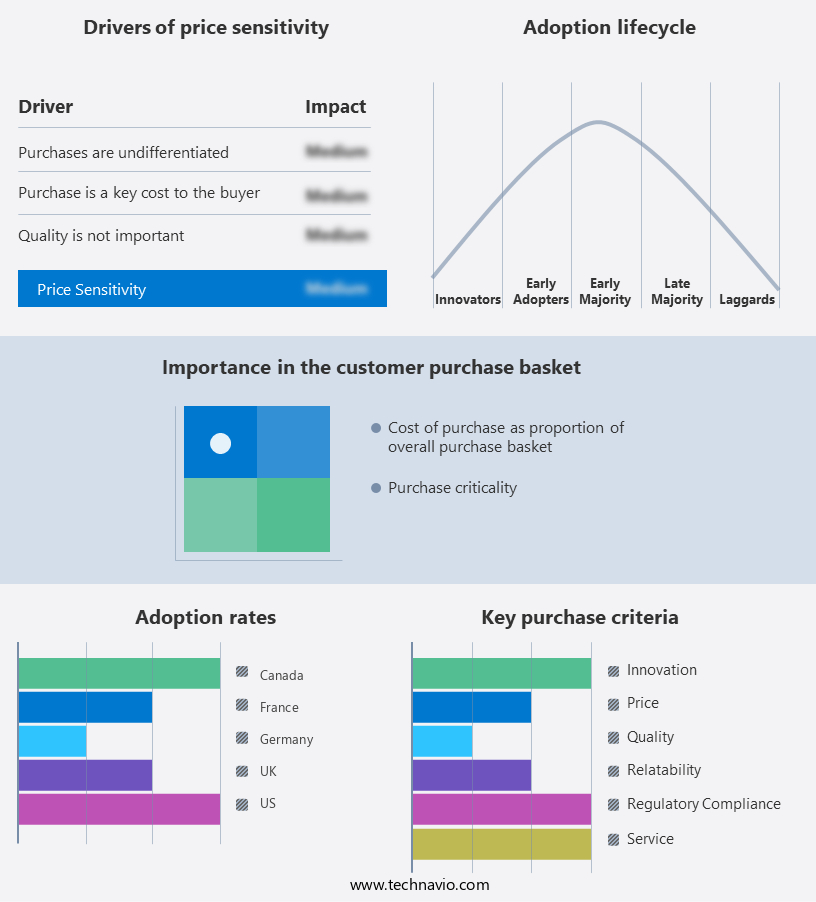
The online trading platform market forecasting report includes the adoption lifecycle of the market, covering from the innovator's stage to the laggard's stage. It focuses on adoption rates in different regions based on penetration. Furthermore, the online trading platform market report also includes key purchase criteria and drivers of price sensitivity to help companies evaluate and develop their market growth analysis strategies.
Customer Landscape
Key Companies & Market Insights
Companies are implementing various strategies, such as strategic alliances, online trading platform market forecast, partnerships, mergers and acquisitions, geographical expansion, and product/service launches, to enhance their presence in the industry.
AAX Ltd. - The company offers online trading platforms which provide spot and futures trading, low latency trading and others.
The industry research and growth report includes detailed analyses of the competitive landscape of the market and information about key companies, including:
- AAX Ltd.
- AlgoBulls Technologies Pvt. Ltd.
- Ally Financial Inc.
- Artezio LLC
- Chetu Inc.
- Devexperts LLC
- EffectiveSoft Corp.
- Empirica
- Eris Exchange LLC
- ETNA Software Corp.
- FMR LLC
- Interactive Brokers LLC
- MarketAxess Holdings Inc.
- Merrill Lynch Life Agency Inc.
- Morgan Stanley
- Plus500 Ltd.
- Pragmatic Coders
- Profile Systems and Software SA
- Robinhood Markets Inc
- TD Ameritrade Inc.
Qualitative and quantitative analysis of companies has been conducted to help clients understand the wider business environment as well as the strengths and weaknesses of key industry players. Data is qualitatively analyzed to categorize companies as pure play, category-focused, industry-focused, and diversified; it is quantitatively analyzed to categorize companies as dominant, leading, strong, tentative, and weak.
Research Analyst Overview
The market encompasses a dynamic and evolving landscape, characterized by the integration of advanced financial tools and technologies. These platforms facilitate the buying and selling of international currencies and various financial instruments, catering to individual brokers and a diverse range of investors. At the core of these platforms are live market prices, providing real-time access to global financial markets. The integration of artificial intelligence (AI) and machine learning algorithms enhances the user experience, enabling predictive analytics and strategy testing. The digital asset ecosystem, including cryptocurrencies and non-fungible tokens (NFTs), has significantly influenced the market. Blockchain technology underpins this ecosystem, ensuring transparency and security.
Generative AI, such as recurrent neural networks and generative adversarial networks, is employed to analyze market trends and generate trading signals. Cloud-based solutions dominate the market, offering flexibility and accessibility to retail investors and private banking institutions alike. Mobile app-based trading has further expanded the market's reach, enabling users to manage their investments on-the-go using smartphones. Transaction fees and commissions are essential considerations for users when choosing an online trading platform. Market stability and integrity are crucial aspects of the market, with market abuse surveillance and trade surveillance systems in place to maintain fairness and transparency.
Foreign trade and financial institutions are significant trade partners in the market. Institutional investors, including large enterprises, also play a significant role in shaping market dynamics. The integration of digital marketing strategies has broadened the reach of online trading platforms, attracting a wider audience. Traditional marketing methods continue to coexist, catering to various investor preferences. Online trading technology is a critical component of the financial services industry, offering numerous advantages, including reduced transaction costs, increased efficiency, and improved access to global markets. Support services, including customer service and educational resources, are essential to ensure a positive user experience.
Non-profit banks and other financial institutions are exploring the benefits of online trading platforms, recognizing their potential to enhance operational efficiency and expand their service offerings. The market's continued growth is driven by technological advancements, regulatory frameworks, and changing investor preferences.
|
Market Scope |
|
|
Report Coverage |
Details |
|
Page number |
198 |
|
Base year |
2024 |
|
Historic period |
2019-2023 |
|
Forecast period |
2025-2029 |
|
Growth momentum & CAGR |
Accelerate at a CAGR of 8.4% |
|
Market growth 2025-2029 |
USD 3.13 billion |
|
Market structure |
Fragmented |
|
YoY growth 2024-2025(%) |
7.1 |
|
Key countries |
US, Canada, China, UK, Japan, Germany, India, France, Brazil, and Italy |
|
Competitive landscape |
Leading Companies, Market Positioning of Companies, Competitive Strategies, and Industry Risks |
What are the Key Data Covered in this Online Trading Platform Market Research and Growth Report?
- CAGR of the Online Trading Platform industry during the forecast period
- Detailed information on factors that will drive the growth and forecasting between 2025 and 2029
- Precise estimation of the size of the market and its contribution of the industry in focus to the parent market
- Accurate predictions about upcoming growth and trends and changes in consumer behaviour
- Growth of the market across North America, Europe, APAC, Middle East and Africa, and South America
- Thorough analysis of the market's competitive landscape and detailed information about companies
- Comprehensive analysis of factors that will challenge the online trading platform market growth and forecasting
We can help! Our analysts can customize this online trading platform market research report to meet your requirements.
 RIA -
RIA - 
