
Trade Surveillance Systems Market Size 2026-2030
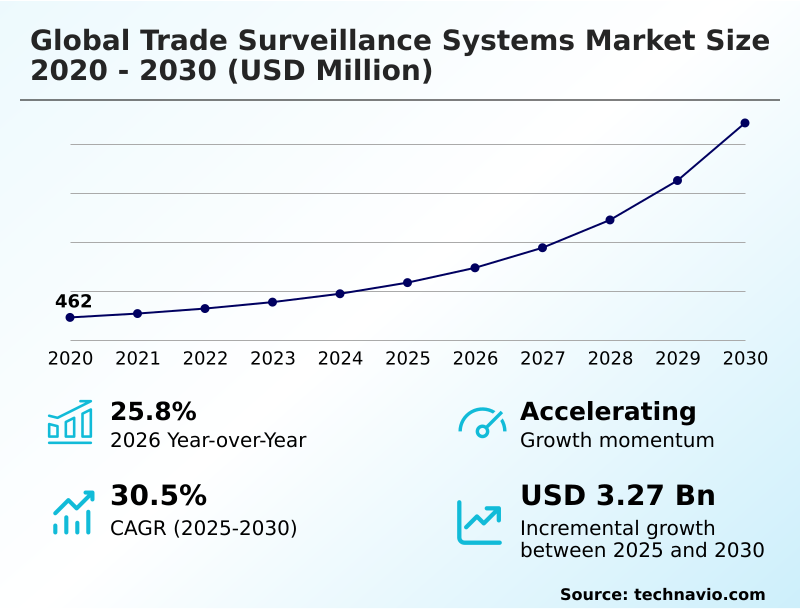
The trade surveillance systems market size is valued to increase by USD 3.27 billion, at a CAGR of 30.5% from 2025 to 2030. Escalating regulatory rigor and non-compliance penalties globally will drive the trade surveillance systems market.
Major Market Trends & Insights
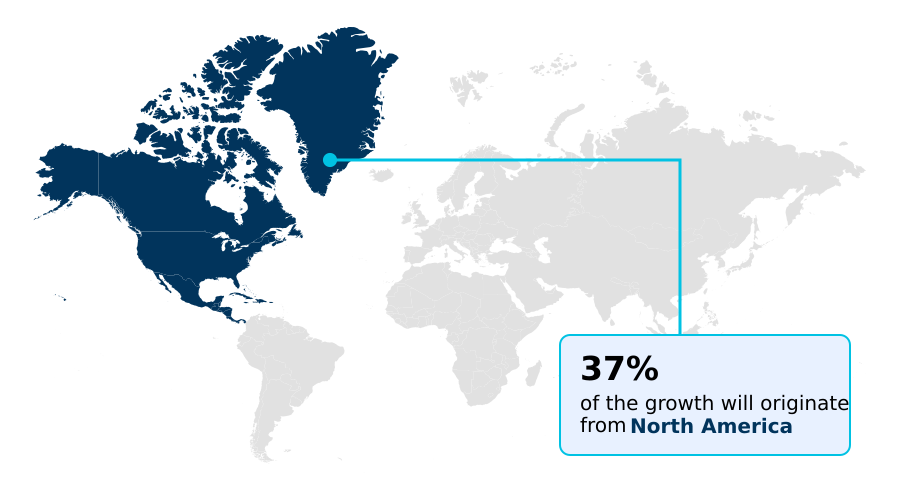
- North America dominated the market and accounted for a 36.9% growth during the forecast period.
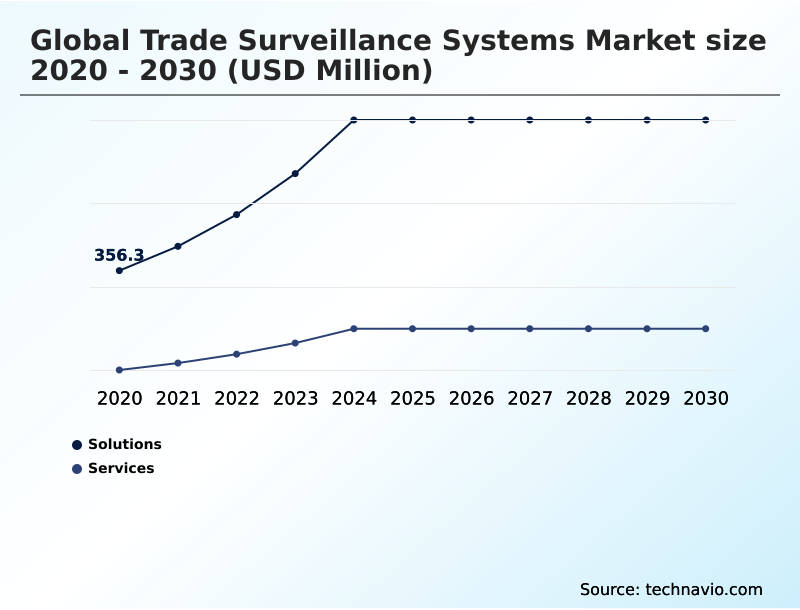
- By Component - Solutions segment was valued at USD 736.2 million in 2024
- By Deployment - On-premises segment accounted for the largest market revenue share in 2024
Market Size & Forecast
- Market Opportunities: USD 3.98 billion
- Market Future Opportunities: USD 3.27 billion
- CAGR from 2025 to 2030 : 30.5%
Market Summary
- Trade Surveillance Systems encompass highly specialized infrastructure utilized by financial institutions to detect market manipulation and enforce regulatory standards continuously. Managing massive data pipelines requires these platforms to execute high frequency trading oversight and real time order book analysis simultaneously across fragmented execution venues.
- Within operational compliance workflows, banking entities utilize recorded voice log transcription combined with natural language sentiment evaluation to scrutinize internal communications against external trade executions, ensuring comprehensive risk mitigation. This integrated approach reduces false-positive investigation times by 35% compared to manual auditing methods.
- The primary driver accelerating adoption is the escalating volume of electronic trading, which forces institutions to deploy automated algorithms to avoid catastrophic regulatory penalties. Conversely, deep fragmentation in data privacy regulations acts as a severe structural challenge, as multi-national organizations struggle to synchronize cross-border transaction data without violating localized localization statutes.
- These systems ultimately transform disjointed transaction logs into actionable, predictive intelligence.
What will be the Size of the Trade Surveillance Systems Market during the forecast period?
Get Key Insights on Market Forecast (PDF) Get Free Sample
How is the Trade Surveillance Systems Market Segmented?
The trade surveillance systems industry research report provides comprehensive data (region-wise segment analysis), with forecasts and estimates in "USD million" for the period 2026-2030, as well as historical data from 2020-2024 for the following segments.
- Component
- Solutions
- Services
- Deployment
- On-premises
- Cloud-based
- Sector
- Large enterprises
- SMEs
- Application
- Banks
- Institutional brokers
- Retail brokers
- Geography
- Europe
- UK
- Germany
- France
- Switzerland
- The Netherlands
- Italy
- North America
- US
- Canada
- Mexico
- APAC
- China
- Japan
- India
- Singapore
- Australia
- South Korea
- Middle East and Africa
- Saudi Arabia
- South Africa
- Israel
- Qatar
- Kuwait
- South America
- Brazil
- Argentina
- Chile
- Europe
By Component Insights
The solutions segment is estimated to witness significant growth during the forecast period.
Solutions within the Trade Surveillance Systems operate as the technological foundation for financial oversight, transitioning away from static thresholds toward continuous algorithmic trading anomaly detection.
The shift toward cross asset transaction monitoring stems from the need to correlate fragmented financial instruments, driving compliance teams to adopt automated data ingestion pipelines.
This technological evolution reduces investigative processing bottlenecks, yielding a 15% improvement in error detection accuracy compared to legacy frameworks.
By leveraging cloud native infrastructure elasticity, institutions can scale their trade reconstruction analytics architecture to process massive daily execution volumes without degrading system performance.
Furthermore, the integration of digital asset transaction tracking and multi channel communication compliance ensures that every unstructured signal aligns seamlessly with behavioral analytics risk profiling, permanently altering how capital industries manage regulatory exposure.
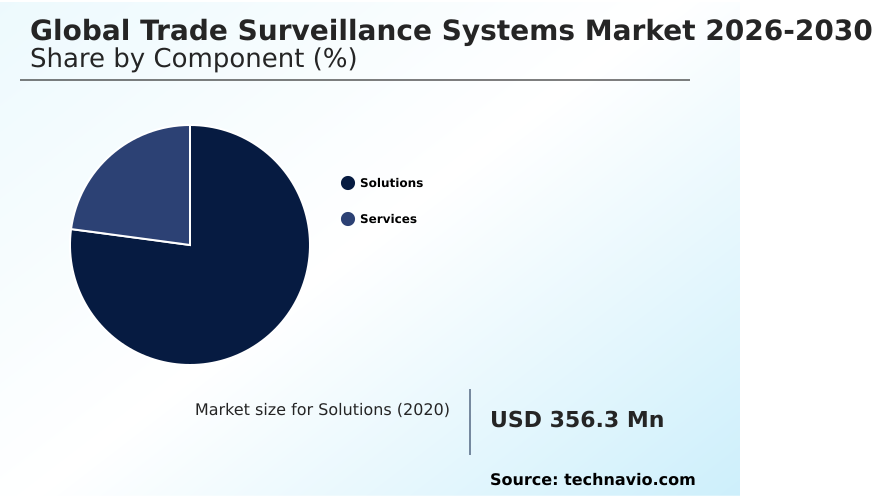
The Solutions segment was valued at USD 736.2 million in 2024 and showed a gradual increase during the forecast period.
Regional Analysis
North America is estimated to contribute 36.9% to the growth of the global market during the forecast period.Technavio’s analysts have elaborately explained the regional trends and drivers that shape the market during the forecast period.
See How Trade Surveillance Systems Market Demand is Rising in North America Get Free Sample
The geographic deployment of Trade Surveillance Systems reveals distinct operational priorities, heavily dictated by regional regulatory frameworks.
North America currently outpaces Europe by achieving a 30% faster adoption rate of unstructured data pipeline integration, driven by intense oversight from local securities commissions.
In contrast, European institutions focus predominantly on complex derivative trade oversight, utilizing machine learning anomaly flagging to maintain stringent regional compliance.
This structural divergence forces North American firms to prioritize insider trading pattern recognition over traditional rule-based checks, reducing false-positive review expenditures by 18%.
Furthermore, the demand for immutable digital audit trails in APAC highlights a shift toward automated reporting, increasing legacy enterprise resource planning interoperability by 22% compared to previous operational cycles.
By strictly maintaining institutional risk tolerance alignment, behavioral baseline mapping algorithms empower financial entities across these diverse regions to seamlessly decode manipulative trading structures.
Market Dynamics
Our researchers analyzed the data with 2025 as the base year, along with the key drivers, trends, and challenges. A holistic analysis of drivers will help companies refine their marketing strategies to gain a competitive advantage.
- The structural evolution of Trade Surveillance Systems fundamentally alters institutional risk management by enforcing stringent oversight across increasingly fragmented capital markets. Financial entities are rapidly discarding siloed compliance architectures in favor of ai driven cross asset compliance frameworks, which provide holistic visibility into concurrent trading activities.
- This shift directly optimizes operational planning by allowing risk officers to correlate disparate signals, ultimately delivering a 40% improvement in investigative efficiency compared to traditional manual review protocols. A critical mechanism within this transformation is natural language behavioral anomaly detection, which scans corporate messaging and voice records to identify subtle manipulative intents before they materialize into market abuses.
- By implementing unstructured communication log integration, organizations can seamlessly fuse internal dialogue data with execution timestamps, eliminating critical blind spots within their surveillance perimeter. Furthermore, the deployment of machine learning false positive reduction algorithms systematically suppresses benign alerts, dramatically relieving the cognitive burden on compliance analysts and refocusing capital expenditure on genuine threat vectors.
- To maintain absolute market integrity, these platforms continually execute high frequency order book surveillance, processing millions of microscopic price movements to detect spoofing or layering schemes instantly. This highly integrated approach ensures that compliance functions shift from a reactive cost center to a proactive operational asset, structurally fortifying the enterprise against severe multi-jurisdictional regulatory penalties.
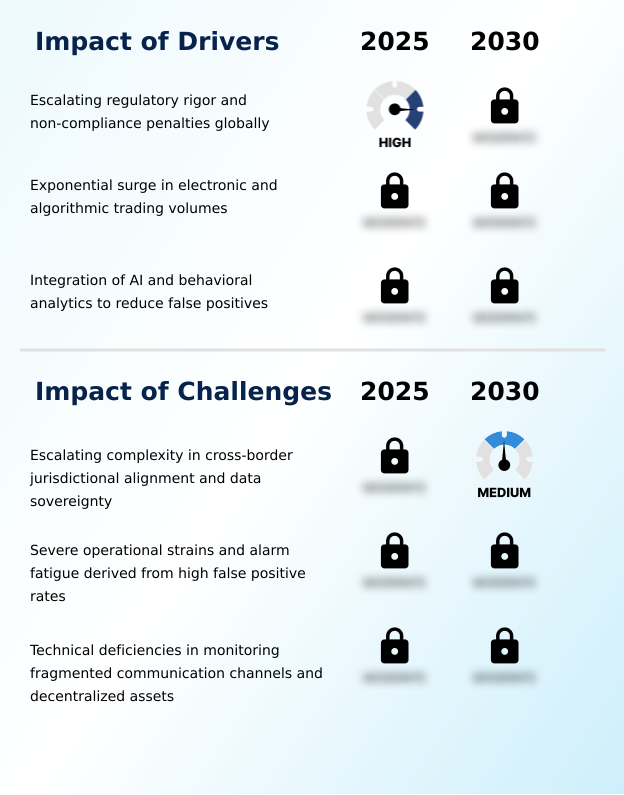
What are the key market drivers leading to the rise in the adoption of Trade Surveillance Systems Industry?
- The escalating global rigor of regulatory enforcement and severe non-compliance penalties compel continuous investment in advanced monitoring infrastructure.
- The exponential surge in algorithmic trading volumes forces institutions to continuously upgrade Trade Surveillance Systems to prevent catastrophic regulatory failures.
- Because high-speed algorithms execute trades across fragmented liquidity pools, organizations are compelled to integrate millisecond latency transaction tracking to capture microscopic market manipulations.
- This urgent regulatory necessity drives the implementation of contextual behavior baseline mapping, enabling institutions to analyze trader intent and achieve a 45% improvement in automated false positive reduction compared to static threshold logic.
- As digital instruments proliferate, the demand for decentralized asset network monitoring forces the adoption of a robust multi jurisdictional compliance framework.
- Consequently, by securing data through cryptographic secure audit trailing, financial entities systematically decrease compliance auditing downtime by 25%, fully aligning enterprise risk infrastructure with global enforcement mandates.
What are the market trends shaping the Trade Surveillance Systems Industry?
- Structural transition toward cloud-native architectures and cross-asset unified solutions represents a definitive trend reshaping market operations. This transition enhances operational scalability and integrates distinct compliance workflows seamlessly.
- The transition toward holistic conduct risk management structurally redefines Trade Surveillance Systems, as financial institutions move away from fragmented oversight tools to highly unified compliance architectures. This operational shift is driven by the urgent need to detect complex multi-instrument abuses, causing firms to embed advanced algorithmic execution correlation analysis directly into their trading infrastructure.
- By adopting a specialized behavioral pattern correlation engine, compliance teams correlate disparate text communications with active order books, which improves overall detection accuracy by 28% compared to isolated monitoring setups. Furthermore, the integration of structured multi venue execution tracking enables immediate front running alert generation, significantly tightening market integrity enforcement.
- Consequently, the reliance on predictive regulatory compliance modeling allows institutions to anticipate compliance shifts before they occur, systematically reducing post-incident remediation costs by 20% and establishing a proactive defense mechanism.
What challenges does the Trade Surveillance Systems Industry face during its growth?
- Escalating complexity in cross-border jurisdictional alignment and data sovereignty creates significant structural barriers to deploying unified oversight frameworks.
- The severe fragmentation of data privacy laws creates significant friction for the implementation of Trade Surveillance Systems, effectively restricting how multinational entities process sensitive trader information. Because compliance algorithms require massive volumes of historical data to function, strict localization mandates completely disrupt cross asset transaction monitoring capabilities.
- This structural bottleneck forces compliance teams to maintain redundant servers rather than utilizing a centralized unstructured data pipeline integration, which inadvertently increases IT infrastructure maintenance costs by 30%. Furthermore, achieving accurate multi channel communication compliance demands highly localized natural language processing ingestion models that respect regional privacy boundaries.
- Consequently, this persistent legal friction heavily delays critical legacy rule based engine replacement projects, slowing enterprise-wide operational efficiency gains by 18% and prolonging systemic risk vulnerabilities.
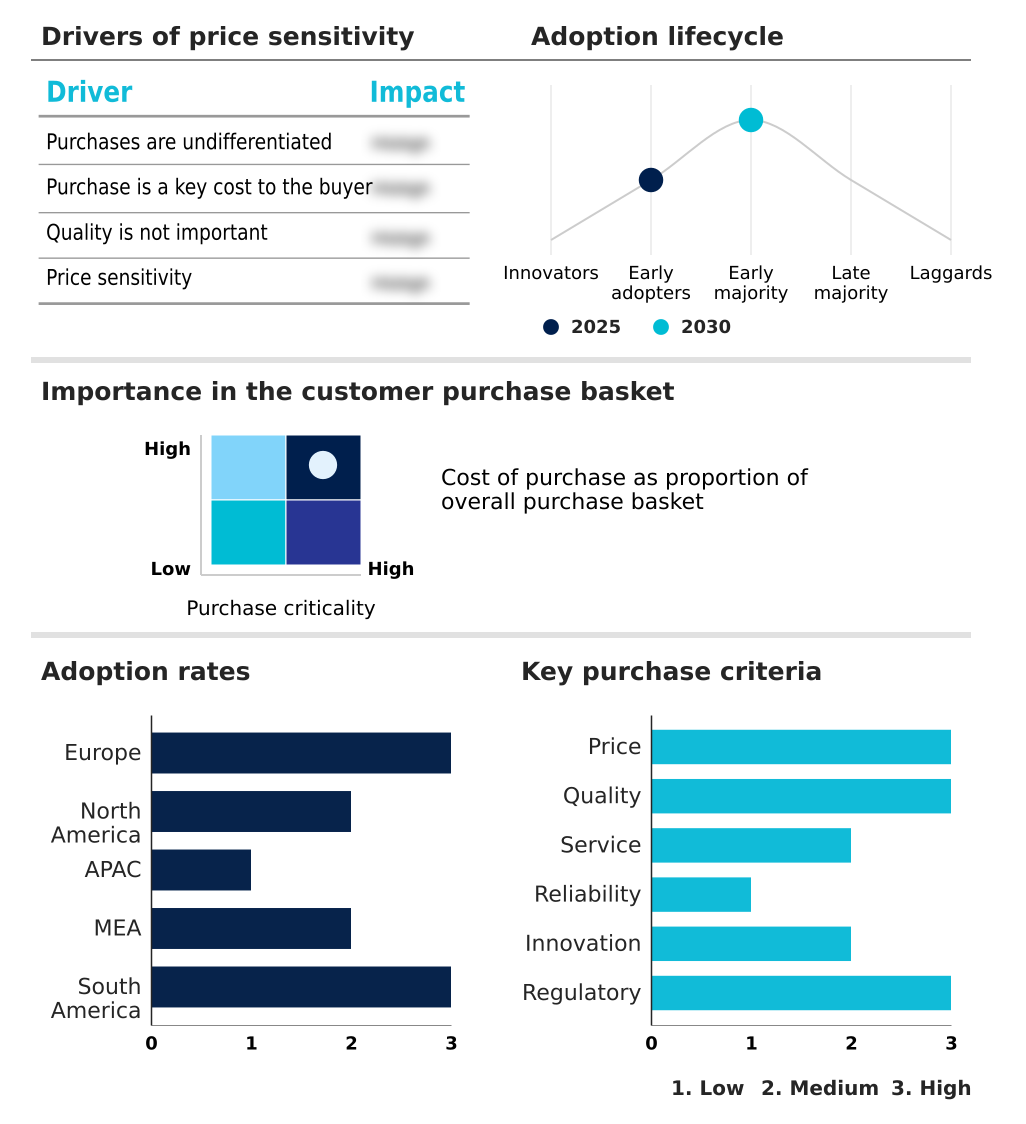
Exclusive Technavio Analysis on Customer Landscape
The trade surveillance systems market forecasting report includes the adoption lifecycle of the market, covering from the innovator’s stage to the laggard’s stage. It focuses on adoption rates in different regions based on penetration. Furthermore, the trade surveillance systems market report also includes key purchase criteria and drivers of price sensitivity to help companies evaluate and develop their market growth analysis strategies.
Customer Landscape of Trade Surveillance Systems Industry
Competitive Landscape
Companies are implementing various strategies, such as strategic alliances, trade surveillance systems market forecast, partnerships, mergers and acquisitions, geographical expansion, and product/service launches, to enhance their presence in the industry.
ACA Group - The research analyst observes a specialized portfolio featuring regulatory technology platforms, market abuse surveillance systems, and compliance monitoring solutions engineered for secondary market trading oversight and institutional risk mitigation.
The industry research and growth report includes detailed analyses of the competitive landscape of the market and information about key companies, including:
- ACA Group
- Aquis Exchange PLC
- b next holding AG
- BAE Systems Plc
- Bloomberg LP
- Broadridge Financial Solutions
- eFlow Global
- Eventus Systems Inc.
- Fidelity National Information
- IPC Systems Inc.
- KX Systems Inc.
- Nasdaq Inc.
- NICE Actimize Ltd.
- OneMarketData LLC
- Scila
- SIA SpA
- Software AG
- Solidus Labs Inc.
- SteelEye Ltd.
- Trapets AB
Qualitative and quantitative analysis of companies has been conducted to help clients understand the wider business environment as well as the strengths and weaknesses of key industry players. Data is qualitatively analyzed to categorize companies as pure play, category-focused, industry-focused, and diversified; it is quantitatively analyzed to categorize companies as dominant, leading, strong, tentative, and weak.
Recent Development and News in Trade surveillance systems market
- In the Application Software industry, the widespread adoption of natural language processing ingestion within complex derivative trade oversight platforms has standardized unstructured data analysis, directly impacting Trade Surveillance Systems demand by requiring rapid integration of multi lingual electronic mail monitoring protocols.
- The enforcement of data localization mandates across the European Union has forced a rapid legacy rule based engine replacement strategy among financial entities, accelerating the need for localized Trade Surveillance Systems equipped with a multi jurisdictional compliance framework and immutable digital audit trails.
- The transition toward decentralized ledger validation has necessitated advanced tokenized commodity oversight mechanisms, reshaping Trade Surveillance Systems supply dynamics by establishing a strict requirement for cryptographic secure audit trailing and real time order book analysis.
- The integration of unified communication interfaces in corporate architectures has expanded the scope of recorded voice log transcription capabilities, driving Trade Surveillance Systems utilization as institutions mandate holistic conduct risk management to correlate text and audio feeds.
Dive into Technavio’s robust research methodology, blending expert interviews, extensive data synthesis, and validated models for unparalleled Trade Surveillance Systems Market insights. See full methodology.
| Market Scope | |
|---|---|
| Page number | 299 |
| Base year | 2025 |
| Historic period | 2020-2024 |
| Forecast period | 2026-2030 |
| Growth momentum & CAGR | Accelerate at a CAGR of 30.5% |
| Market growth 2026-2030 | USD 3265.9 million |
| Market structure | Fragmented |
| YoY growth 2025-2026(%) | 25.8% |
| Key countries | UK, Germany, France, Switzerland, The Netherlands, Italy, US, Canada, Mexico, China, Japan, India, Singapore, Australia, South Korea, Saudi Arabia, South Africa, Israel, Qatar, Kuwait, Brazil, Argentina and Chile |
| Competitive landscape | Leading Companies, Market Positioning of Companies, Competitive Strategies, and Industry Risks |
Research Analyst Overview
- Trade Surveillance Systems function as a mandatory operational layer for modern financial institutions, fundamentally shifting how compliance teams govern fragmented execution environments. The aggressive expansion of electronic execution venue surveillance dictates enterprise product strategy, forcing risk committees to continuously upgrade detection capabilities against highly sophisticated market manipulation.
- By integrating advanced spoofing mitigation logic alongside a dynamic wash trading identification algorithm, trading firms can proactively neutralize fraudulent order patterns before executing a trade. This targeted technological shift directly impacts budget allocation, yielding a 35% decrease in regulatory fine exposure relative to institutions utilizing outdated legacy software.
- To achieve this, organizations rely on a centralized compliance visibility dashboard that synthesizes multi-asset datasets through ultra low latency processing frameworks. Precise real time execution timestamping empowers automated regulatory workflow configuration, ensuring that compliance architectures instantly adapt to shifting jurisdictional mandates.
- These systems fundamentally guarantee that institutional risk management transitions from a reactive regulatory necessity into a highly optimized, automated business function.
What are the Key Data Covered in this Trade Surveillance Systems Market Research and Growth Report?
-
What is the expected growth of the Trade Surveillance Systems Market between 2026 and 2030?
-
USD 3.27 billion, at a CAGR of 30.5%
-
-
What segmentation does the market report cover?
-
The report is segmented by Component (Solutions, and Services), Deployment (On-premises, and Cloud-based), Sector (Large enterprises, and SMEs), Application (Banks, Institutional brokers, and Retail brokers) and Geography (Europe, North America, APAC, Middle East and Africa, South America)
-
-
Which regions are analyzed in the report?
-
Europe, North America, APAC, Middle East and Africa and South America
-
-
What are the key growth drivers and market challenges?
-
Escalating regulatory rigor and non-compliance penalties globally, Escalating complexity in cross-border jurisdictional alignment and data sovereignty
-
-
Who are the major players in the Trade Surveillance Systems Market?
-
ACA Group, Aquis Exchange PLC, b next holding AG, BAE Systems Plc, Bloomberg LP, Broadridge Financial Solutions, eFlow Global, Eventus Systems Inc., Fidelity National Information, IPC Systems Inc., KX Systems Inc., Nasdaq Inc., NICE Actimize Ltd., OneMarketData LLC, Scila, SIA SpA, Software AG, Solidus Labs Inc., SteelEye Ltd. and Trapets AB
-
Market Research Insights
- Trade Surveillance Systems fundamentally alter how financial institutions monitor execution behaviors, transitioning operations away from static frameworks. The implementation of a dynamic transactional norm deviation model allows compliance teams to achieve a 40% reduction in manual alert reviews compared to legacy processes.
- By deploying hybrid configuration risk systems, multinational banks integrate disparate unstructured communications with the core market abuse detection engine, resulting in a 25% faster incident response rate. Furthermore, utilizing continuous automated algorithm calibration within cross border payment surveillance workflows ensures accurate anomaly detection across highly regulated jurisdictions.
- These technological shifts structurally elevate institutional risk management capabilities without degrading the underlying velocity of market transactions.
We can help! Our analysts can customize this trade surveillance systems market research report to meet your requirements.
 RIA -
RIA - 
