Operational Amplifier Market Analysis, Size, and Forecast 2025-2029: APAC (China, Japan, and South Korea), North America (US, Canada, and Mexico), Europe (Germany, UK, and France), South America (Brazil, Argentina, and Colombia), Middle East and Africa (South Africa, UAE, and Saudi Arabia), and Rest of World (ROW)

Operational Amplifier Market Analysis, Size, and Forecast 2025-2029:
APAC (China, Japan, and South Korea), North America (US, Canada, and Mexico), Europe (Germany, UK, and France), South America (Brazil, Argentina, and Colombia), Middle East and Africa (South Africa, UAE, and Saudi Arabia), and Rest of World (ROW)

Published: Dec 2025 325 Pages SKU: IRTNTR81010

Market Overview at a Glance

$1.45 B
Market Opportunity
4.6%
CAGR 2024 - 2029
39.1%
APAC Growth
$2.45 B
Automatic control system segment 2023

Operational Amplifier Market Size 2025-2029

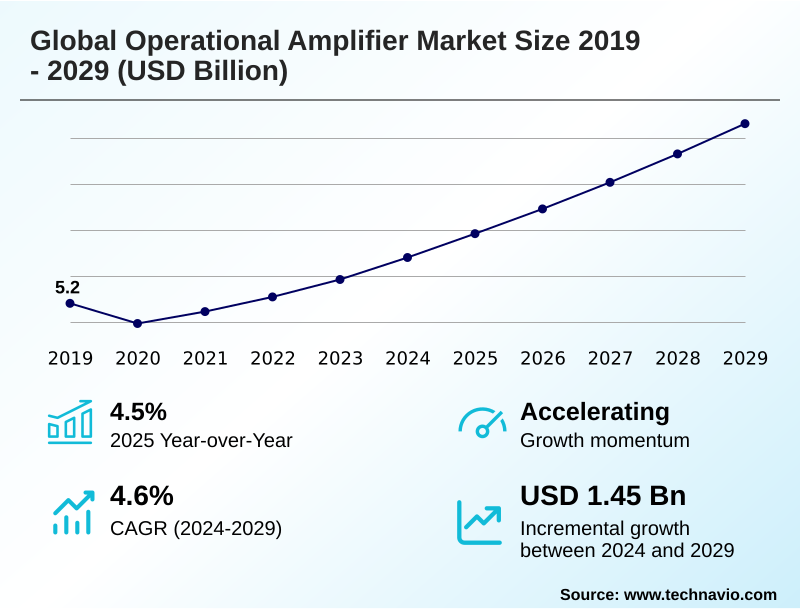
The operational amplifier market size is valued to increase by USD 1.45 billion, at a CAGR of 4.6% from 2024 to 2029. Proliferation of Internet of Things and connected devices will drive the operational amplifier market.

Major Market Trends & Insights

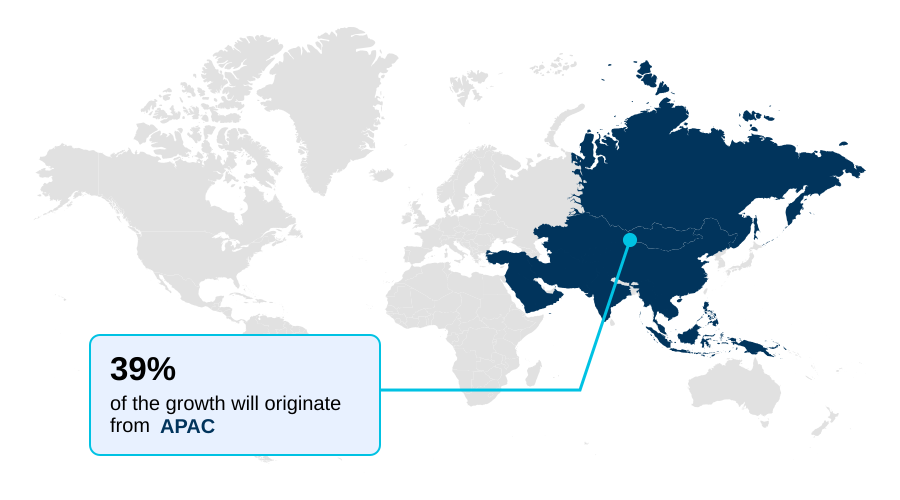
  • APAC dominated the market and accounted for a 39.1% growth during the forecast period.
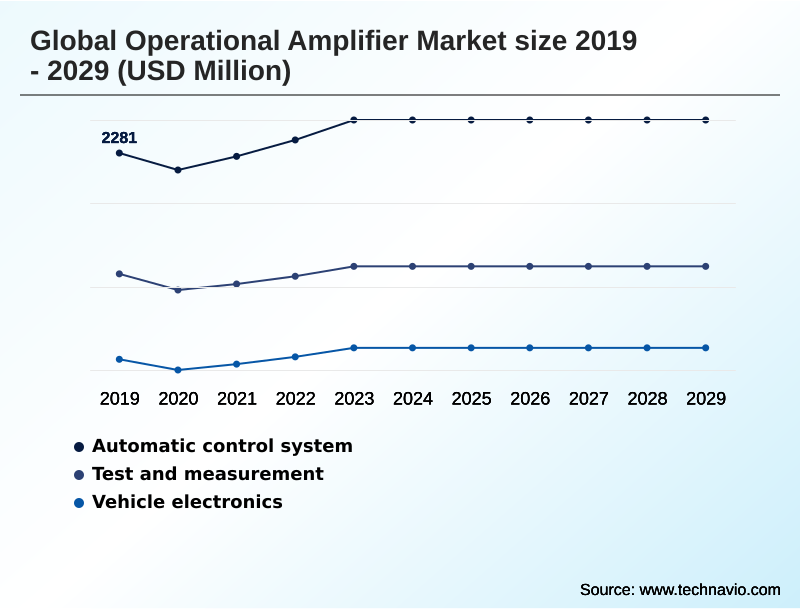
  • By Application - Automatic control system segment was valued at USD 2.45 billion in 2023
  • By Type - General-purpose segment accounted for the largest market revenue share in 2023

Market Size & Forecast

  • Market Opportunities: USD 1.95 billion
  • Market Future Opportunities: USD 1.45 billion
  • CAGR from 2024 to 2029 : 4.6%

Market Summary

  • The Operational Amplifier Market is foundational to modern electronics, serving as the critical interface between real-world analog signals and digital processing. Growth is fueled by the relentless expansion of industrial process control, the proliferation of advanced driver-assistance systems (ADAS) in the automotive sector, and the sheer volume of sensors deployed in IoT networks.
  • A key trend is the bifurcation of the market into high-volume, general-purpose components and highly specialized devices, such as the zero-drift amplifier, engineered for specific high-performance applications.
  • For instance, an OEM developing a portable medical device must navigate complex design trade-offs, balancing the need for low quiescent current to maximize battery life against the requirement for low voltage noise density to ensure the diagnostic accuracy of a high-impedance sensor interface. This scenario highlights the core tension in the market, where innovation in analog front-end design is critical.
  • However, the persistent threat of system-on-chip integration, which can cannibalize the market for discrete components, remains a significant strategic challenge for manufacturers who must continuously demonstrate value through superior performance in areas like high gain-bandwidth product and AEC-Q100 qualified component reliability.

What will be the Size of the Operational Amplifier Market during the forecast period?

Get Key Insights on Market Forecast (PDF) Request Free Sample

How is the Operational Amplifier Market Segmented?

The operational amplifier industry research report provides comprehensive data (region-wise segment analysis), with forecasts and estimates in "USD million" for the period 2025-2029, as well as historical data from 2019-2023 for the following segments.

  • Application
    • Automatic control system
    • Test and measurement
    • Vehicle electronics
  • Type
    • General-purpose
    • Precision
    • High-speed
    • Low-noise
    • Others
  • End-user
    • Consumer electronics
    • Automotive
    • Healthcare
    • Aerospace and defense
    • Others
  • Product type
    • Open-loop
    • Closed-loop
  • Geography
    • APAC
      • China
      • Japan
      • South Korea
    • North America
      • US
      • Canada
      • Mexico
    • Europe
      • Germany
      • UK
      • France
    • South America
      • Brazil
      • Argentina
      • Colombia
    • Middle East and Africa
      • South Africa
      • UAE
      • Saudi Arabia
    • Rest of World (ROW)

By Application Insights

The automatic control system segment is estimated to witness significant growth during the forecast period.

The automatic control system segment relies on components that ensure high-fidelity analog signal conditioning in demanding industrial environments.

These devices are fundamental to the industrial control loop within a programmable logic controller (PLC) and are crucial for robotics control system stability.

Designs incorporate active filter implementation to reduce noise and leverage a negative feedback network between the inverting input terminal and output.

Performance is defined by high common-mode rejection and low input bias current, critical for applications from industrial process control to automated test equipment (ATE).

For instance, advanced designs for strain gauge signal conditioning in a source measure unit (SMU) can achieve signal deviation reductions of up to 15%, enhancing process reliability through superior schmitt trigger circuit performance.

Request Free Sample

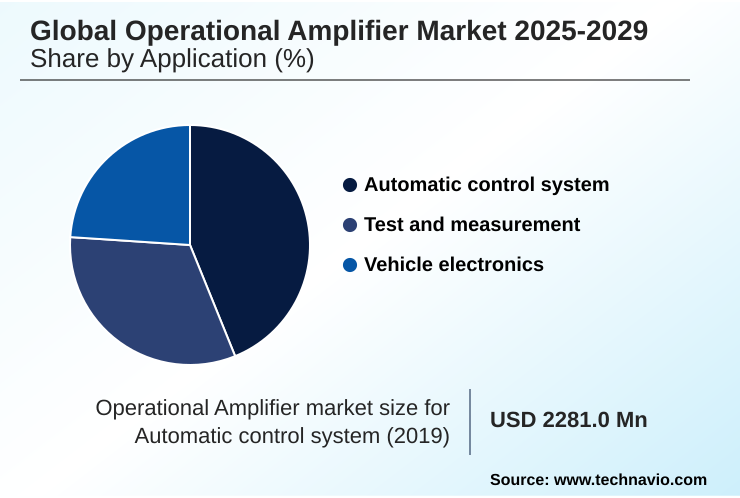
The Automatic control system segment was valued at USD 2.45 billion in 2023 and showed a gradual increase during the forecast period.

Request Free Sample

Regional Analysis

APAC is estimated to contribute 39.1% to the growth of the global market during the forecast period.Technavio’s analysts have elaborately explained the regional trends and drivers that shape the market during the forecast period.

See How Operational Amplifier Market Demand is Rising in APAC Request Free Sample

The market's geographic landscape reflects a split between volume and value. While APAC commands the largest share of incremental growth at 39.1% due to high-volume electronics manufacturing, the North American market is expanding nearly 25% faster, driven by high-value sectors.

These regions prioritize different performance metrics; for instance, North American demand in high-speed data acquisition (DAQ) and medical imaging front-end systems focuses on fast slew rate and short settling time.

In contrast, European industrial applications for grid monitoring infrastructure and solar inverter control demand minimal input offset voltage and superior differential voltage amplification.

This specialization is also seen in the components themselves, such as a voltage-to-current converter for industrial controls or a low current noise density amplifier for a spectrum analyzer front-end, with smart grid energy management applications pushing requirements for both precision and robustness.

Market Dynamics

Our researchers analyzed the data with 2024 as the base year, along with the key drivers, trends, and challenges. A holistic analysis of drivers will help companies refine their marketing strategies to gain a competitive advantage.

  • The market's expansion is driven by the diverse requirements of modern electronics, compelling a move toward application-specific solutions. For consumer products, a low noise op-amp for audio is essential for high-fidelity sound, whereas portable gadgets demand a micropower op-amp for battery devices to extend operational life.
  • In the industrial sector, the need for a high voltage op-amp for industrial applications is growing with the adoption of 48V systems, while a general purpose cost effective op-amp remains a staple for less critical functions.
  • The automotive industry is a key driver, requiring a robust automotive grade op-amp for ADAS and an AEC-Q100 qualified automotive op-amp for all safety-critical systems. Telecommunications progress depends on a high speed op-amp for 5G, with a high slew rate video amplifier serving related media applications.
  • Medical and scientific fields push performance boundaries, using a precision op-amp for medical devices and a chopper stabilized amplifier for instrumentation to ensure accuracy. The adoption of a fast settling data acquisition amplifier over a standard part can improve system throughput by over 15%, directly impacting operational efficiency.
  • Specialized needs are met by a zero drift amplifier for sensors, a radiation hardened op-amp for space, and a rail-to-rail op-amp for single supply systems.
  • Further niche applications use a low bias current FET input op-amp, a wide bandwidth differential amplifier, a high common mode rejection amplifier, a low distortion audio op-amp, and a programmable gain instrumentation amplifier to meet precise functional goals.

What are the key market drivers leading to the rise in the adoption of Operational Amplifier Industry?

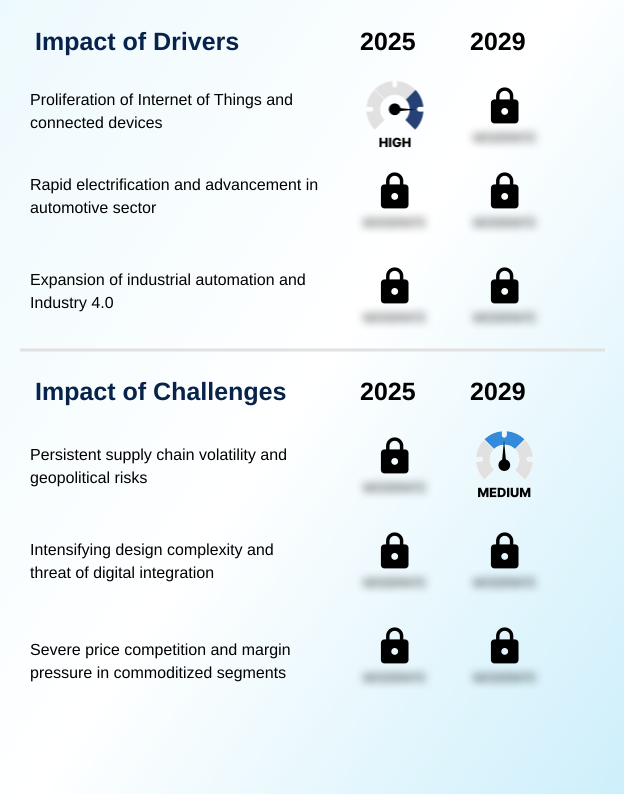
  • A primary driver for the operational amplifier market is the exponential proliferation of Internet of Things (IoT) devices, which require analog components for sensor signal conditioning.

  • The market's momentum is strongly linked to the electrification of the automotive sector and the expansion of smart factory automation.
  • The need for an AEC-Q100 qualified component is now standard in any electric vehicle powertrain, where precision current sensing is critical for efficiency.
  • The use of a zero-drift amplifier in battery management system (BMS) applications improves state-of-charge accuracy by up to 5%, directly enhancing vehicle range.
  • In industrial settings, advanced analog front-end design is integral to LiDAR sensor signal processing and the overall success of advanced driver-assistance systems (ADAS).
  • This industrial push, coupled with the build-out of 5G telecommunications infrastructure, drives demand for components with a high gain-bandwidth product, which defines their ability to process high-frequency signals from the non-inverting input terminal and inverting input terminal with minimal distortion.

What are the market trends shaping the Operational Amplifier Industry?

  • A dominant trend shaping the operational amplifier market is the persistent drive toward component miniaturization. This is coupled with an intense focus on enhancing power efficiency to meet the demands of battery-powered and portable devices.

  • A dominant trend is the bifurcation toward specialized components, driven by miniaturization and power efficiency. The adoption of advanced WLCSP packaging and DFN package format technologies has reduced component footprints by up to 40%, enabling denser designs for devices like a wearable health monitor.
  • Concurrently, the push for energy efficiency has yielded devices with a low quiescent current, with some components consuming 60% less power than standard parts. This is critical for any single-supply system operation, where maximizing battery life is paramount.
  • Innovations like the chopper-stabilized amplifier and designs with a low 1/f noise corner cater to the high-impedance sensor interface market, including professional audio preamplifier and photodiode amplifier circuit designs. This trend toward rail-to-rail input output capability is now standard in portable diagnostic tool and ultrasound imaging system applications.

What challenges does the Operational Amplifier Industry face during its growth?

  • Persistent supply chain volatility, compounded by geopolitical risks, presents a formidable challenge to the stability and growth of the operational amplifier market.

  • Persistent supply chain vulnerabilities and the inexorable trend toward digital integration present significant hurdles. Component lead times have surged by over 200% for certain device families, disrupting production schedules for systems requiring a radiation-hardened component for avionics flight control or a specialized part for an electronic warfare platform.
  • Concurrently, the advancement of system-on-chip integration, which can reduce bill-of-materials costs by 15% in high-volume applications like in-vehicle infotainment systems, threatens the market for discrete components.
  • While a mixed-signal integrated circuit cannot replicate the performance of a specialized programmable gain amplifier or a component in hermetic packaging for a satellite telemetry system, it does erode the market for standard parts, including those in a simple voltage follower configuration.
  • This pressures manufacturers to innovate in areas like low voltage noise density for a digital multimeter (DMM) front-end and arbitrary waveform generator applications.

Exclusive Technavio Analysis on Customer Landscape

The operational amplifier market forecasting report includes the adoption lifecycle of the market, covering from the innovator’s stage to the laggard’s stage. It focuses on adoption rates in different regions based on penetration. Furthermore, the operational amplifier market report also includes key purchase criteria and drivers of price sensitivity to help companies evaluate and develop their market growth analysis strategies.

Customer Landscape of Operational Amplifier Industry

Competitive Landscape

Companies are implementing various strategies, such as strategic alliances, operational amplifier market forecast, partnerships, mergers and acquisitions, geographical expansion, and product/service launches, to enhance their presence in the industry.

ABLIC Inc. - Specializes in zero-drift, rail-to-rail input/output operational amplifiers, engineered for low-power applications demanding high precision and stability.

The industry research and growth report includes detailed analyses of the competitive landscape of the market and information about key companies, including:

  • ABLIC Inc.
  • Advanced Linear Devices Inc.
  • Analog Devices Inc.
  • Apex Microtechnology
  • Cirrus Logic Inc.
  • Diodes Inc.
  • Infineon Technologies AG
  • KEC Holdings
  • Microchip Technology Inc.
  • Monolithic Power Systems Inc.
  • Nisshinbo Holdings Inc.
  • ON Semiconductor Corp.
  • Renesas Electronics Corp.
  • Richtek Technology Corp.
  • ROHM Co. Ltd.
  • STMicroelectronics NV
  • Texas Instruments Inc.
  • Toshiba Electronic Devices and Storage Corp.
  • UTC

Qualitative and quantitative analysis of companies has been conducted to help clients understand the wider business environment as well as the strengths and weaknesses of key industry players. Data is qualitatively analyzed to categorize companies as pure play, category-focused, industry-focused, and diversified; it is quantitatively analyzed to categorize companies as dominant, leading, strong, tentative, and weak.

Recent Development and News in Operational amplifier market

  • In September 2024, STMicroelectronics announced its new line of high-voltage operational amplifiers, capable of operating on 48V rails for industrial automation and mild-hybrid vehicle systems, enhancing its portfolio for robust applications.
  • In November 2024, Texas Instruments Inc. launched its OPAx99-Q1 family of automotive-grade operational amplifiers, featuring high-speed performance and AEC-Q100 qualification for advanced driver-assistance systems (ADAS) sensor signal conditioning.
  • In February 2025, Analog Devices Inc. unveiled a new series of micropower operational amplifiers with rail-to-rail input/output, specifically designed to extend battery life in wearable health monitors and IoT endpoint devices.
  • In May 2025, Renesas Electronics highlighted the ISL28134, a chopper-stabilized, zero-drift operational amplifier designed for ultra-low noise and offset voltage, targeting biopotential signal amplification in medical applications.

Dive into Technavio’s robust research methodology, blending expert interviews, extensive data synthesis, and validated models for unparalleled Operational Amplifier Market insights. See full methodology.

Market Scope
Page number 325
Base year 2024
Historic period 2019-2023
Forecast period 2025-2029
Growth momentum & CAGR Accelerate at a CAGR of 4.6%
Market growth 2025-2029 USD 1450.2 million
Market structure Fragmented
YoY growth 2024-2025(%) 4.5%
Key countries China, Japan, South Korea, India, Australia, Indonesia, US, Canada, Mexico, Germany, UK, France, Italy, Spain, The Netherlands, Brazil, Argentina, Colombia, South Africa, UAE, Saudi Arabia, Israel and Turkey
Competitive landscape Leading Companies, Market Positioning of Companies, Competitive Strategies, and Industry Risks

Request Free Sample

Research Analyst Overview

  • The operational amplifier market is a complex ecosystem defined by a push for higher performance across multiple vectors. Strategic boardroom decisions on R&D investment are directly influenced by this specialization, weighing the development of a high gain-bandwidth product for communications against a precision current sensing device for automotive.
  • Core technologies like the chopper-stabilized amplifier and zero-drift amplifier are crucial for achieving the ultra-low input offset voltage required in scientific instruments. The market's foundational technology, differential voltage amplification, is executed through an inverting input terminal and non-inverting input terminal, controlled via a negative feedback network.
  • For battery-powered systems, achieving a low quiescent current is a primary design goal, while high-speed applications prioritize a fast slew rate and short settling time. Implementing advanced analog front-end design with components offering high common-mode rejection has improved signal fidelity by over 30% in critical systems.
  • Further diversification is seen in a programmable gain amplifier, radiation-hardened component, and devices with a low 1/f noise corner, showcasing the industry's granular focus on application-specific performance and reliability.

What are the Key Data Covered in this Operational Amplifier Market Research and Growth Report?

  • What is the expected growth of the Operational Amplifier Market between 2025 and 2029?

    • USD 1.45 billion, at a CAGR of 4.6%

  • What segmentation does the market report cover?

    • The report is segmented by Application (Automatic control system, Test and measurement, Vehicle electronics), Type (General-purpose, Precision, High-speed, Low-noise, Others), End-user (Consumer electronics, Automotive, Healthcare, Aerospace and defense, Others), Product Type (Open-loop, Closed-loop) and Geography (APAC, North America, Europe, South America, Middle East and Africa)

  • Which regions are analyzed in the report?

    • APAC, North America, Europe, South America and Middle East and Africa

  • What are the key growth drivers and market challenges?

    • Proliferation of Internet of Things and connected devices , Persistent supply chain volatility and geopolitical risks

  • Who are the major players in the Operational Amplifier Market?

    • ABLIC Inc., Advanced Linear Devices Inc., Analog Devices Inc., Apex Microtechnology, Cirrus Logic Inc., Diodes Inc., Infineon Technologies AG, KEC Holdings, Microchip Technology Inc., Monolithic Power Systems Inc., Nisshinbo Holdings Inc., ON Semiconductor Corp., Renesas Electronics Corp., Richtek Technology Corp., ROHM Co. Ltd., STMicroelectronics NV, Texas Instruments Inc., Toshiba Electronic Devices and Storage Corp. and UTC

Market Research Insights

  • Market dynamics are increasingly shaped by the demand for specialized analog components in high-value sectors. The adoption of high-performance amplifiers in smart factory automation has improved process stability by over 15%, while their integration into medical imaging front-end designs has reduced diagnostic signal acquisition time by 20% compared to previous-generation systems.
  • The expansion of 5G telecommunications infrastructure relies on amplifiers capable of handling high-frequency signals. Concurrently, the growth in battery-powered devices, from a wearable health monitor to an electric vehicle powertrain, intensifies the need for power-efficient components.
  • This is especially critical in battery management system (BMS) applications, where efficiency gains of just a few percentage points translate directly to extended operational life and reliability, underscoring the strategic importance of advanced analog design in modern electronic systems.

We can help! Our analysts can customize this operational amplifier market research report to meet your requirements.

Get in touch

1. Executive Summary

1.1 Market overview

Executive Summary - Chart on Market Overview
Executive Summary - Data Table on Market Overview
Executive Summary - Chart on Global Market Characteristics
Executive Summary - Chart on Market by Geography
Executive Summary - Chart on Market Segmentation by Application
Executive Summary - Chart on Market Segmentation by Type
Executive Summary - Chart on Market Segmentation by End-user
Executive Summary - Chart on Market Segmentation by Product Type
Executive Summary - Chart on Incremental Growth
Executive Summary - Data Table on Incremental Growth
Executive Summary - Chart on Company Market Positioning

2. Technavio Analysis

2.1 Analysis of price sensitivity, lifecycle, customer purchase basket, adoption rates, and purchase criteria

2.2 Criticality of inputs and Factors of differentiation

Chart on Overview on criticality of inputs and factors of differentiation

2.3 Factors of disruption

Chart on Overview on factors of disruption

2.4 Impact of drivers and challenges

Chart on Impact of drivers and challenges in 2024 and 2029

3. Market Landscape

3.1 Market ecosystem

Chart on Parent Market
Data Table on - Parent Market

3.2 Market characteristics

Chart on Market characteristics analysis

3.3 Value chain analysis

Chart on Value chain analysis

4. Market Sizing

4.1 Market definition

Data Table on Offerings of companies included in the market definition

4.2 Market segment analysis

Market segments

4.3 Market size 2024

4.4 Market outlook: Forecast for 2024-2029

Chart on Global - Market size and forecast 2024-2029 ($ million)
Data Table on Global - Market size and forecast 2024-2029 ($ million)
Chart on Global Market: Year-over-year growth 2024-2029 (%)
Data Table on Global Market: Year-over-year growth 2024-2029 (%)

5. Historic Market Size

5.1 Global Operational Amplifier Market 2019 - 2023

Historic Market Size - Data Table on Global Operational Amplifier Market 2019 - 2023 ($ million)

5.2 Application segment analysis 2019 - 2023

Historic Market Size - Application Segment 2019 - 2023 ($ million)

5.3 Type segment analysis 2019 - 2023

Historic Market Size - Type Segment 2019 - 2023 ($ million)

5.4 End-user segment analysis 2019 - 2023

Historic Market Size - End-user Segment 2019 - 2023 ($ million)

5.5 Product Type segment analysis 2019 - 2023

Historic Market Size - Product Type Segment 2019 - 2023 ($ million)

5.6 Geography segment analysis 2019 - 2023

Historic Market Size - Geography Segment 2019 - 2023 ($ million)

5.7 Country segment analysis 2019 - 2023

Historic Market Size - Country Segment 2019 - 2023 ($ million)

6. Qualitative Analysis

6.1 Impact of AI in global operational amplifier market

7. Five Forces Analysis

7.1 Five forces summary

Five forces analysis - Comparison between 2024 and 2029

7.2 Bargaining power of buyers

Bargaining power of buyers - Impact of key factors 2024 and 2029

7.3 Bargaining power of suppliers

Bargaining power of suppliers - Impact of key factors in 2024 and 2029

7.4 Threat of new entrants

Threat of new entrants - Impact of key factors in 2024 and 2029

7.5 Threat of substitutes

Threat of substitutes - Impact of key factors in 2024 and 2029

7.6 Threat of rivalry

Threat of rivalry - Impact of key factors in 2024 and 2029

7.7 Market condition

Chart on Market condition - Five forces 2024 and 2029

8. Market Segmentation by Application

8.1 Market segments

Chart on Application - Market share 2024-2029 (%)
Data Table on Application - Market share 2024-2029 (%)

8.2 Comparison by Application

Chart on Comparison by Application
Data Table on Comparison by Application

8.3 Automatic control system - Market size and forecast 2024-2029

Chart on Automatic control system - Market size and forecast 2024-2029 ($ million)
Data Table on Automatic control system - Market size and forecast 2024-2029 ($ million)
Chart on Automatic control system - Year-over-year growth 2024-2029 (%)
Data Table on Automatic control system - Year-over-year growth 2024-2029 (%)

8.4 Test and measurement - Market size and forecast 2024-2029

Chart on Test and measurement - Market size and forecast 2024-2029 ($ million)
Data Table on Test and measurement - Market size and forecast 2024-2029 ($ million)
Chart on Test and measurement - Year-over-year growth 2024-2029 (%)
Data Table on Test and measurement - Year-over-year growth 2024-2029 (%)

8.5 Vehicle electronics - Market size and forecast 2024-2029

Chart on Vehicle electronics - Market size and forecast 2024-2029 ($ million)
Data Table on Vehicle electronics - Market size and forecast 2024-2029 ($ million)
Chart on Vehicle electronics - Year-over-year growth 2024-2029 (%)
Data Table on Vehicle electronics - Year-over-year growth 2024-2029 (%)

8.6 Market opportunity by Application

Market opportunity by Application ($ million)
Data Table on Market opportunity by Application ($ million)

9. Market Segmentation by Type

9.1 Market segments

Chart on Type - Market share 2024-2029 (%)
Data Table on Type - Market share 2024-2029 (%)

9.2 Comparison by Type

Chart on Comparison by Type
Data Table on Comparison by Type

9.3 General-purpose - Market size and forecast 2024-2029

Chart on General-purpose - Market size and forecast 2024-2029 ($ million)
Data Table on General-purpose - Market size and forecast 2024-2029 ($ million)
Chart on General-purpose - Year-over-year growth 2024-2029 (%)
Data Table on General-purpose - Year-over-year growth 2024-2029 (%)

9.4 Precision - Market size and forecast 2024-2029

Chart on Precision - Market size and forecast 2024-2029 ($ million)
Data Table on Precision - Market size and forecast 2024-2029 ($ million)
Chart on Precision - Year-over-year growth 2024-2029 (%)
Data Table on Precision - Year-over-year growth 2024-2029 (%)

9.5 High-speed - Market size and forecast 2024-2029

Chart on High-speed - Market size and forecast 2024-2029 ($ million)
Data Table on High-speed - Market size and forecast 2024-2029 ($ million)
Chart on High-speed - Year-over-year growth 2024-2029 (%)
Data Table on High-speed - Year-over-year growth 2024-2029 (%)

9.6 Low-noise - Market size and forecast 2024-2029

Chart on Low-noise - Market size and forecast 2024-2029 ($ million)
Data Table on Low-noise - Market size and forecast 2024-2029 ($ million)
Chart on Low-noise - Year-over-year growth 2024-2029 (%)
Data Table on Low-noise - Year-over-year growth 2024-2029 (%)

9.7 Others - Market size and forecast 2024-2029

Chart on Others - Market size and forecast 2024-2029 ($ million)
Data Table on Others - Market size and forecast 2024-2029 ($ million)
Chart on Others - Year-over-year growth 2024-2029 (%)
Data Table on Others - Year-over-year growth 2024-2029 (%)

9.8 Market opportunity by Type

Market opportunity by Type ($ million)
Data Table on Market opportunity by Type ($ million)

10. Market Segmentation by End-user

10.1 Market segments

Chart on End-user - Market share 2024-2029 (%)
Data Table on End-user - Market share 2024-2029 (%)

10.2 Comparison by End-user

Chart on Comparison by End-user
Data Table on Comparison by End-user

10.3 Consumer electronics - Market size and forecast 2024-2029

Chart on Consumer electronics - Market size and forecast 2024-2029 ($ million)
Data Table on Consumer electronics - Market size and forecast 2024-2029 ($ million)
Chart on Consumer electronics - Year-over-year growth 2024-2029 (%)
Data Table on Consumer electronics - Year-over-year growth 2024-2029 (%)

10.4 Automotive - Market size and forecast 2024-2029

Chart on Automotive - Market size and forecast 2024-2029 ($ million)
Data Table on Automotive - Market size and forecast 2024-2029 ($ million)
Chart on Automotive - Year-over-year growth 2024-2029 (%)
Data Table on Automotive - Year-over-year growth 2024-2029 (%)

10.5 Healthcare - Market size and forecast 2024-2029

Chart on Healthcare - Market size and forecast 2024-2029 ($ million)
Data Table on Healthcare - Market size and forecast 2024-2029 ($ million)
Chart on Healthcare - Year-over-year growth 2024-2029 (%)
Data Table on Healthcare - Year-over-year growth 2024-2029 (%)

10.6 Aerospace and defense - Market size and forecast 2024-2029

Chart on Aerospace and defense - Market size and forecast 2024-2029 ($ million)
Data Table on Aerospace and defense - Market size and forecast 2024-2029 ($ million)
Chart on Aerospace and defense - Year-over-year growth 2024-2029 (%)
Data Table on Aerospace and defense - Year-over-year growth 2024-2029 (%)

10.7 Others - Market size and forecast 2024-2029

Chart on Others - Market size and forecast 2024-2029 ($ million)
Data Table on Others - Market size and forecast 2024-2029 ($ million)
Chart on Others - Year-over-year growth 2024-2029 (%)
Data Table on Others - Year-over-year growth 2024-2029 (%)

10.8 Market opportunity by End-user

Market opportunity by End-user ($ million)
Data Table on Market opportunity by End-user ($ million)

11. Market Segmentation by Product Type

11.1 Market segments

Chart on Product Type - Market share 2024-2029 (%)
Data Table on Product Type - Market share 2024-2029 (%)

11.2 Comparison by Product Type

Chart on Comparison by Product Type
Data Table on Comparison by Product Type

11.3 Open-loop - Market size and forecast 2024-2029

Chart on Open-loop - Market size and forecast 2024-2029 ($ million)
Data Table on Open-loop - Market size and forecast 2024-2029 ($ million)
Chart on Open-loop - Year-over-year growth 2024-2029 (%)
Data Table on Open-loop - Year-over-year growth 2024-2029 (%)

11.4 Closed-loop - Market size and forecast 2024-2029

Chart on Closed-loop - Market size and forecast 2024-2029 ($ million)
Data Table on Closed-loop - Market size and forecast 2024-2029 ($ million)
Chart on Closed-loop - Year-over-year growth 2024-2029 (%)
Data Table on Closed-loop - Year-over-year growth 2024-2029 (%)

11.5 Market opportunity by Product Type

Market opportunity by Product Type ($ million)
Data Table on Market opportunity by Product Type ($ million)

12. Customer Landscape

12.1 Customer landscape overview

Analysis of price sensitivity, lifecycle, customer purchase basket, adoption rates, and purchase criteria

13. Geographic Landscape

13.1 Geographic segmentation

Chart on Market share by geography 2024-2029 (%)
Data Table on Market share by geography 2024-2029 (%)

13.2 Geographic comparison

Chart on Geographic comparison
Data Table on Geographic comparison

13.3 APAC - Market size and forecast 2024-2029

Chart on APAC - Market size and forecast 2024-2029 ($ million)
Data Table on APAC - Market size and forecast 2024-2029 ($ million)
Chart on APAC - Year-over-year growth 2024-2029 (%)
Data Table on APAC - Year-over-year growth 2024-2029 (%)
Chart on Regional Comparison - APAC
Data Table on Regional Comparison - APAC

13.3.1 China - Market size and forecast 2024-2029

Chart on China - Market size and forecast 2024-2029 ($ million)
Data Table on China - Market size and forecast 2024-2029 ($ million)
Chart on China - Year-over-year growth 2024-2029 (%)
Data Table on China - Year-over-year growth 2024-2029 (%)

13.3.2 Japan - Market size and forecast 2024-2029

Chart on Japan - Market size and forecast 2024-2029 ($ million)
Data Table on Japan - Market size and forecast 2024-2029 ($ million)
Chart on Japan - Year-over-year growth 2024-2029 (%)
Data Table on Japan - Year-over-year growth 2024-2029 (%)

13.3.3 South Korea - Market size and forecast 2024-2029

Chart on South Korea - Market size and forecast 2024-2029 ($ million)
Data Table on South Korea - Market size and forecast 2024-2029 ($ million)
Chart on South Korea - Year-over-year growth 2024-2029 (%)
Data Table on South Korea - Year-over-year growth 2024-2029 (%)

13.3.4 India - Market size and forecast 2024-2029

Chart on India - Market size and forecast 2024-2029 ($ million)
Data Table on India - Market size and forecast 2024-2029 ($ million)
Chart on India - Year-over-year growth 2024-2029 (%)
Data Table on India - Year-over-year growth 2024-2029 (%)

13.3.5 Australia - Market size and forecast 2024-2029

Chart on Australia - Market size and forecast 2024-2029 ($ million)
Data Table on Australia - Market size and forecast 2024-2029 ($ million)
Chart on Australia - Year-over-year growth 2024-2029 (%)
Data Table on Australia - Year-over-year growth 2024-2029 (%)

13.3.6 Indonesia - Market size and forecast 2024-2029

Chart on Indonesia - Market size and forecast 2024-2029 ($ million)
Data Table on Indonesia - Market size and forecast 2024-2029 ($ million)
Chart on Indonesia - Year-over-year growth 2024-2029 (%)
Data Table on Indonesia - Year-over-year growth 2024-2029 (%)

13.4 North America - Market size and forecast 2024-2029

Chart on North America - Market size and forecast 2024-2029 ($ million)
Data Table on North America - Market size and forecast 2024-2029 ($ million)
Chart on North America - Year-over-year growth 2024-2029 (%)
Data Table on North America - Year-over-year growth 2024-2029 (%)
Chart on Regional Comparison - North America
Data Table on Regional Comparison - North America

13.4.1 US - Market size and forecast 2024-2029

Chart on US - Market size and forecast 2024-2029 ($ million)
Data Table on US - Market size and forecast 2024-2029 ($ million)
Chart on US - Year-over-year growth 2024-2029 (%)
Data Table on US - Year-over-year growth 2024-2029 (%)

13.4.2 Canada - Market size and forecast 2024-2029

Chart on Canada - Market size and forecast 2024-2029 ($ million)
Data Table on Canada - Market size and forecast 2024-2029 ($ million)
Chart on Canada - Year-over-year growth 2024-2029 (%)
Data Table on Canada - Year-over-year growth 2024-2029 (%)

13.4.3 Mexico - Market size and forecast 2024-2029

Chart on Mexico - Market size and forecast 2024-2029 ($ million)
Data Table on Mexico - Market size and forecast 2024-2029 ($ million)
Chart on Mexico - Year-over-year growth 2024-2029 (%)
Data Table on Mexico - Year-over-year growth 2024-2029 (%)

13.5 Europe - Market size and forecast 2024-2029

Chart on Europe - Market size and forecast 2024-2029 ($ million)
Data Table on Europe - Market size and forecast 2024-2029 ($ million)
Chart on Europe - Year-over-year growth 2024-2029 (%)
Data Table on Europe - Year-over-year growth 2024-2029 (%)
Chart on Regional Comparison - Europe
Data Table on Regional Comparison - Europe

13.5.1 Germany - Market size and forecast 2024-2029

Chart on Germany - Market size and forecast 2024-2029 ($ million)
Data Table on Germany - Market size and forecast 2024-2029 ($ million)
Chart on Germany - Year-over-year growth 2024-2029 (%)
Data Table on Germany - Year-over-year growth 2024-2029 (%)

13.5.2 UK - Market size and forecast 2024-2029

Chart on UK - Market size and forecast 2024-2029 ($ million)
Data Table on UK - Market size and forecast 2024-2029 ($ million)
Chart on UK - Year-over-year growth 2024-2029 (%)
Data Table on UK - Year-over-year growth 2024-2029 (%)

13.5.3 France - Market size and forecast 2024-2029

Chart on France - Market size and forecast 2024-2029 ($ million)
Data Table on France - Market size and forecast 2024-2029 ($ million)
Chart on France - Year-over-year growth 2024-2029 (%)
Data Table on France - Year-over-year growth 2024-2029 (%)

13.5.4 Italy - Market size and forecast 2024-2029

Chart on Italy - Market size and forecast 2024-2029 ($ million)
Data Table on Italy - Market size and forecast 2024-2029 ($ million)
Chart on Italy - Year-over-year growth 2024-2029 (%)
Data Table on Italy - Year-over-year growth 2024-2029 (%)

13.5.5 Spain - Market size and forecast 2024-2029

Chart on Spain - Market size and forecast 2024-2029 ($ million)
Data Table on Spain - Market size and forecast 2024-2029 ($ million)
Chart on Spain - Year-over-year growth 2024-2029 (%)
Data Table on Spain - Year-over-year growth 2024-2029 (%)

13.5.6 The Netherlands - Market size and forecast 2024-2029

Chart on The Netherlands - Market size and forecast 2024-2029 ($ million)
Data Table on The Netherlands - Market size and forecast 2024-2029 ($ million)
Chart on The Netherlands - Year-over-year growth 2024-2029 (%)
Data Table on The Netherlands - Year-over-year growth 2024-2029 (%)

13.6 South America - Market size and forecast 2024-2029

Chart on South America - Market size and forecast 2024-2029 ($ million)
Data Table on South America - Market size and forecast 2024-2029 ($ million)
Chart on South America - Year-over-year growth 2024-2029 (%)
Data Table on South America - Year-over-year growth 2024-2029 (%)
Chart on Regional Comparison - South America
Data Table on Regional Comparison - South America

13.6.1 Brazil - Market size and forecast 2024-2029

Chart on Brazil - Market size and forecast 2024-2029 ($ million)
Data Table on Brazil - Market size and forecast 2024-2029 ($ million)
Chart on Brazil - Year-over-year growth 2024-2029 (%)
Data Table on Brazil - Year-over-year growth 2024-2029 (%)

13.6.2 Argentina - Market size and forecast 2024-2029

Chart on Argentina - Market size and forecast 2024-2029 ($ million)
Data Table on Argentina - Market size and forecast 2024-2029 ($ million)
Chart on Argentina - Year-over-year growth 2024-2029 (%)
Data Table on Argentina - Year-over-year growth 2024-2029 (%)

13.6.3 Colombia - Market size and forecast 2024-2029

Chart on Colombia - Market size and forecast 2024-2029 ($ million)
Data Table on Colombia - Market size and forecast 2024-2029 ($ million)
Chart on Colombia - Year-over-year growth 2024-2029 (%)
Data Table on Colombia - Year-over-year growth 2024-2029 (%)

13.7 Middle East and Africa - Market size and forecast 2024-2029

Chart on Middle East and Africa - Market size and forecast 2024-2029 ($ million)
Data Table on Middle East and Africa - Market size and forecast 2024-2029 ($ million)
Chart on Middle East and Africa - Year-over-year growth 2024-2029 (%)
Data Table on Middle East and Africa - Year-over-year growth 2024-2029 (%)
Chart on Regional Comparison - Middle East and Africa
Data Table on Regional Comparison - Middle East and Africa

13.7.1 South Africa - Market size and forecast 2024-2029

Chart on South Africa - Market size and forecast 2024-2029 ($ million)
Data Table on South Africa - Market size and forecast 2024-2029 ($ million)
Chart on South Africa - Year-over-year growth 2024-2029 (%)
Data Table on South Africa - Year-over-year growth 2024-2029 (%)

13.7.2 UAE - Market size and forecast 2024-2029

Chart on UAE - Market size and forecast 2024-2029 ($ million)
Data Table on UAE - Market size and forecast 2024-2029 ($ million)
Chart on UAE - Year-over-year growth 2024-2029 (%)
Data Table on UAE - Year-over-year growth 2024-2029 (%)

13.7.3 Saudi Arabia - Market size and forecast 2024-2029

Chart on Saudi Arabia - Market size and forecast 2024-2029 ($ million)
Data Table on Saudi Arabia - Market size and forecast 2024-2029 ($ million)
Chart on Saudi Arabia - Year-over-year growth 2024-2029 (%)
Data Table on Saudi Arabia - Year-over-year growth 2024-2029 (%)

13.7.4 Israel - Market size and forecast 2024-2029

Chart on Israel - Market size and forecast 2024-2029 ($ million)
Data Table on Israel - Market size and forecast 2024-2029 ($ million)
Chart on Israel - Year-over-year growth 2024-2029 (%)
Data Table on Israel - Year-over-year growth 2024-2029 (%)

13.7.5 Turkey - Market size and forecast 2024-2029

Chart on Turkey - Market size and forecast 2024-2029 ($ million)
Data Table on Turkey - Market size and forecast 2024-2029 ($ million)
Chart on Turkey - Year-over-year growth 2024-2029 (%)
Data Table on Turkey - Year-over-year growth 2024-2029 (%)

13.8 Market opportunity by geography

Market opportunity by geography ($ million)
Data Tables on Market opportunity by geography ($ million)

14. Drivers, Challenges, and Opportunity

14.1 Market drivers

Proliferation of Internet of Things and connected devices
Rapid electrification and advancement in automotive sector
Expansion of industrial automation and Industry 4.0

14.2 Market challenges

Persistent supply chain volatility and geopolitical risks
Intensifying design complexity and threat of digital integration
Severe price competition and margin pressure in commoditized segments

14.3 Impact of drivers and challenges

Impact of drivers and challenges in 2024 and 2029

14.4 Market opportunities

Drive toward miniaturization and lower power consumption
Increasing specialization for high-performance applications
Growing demand for high-voltage and robust components

15. Competitive Landscape

15.1 Overview

15.2

Overview on criticality of inputs and factors of differentiation

15.3 Landscape disruption

Overview on factors of disruption

15.4 Industry risks

Impact of key risks on business

16. Competitive Analysis

16.1 Companies profiled

Companies covered

16.2 Company ranking index

16.3 Market positioning of companies

Matrix on companies position and classification

16.4 ABLIC Inc.

ABLIC Inc. - Overview
ABLIC Inc. - Product / Service
ABLIC Inc. - Key offerings
SWOT

16.5 Advanced Linear Devices Inc.

Advanced Linear Devices Inc. - Overview
Advanced Linear Devices Inc. - Product / Service
Advanced Linear Devices Inc. - Key news
Advanced Linear Devices Inc. - Key offerings
SWOT

16.6 Analog Devices Inc.

Analog Devices Inc. - Overview
Analog Devices Inc. - Business segments
Analog Devices Inc. - Key news
Analog Devices Inc. - Key offerings
Analog Devices Inc. - Segment focus
SWOT

16.7 Cirrus Logic Inc.

Cirrus Logic Inc. - Overview
Cirrus Logic Inc. - Product / Service
Cirrus Logic Inc. - Key news
Cirrus Logic Inc. - Key offerings
SWOT

16.8 Diodes Inc.

Diodes Inc. - Overview
Diodes Inc. - Product / Service
Diodes Inc. - Key offerings
SWOT

16.9 Infineon Technologies AG

Infineon Technologies AG - Overview
Infineon Technologies AG - Business segments
Infineon Technologies AG - Key news
Infineon Technologies AG - Key offerings
Infineon Technologies AG - Segment focus
SWOT

16.10 KEC Holdings

KEC Holdings - Overview
KEC Holdings - Product / Service
KEC Holdings - Key offerings
SWOT

16.11 Microchip Technology Inc.

Microchip Technology Inc. - Overview
Microchip Technology Inc. - Business segments
Microchip Technology Inc. - Key news
Microchip Technology Inc. - Key offerings
Microchip Technology Inc. - Segment focus
SWOT

16.12 Nisshinbo Holdings Inc.

Nisshinbo Holdings Inc. - Overview
Nisshinbo Holdings Inc. - Business segments
Nisshinbo Holdings Inc. - Key offerings
Nisshinbo Holdings Inc. - Segment focus
SWOT

16.13 ON Semiconductor Corp.

ON Semiconductor Corp. - Overview
ON Semiconductor Corp. - Business segments
ON Semiconductor Corp. - Key news
ON Semiconductor Corp. - Key offerings
ON Semiconductor Corp. - Segment focus
SWOT

16.14 Renesas Electronics Corp.

Renesas Electronics Corp. - Overview
Renesas Electronics Corp. - Business segments
Renesas Electronics Corp. - Key news
Renesas Electronics Corp. - Key offerings
Renesas Electronics Corp. - Segment focus
SWOT

16.15 ROHM Co. Ltd.

ROHM Co. Ltd. - Overview
ROHM Co. Ltd. - Business segments
ROHM Co. Ltd. - Key news
ROHM Co. Ltd. - Key offerings
ROHM Co. Ltd. - Segment focus
SWOT

16.16 STMicroelectronics NV

STMicroelectronics NV - Overview
STMicroelectronics NV - Business segments
STMicroelectronics NV - Key news
STMicroelectronics NV - Key offerings
STMicroelectronics NV - Segment focus
SWOT

16.17 Texas Instruments Inc.

Texas Instruments Inc. - Overview
Texas Instruments Inc. - Business segments
Texas Instruments Inc. - Key offerings
Texas Instruments Inc. - Segment focus
SWOT

16.18 Toshiba Electronic Devices and Storage Corp.

Toshiba Electronic Devices and Storage Corp. - Overview
Toshiba Electronic Devices and Storage Corp. - Product / Service
Toshiba Electronic Devices and Storage Corp. - Key offerings
SWOT

17. Appendix

17.1 Scope of the report

Market definition
Objectives
Notes and caveats

17.2 Inclusions and exclusions checklist

Inclusions checklist
Exclusions checklist

17.3 Currency conversion rates for US$

17.4 Research methodology

17.5 Data procurement

Information sources

17.6 Data validation

17.7 Validation techniques employed for market sizing

17.8 Data synthesis

17.9 360 degree market analysis

17.10 List of abbreviations

Research Methodology

Technavio presents a detailed picture of the market by way of study, synthesis, and summation of data from multiple sources. The analysts have presented the various facets of the market with a particular focus on identifying the key industry influencers. The data thus presented is comprehensive, reliable, and the result of extensive research, both primary and secondary.

INFORMATION SOURCES

Primary sources

  • Manufacturers and suppliers
  • Channel partners
  • Industry experts
  • Strategic decision makers

Secondary sources

  • Industry journals and periodicals
  • Government data
  • Financial reports of key industry players
  • Historical data
  • Press releases

DATA ANALYSIS

Data Synthesis

  • Collation of data
  • Estimation of key figures
  • Analysis of derived insights

Data Validation

  • Triangulation with data models
  • Reference against proprietary databases
  • Corroboration with industry experts

REPORT WRITING

Qualitative

  • Market drivers
  • Market challenges
  • Market trends
  • Five forces analysis

Quantitative

  • Market size and forecast
  • Market segmentation
  • Geographical insights
  • Competitive landscape

Interested in this report?

Get your sample now to see our research methodology and insights!

Download Now

Frequently Asked Questions

Operational Amplifier market growth will increase by USD 1450.2 million during 2025-2029 .

The Operational Amplifier market is expected to grow at a CAGR of 4.6% during 2025-2029 .

Operational Amplifier market is segmented by Application (Automatic control system, Test and measurement, Vehicle electronics) Type (General-purpose, Precision, High-speed, Low-noise, Others) End-user (Consumer electronics, Automotive, Healthcare, Aerospace and defense, Others) Product type (Open-loop, Closed-loop)

ABLIC Inc., Advanced Linear Devices Inc., Analog Devices Inc., Apex Microtechnology, Cirrus Logic Inc., Diodes Inc., Infineon Technologies AG, KEC Holdings, Microchip Technology Inc., Monolithic Power Systems Inc., Nisshinbo Holdings Inc., ON Semiconductor Corp., Renesas Electronics Corp., Richtek Technology Corp., ROHM Co. Ltd., STMicroelectronics NV, Texas Instruments Inc., Toshiba Electronic Devices and Storage Corp., UTC are a few of the key vendors in the Operational Amplifier market.

APAC will register the highest growth rate of 39.1% among the other regions. Therefore, the Operational Amplifier market in APAC is expected to garner significant business opportunities for the vendors during the forecast period.

China, Japan, South Korea, India, Australia, Indonesia, US, Canada, Mexico, Germany, UK, France, Italy, Spain, The Netherlands, Brazil, Argentina, Colombia, South Africa, UAE, Saudi Arabia, Israel, Turkey

  • Proliferation of Internet of Things and connected devices is the driving factor this market.

The Operational Amplifier market vendors should focus on grabbing business opportunities from the Application segment as it accounted for the largest market share in the base year.