Optical Switches Market Analysis, Size, and Forecast 2025-2029: North America (US and Canada), Europe (France, Germany, Italy, and UK), APAC (China, India, Japan, and South Korea), and Rest of World (ROW)

Optical Switches Market Analysis, Size, and Forecast 2025-2029:
North America (US and Canada), Europe (France, Germany, Italy, and UK), APAC (China, India, Japan, and South Korea), and Rest of World (ROW)

Published: Apr 2025 228 Pages SKU: IRTNTR71791

Market Overview at a Glance

$8.35 B
Market Opportunity
14.7%
CAGR
12.6
YoY growth 2024-2025(%)

Optical Switches Market Size 2025-2029

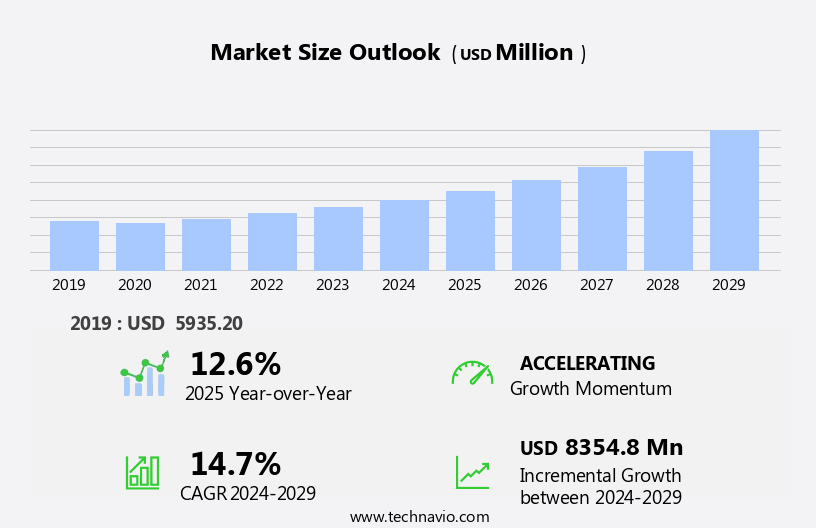
The optical switches market size is forecast to increase by USD 8.35 billion at a CAGR of 14.7% between 2024 and 2029.

  • The market is experiencing significant growth, driven by the increasing construction of data centers and the scaling opportunities presented by emerging new age technologies. Data centers require high-speed, efficient, and reliable connectivity solutions, making optical switches an essential component. However, challenges persist in the market. Regulatory hurdles impact adoption due to stringent regulations regarding optical switch technology and its implementation. Furthermore, inconsistencies in the supply chain, including raw material availability and price fluctuations, temper growth potential. To capitalize on market opportunities, companies must navigate these challenges effectively.
  • Moreover, the increasing construction of data centers is driving market growth, as these facilities require advanced networking solutions to manage their vast amounts of data. Additionally, the emergence of new age technologies, such as artificial intelligence and the Internet of Things, presents scalable business opportunities for optical switch manufacturers. Strategic partnerships, technological innovations, and regulatory compliance are key strategies to overcome regulatory hurdles. Efficient supply chain management and diversification of raw material sources can help mitigate supply chain inconsistencies. By addressing these challenges, companies can seize the potential of the market and contribute to its continued growth.

What will be the Size of the Optical Switches Market during the forecast period?

Optical Switches Market Size

 Request Free Sample

  • In the dynamic world of data communication, the market is experiencing significant growth due to the increasing demand for high-speed networks and digital transformation. With the surge in data traffic, particularly in verticals such as cloud computing and 5G communication networks, the need for efficient and reliable optical switch networks has become crucial. Wavelength routing, a key technology in optical communication, enables the efficient management of data packets and reduces energy consumption. However, high costs associated with optical switches and the need for switching protection to ensure data integrity remain challenges. Company innovations and technical improvements continue to address these concerns, with product offerings that include advanced restoration capabilities and open optical networking solutions.
  • In addition, the market is experiencing significant growth due to the increasing demand for high-bandwidth, high-speed networks in various verticals, including data centers, cloud computing, and 5G infrastructure. Optical switches, which utilize optical fibers for data packet routing, offer advantages such as low energy consumption, high data transmission rates, and automation capabilities. Moreover, the fiber management and fiber communication are also critical components in the optical switch market, as data centers seek to maximize their capacity and minimize latency. The integration of automation and digital transformation further enhances the value proposition of optical switches, making them an essential element in the evolving communication landscape. Despite budget constraints, the benefits of high-speed, reliable, and energy-efficient optical switch networks are driving market growth. The future of data transmission rates and fiber optic technology is bright, as the industry continues to innovate and adapt to the ever-increasing demands of digital business.

How is this Optical Switches Industry segmented?

The optical switches industry research report provides comprehensive data (region-wise segment analysis), with forecasts and estimates in "USD million" for the period 2025-2029, as well as historical data from 2019-2023 for the following segments.

  • Application
    • Data communications
    • Telecommunications
    • Others
  • Type
    • Large enterprise
    • SMEs
  • Technique
    • Circuit switching
    • Multiplexing
    • Cross-connects
    • Signal monitoring
    • Testing
  • Geography
    • North America
      • US
      • Canada
    • Europe
      • France
      • Germany
      • Italy
      • UK
    • APAC
      • China
      • India
      • Japan
      • South Korea
    • Rest of World (ROW)

By Application Insights

The data communications segment is estimated to witness significant growth during the forecast period.

In the rapidly evolving digital landscape, the demand for high-speed data connections is surging due to the proliferation of Internet of Things (IoT) devices and increasing mobile and fixed broadband subscribers. The need for seamless communication between these devices has led to the expansion of high-speed networks and data centers. Light signals and optical fibers have emerged as essential components in this digital transformation, offering high bandwidth, low energy consumption, and minimal signal degradation. External modulators and receivers play a crucial role in the conversion and transmission of optical signals. Product innovations, such as wavelength routing and switching protection, ensure efficient data transmission and restoration in optical switch networks.

Service providers and telecom network operators are investing heavily in open optical networking and high-capacity optical switches to cater to the increasing data traffic. The integration of automation, AI, and 5G in communication networks is revolutionizing data packet routing and processing. Virtual reality applications and cloud computing are driving the need for next-generation data centers and supercomputers. However, high costs remain a significant challenge in the implementation of these advanced technologies. Fiber communication systems and network monitors are essential tools for managing and maintaining the intricacies of these complex networks. Optical switch capacity is a critical factor in ensuring uninterrupted data transmission, especially in verticals like finance, healthcare, and education.

Budget constraints and high costs are key challenges, with semiconductor products and communication network infrastructure being significant investments. The market is also influenced by the increasing importance of fiber communication, restoration, wavelength routing, fiber optic restoration, and switching protection. Key trends include the adoption of open optical networking, AI, the Internet of Things, virtual reality, and next-generation data centers and supercomputers.

Optical Switches Market Size

Request Free Sample

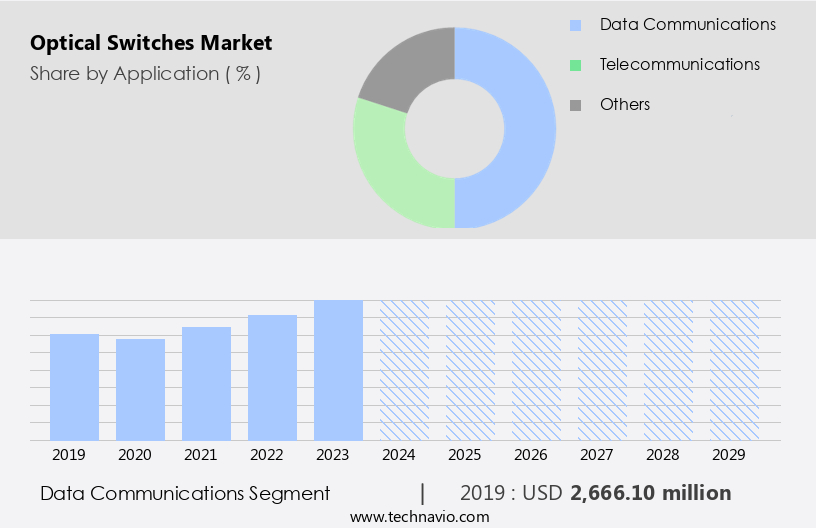
The Data communications segment was valued at USD 2.67 billion in 2019 and showed a gradual increase during the forecast period.

Regional Analysis

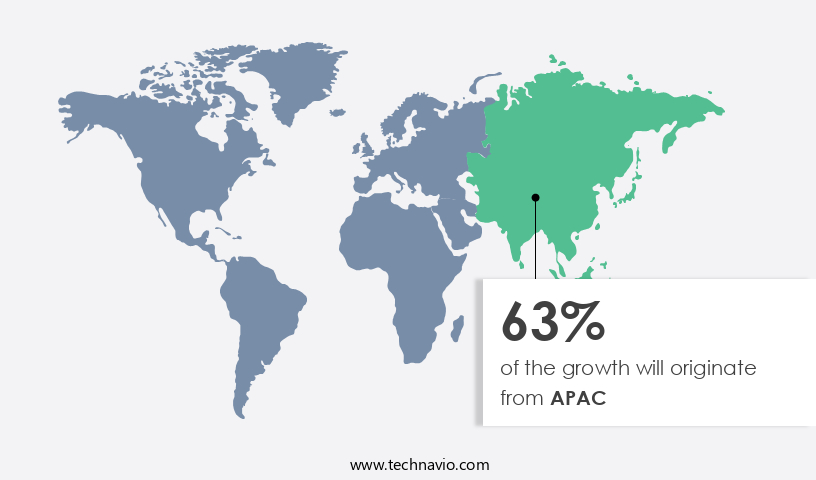
APAC is estimated to contribute 63% to the growth of the global market during the forecast period. Technavio's analysts have elaborately explained the regional trends and drivers that shape the market during the forecast period.

Optical Switches Market Share by Geography

Download Free Sample Report

In the dynamic world of technology, the Optical Switch Market is witnessing significant advancements, driven by the escalating demand for high-speed data transmission and the digital transformation sweeping across various industries. This market is characterized by the integration of several entities: electrical data, energy consumption, external modulators, receivers, high bandwidth, light signals, mobile connectivity, service providers, high-speed networks, component testing, 5G Cloud, OXCs, product innovations, information interaction, data traffic, switching protection, high costs, optical switch network, wavelength routing, technical improvements, product innovation, restoration, optical switch, open optical networking, fiber optic, digital transformation, optical switch capacity, 5G, communication network, data packet routing, verticals, cloud computing, automation, AI, Nokia, budget constraints, virtual reality, OADM, fiber communication, optical communication, telecom network operators, telecommunications, optical fibers, transmitter, network monitors, fiber systems, optical signals, IOCs, data transmission paths, data transmission rates, Internet of Things, data processing, fiber management, data centers, supercomputers, and traffic.

Optical switches are essential components in high-speed networks, enabling efficient data transmission and interaction between various nodes. These switches utilize light signals instead of electrical signals, resulting in faster transmission rates and reduced energy consumption. The increasing adoption of 5G and the cloud, as well as the growing importance of automation, AI, and the Internet of Things, are propelling the market forward. Product innovations, such as restoration and open optical networking, are enhancing the capabilities of optical switches, making them indispensable in high-capacity communication networks. The telecom network operators and service providers are investing heavily in optical switch technology to cater to the burgeoning data traffic and the demands of verticals like cloud computing, financial services, and healthcare.

The integration of 5G and the 5G cloud is expected to further fuel the market's growth. However, the high costs associated with optical switch networks and the need for rigorous component testing remain challenges. Despite these hurdles, the market is poised for continued growth, driven by the relentless pursuit of faster data transmission and the digital transformation of industries.

Market Dynamics

Our researchers analyzed the data with 2024 as the base year, along with the key drivers, trends, and challenges. A holistic analysis of drivers will help companies refine their marketing strategies to gain a competitive advantage.

What are the Optical Switches market drivers leading to the rise in the adoption of Industry?

  • The significant expansion of data center construction serves as the primary catalyst for market growth.  Optical networking plays a pivotal role in storage area networking and business connectivity solutions. In response to the increasing demand for high bandwidth, low power consumption, and extended reach in data centers, there is a growing need for advanced optical modules. Traditional data centers have relied on available network resources and technologies. However, with the surge in data center investments, there is a pressing requirement for new-age optical solutions. Modern data centers transfer data at rates of 10 GB and above, making it increasingly challenging to maintain these rates using electrical interconnects based on copper wires.
  • To address this challenge, data center operators are turning to fiber optic networks, which offer higher bandwidth and energy efficiency. The proliferation of cloud in data centers and applications is further driving the adoption of optical networking. As data traffic grows, data center operators need larger portfolios of fiber optic modules to connect servers and switches. External modulators, receiver technology, and high-speed networks are essential components of these optical solutions. Product innovations, such as Optical Cross-Connects (OXCs), enable efficient information interaction and management in high-density data center environments. Optical switches are an integral part of these solutions, enabling the efficient routing of light signals in fiber optic networks.
  • Energy consumption is a critical consideration in data center design, and optical switches offer significant energy savings compared to electrical switches. Mobile connectivity and 5G cloud applications also benefit from the high bandwidth and low latency offered by optical networking. Component testing and quality assurance are essential to ensure the reliability and performance of these advanced optical solutions. As the market for optical networking continues to evolve, we can expect further innovations that will enable more efficient and cost-effective data transfer in data centers.

What are the Optical Switches market trends shaping the Industry?

  • The emerging trend in the market involves the adoption and scaling of new age technologies, presenting significant business opportunities. These innovative technologies continue to shape industries and create new avenues for growth. Optical switches play a crucial role in modern communication networks, particularly as data traffic continues to increase significantly due to the proliferation of data-centric applications and emerging technologies. The market is driven by the growing demand for high-capacity networking solutions to manage this surge in data volume. Traditional fiber optic networks, which rely on digital packet routing, are being supplemented by open optical networking, which utilizes wavelength routing for more efficient and flexible data transmission. Optical switching protection and restoration are essential features that ensure network reliability and minimize downtime, making them indispensable in today's digital transformation era.
  • High costs associated with optical switch networks have been a concern, but ongoing technical improvements and product innovation are addressing these challenges. The integration of optical switches in 5G communication networks is expected to further boost market growth. Additionally, the increasing adoption of sensor networks and the Internet of Things (IoT) will create new opportunities for optical switch technology. The success of these emerging technologies hinges on their ability to provide extensive services, making the optical switch market an essential component of the global communication infrastructure.

How does Optical Switches market faces challenges face during its growth?

  • The deployment of optical fiber networks presents significant challenges that impact the industry's growth. These challenges must be addressed by professionals to ensure the successful implementation and expansion of these advanced communication systems. In the communications industry, optical switches hold significant importance for both telecom network operators and cloud computing service providers. The verticals of telecommunications and cloud computing are experiencing substantial growth, driven by automation, artificial intelligence (AI), and virtual reality applications. However, deploying optical communication systems, particularly in multi-dwelling units (MDUs), can face challenges. Engineering constraints, such as space limitations and the presence of multiple cable networks, can increase installation time and costs.
  • Creating conduits, pulling fiber above ceilings, and making pathways within walls can cause bottlenecks, especially in brownfield MDUs. Obtaining necessary approvals from customers, residents, and government agencies further complicates the process. Despite these challenges, the demand for optical fibers and their associated components, including transmitters and network monitors, continues to rise. Nokia, among other key players, is investing in innovative solutions to address these deployment hurdles and cater to the increasing demand for fiber communication in various industries.

Exclusive Customer Landscape

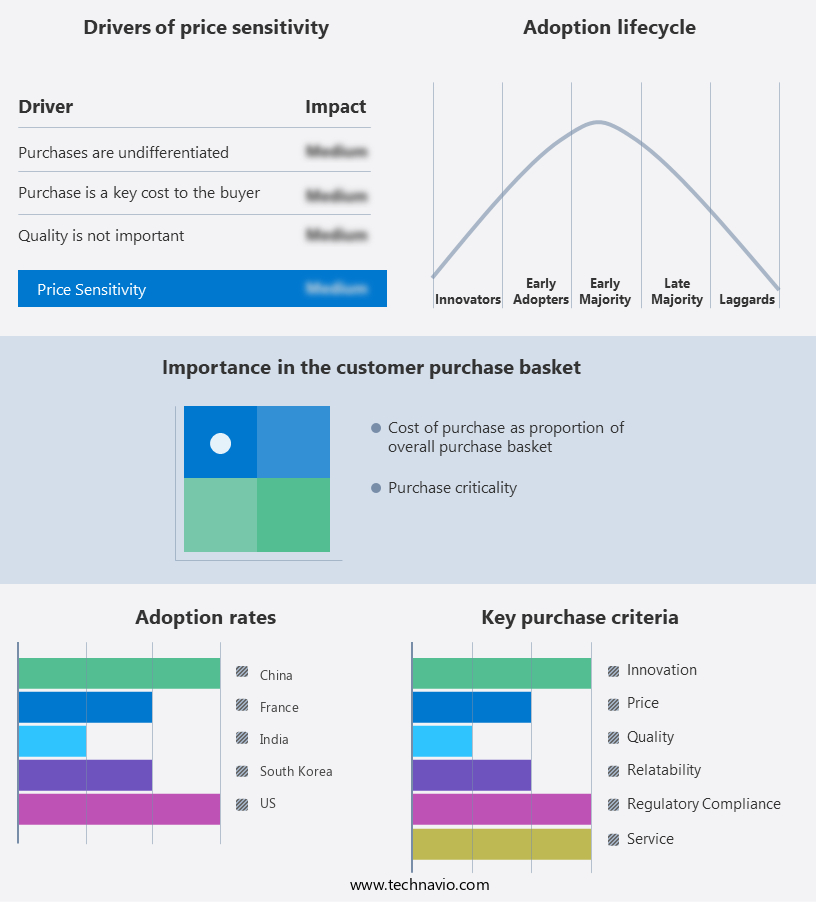
The optical switches market forecasting report includes the adoption lifecycle of the market, covering from the innovator's stage to the laggard's stage. It focuses on adoption rates in different regions based on penetration. Furthermore, the optical switches market report also includes key purchase criteria and drivers of price sensitivity to help companies evaluate and develop their market growth analysis strategies.

Optical Switches Market Share by Geography

 Customer Landscape

Key Companies & Market Insights

Companies are implementing various strategies, such as strategic alliances, optical switches market forecast, partnerships, mergers and acquisitions, geographical expansion, and product/service launches, to enhance their presence in the industry.

Agilent Technologies Inc. - The company offers optical switching and routing protocol and a switching test system.

The industry research and growth report includes detailed analyses of the competitive landscape of the market and information about key companies, including:

  • Agilent Technologies Inc.
  • Agiltron Inc.
  • Broadcom Inc.
  • Cisco Systems Inc.
  • D Link Corp.
  • Fujitsu Ltd.
  • Furukawa Electric Co. Ltd.
  • HP Inc.
  • Huawei Technologies Co. Ltd.
  • Juniper Networks Inc.
  • Keysight Technologies Inc.
  • NEC Corp.
  • Nokia Corp.
  • NTT Advanced Technology Corp.
  • ON Semiconductor Corp.
  • Siemens AG
  • Telefonaktiebolaget LM Ericsson
  • Yokogawa Electric Corp.
  • ZTE Corp.

Qualitative and quantitative analysis of companies has been conducted to help clients understand the wider business environment as well as the strengths and weaknesses of key industry players. Data is qualitatively analyzed to categorize companies as pure play, category-focused, industry-focused, and diversified; it is quantitatively analyzed to categorize companies as dominant, leading, strong, tentative, and weak.

Recent Development and News in Optical Switches Market

  • In February 2023, Cisco Systems, a leading technology company, announced the launch of its new NCS 5500 Series Optical Line System, featuring advanced optical switching capabilities. This innovative solution is designed to support high-speed data transfer and improve network efficiency for service providers and data center operators (Cisco Press Release).
  • In July 2024, Huawei, a global ICT solutions provider, entered into a strategic partnership with Corning Incorporated, a leading glass and specialty materials company. The collaboration aimed to accelerate the development and commercialization of optical interconnect solutions, including optical switches, to address the increasing demand for high-speed connectivity in data centers and telecommunications networks (Huawei Press Release).
  • In October 2024, Lumentum Holdings Inc., a leading supplier of optical and photonic products, announced the completion of its acquisition of Oclaro Inc., a provider of optical communications components and modules. This strategic move expanded Lumentum's product portfolio and strengthened its position in the optical switching market, enabling the company to offer a broader range of solutions to its customers (Lumentum Press Release).
  • In March 2025, the European Union approved the Horizon Europe research and innovation program, which includes a significant focus on advancing photonics technologies, including optical switches. This initiative is expected to boost R&D investments and drive technological advancements in the optical switching market, contributing to the development of more efficient, scalable, and cost-effective solutions (European Commission Press Release).

Research Analyst Overview

Optical switches, a crucial component in high-speed networks, continue to play a pivotal role in the digital transformation of various industries. These switches utilize optical signals to route data packets, enabling efficient information interaction and data traffic management in high bandwidth communication networks. Energy consumption is a significant concern in the optical switch market, with external modulators and receivers contributing to high power usage. Technical improvements in these components, such as the integration of digital signal processing and AI, aim to reduce energy consumption while maintaining high switching speeds and capacity. The advent of 5G and the cloud have fueled the demand for optical switches in mobile connectivity and data centers.

Service providers and telecom network operators are investing in high-speed networks to accommodate the increasing data traffic and ensure seamless communication. Component testing and optimization are essential to ensure the reliability and performance of optical switch networks. Open optical networking and OADM (Optical Add-Drop Multiplexers) are gaining popularity due to their flexibility and cost-effectiveness in managing data transmission paths and rates. Product innovations in the optical switch market include wavelength routing, which allows for efficient data packet routing and restoration in case of network failures. High-cost optical switches, such as those used in data centers and supercomputers, are undergoing price reductions due to advancements in semiconductor products and next-generation data center designs.

Optical fibers are the backbone of optical communication systems, and fiber systems are continuously evolving to meet the demands of high-speed networks. Telecommunications and the Internet of Things (IoT) are driving the growth of the optical switch market, with applications ranging from fiber management in data centers to automation in industrial processes. The optical switch market is dynamic, with ongoing technical improvements and product innovations shaping the landscape. Nokia, a leading player in the telecommunications industry, is investing in optical switch technology to enhance its 5G cloud offerings. Budget constraints and the need for scalability are driving the adoption of cost-effective solutions, such as OADM and open optical networking.

In the realm of virtual reality and AI, optical switches play a vital role in data processing and transmission rates. The integration of optical communication and electrical data in next-generation data centers is expected to revolutionize the way we process and manage information. In conclusion, the optical switch market is a vibrant and evolving landscape, shaped by the demands of high-speed networks, digital transformation, and the integration of AI and virtual reality. The ongoing technical improvements and product innovations ensure that optical switches continue to play a pivotal role in the efficient management of data traffic and the seamless interaction of information.

Dive into Technavio's robust research methodology, blending expert interviews, extensive data synthesis, and validated models for unparalleled Optical Switches Market insights. See full methodology.

Market Scope

Report Coverage

Details

Page number

228

Base year

2024

Historic period

2019-2023

Forecast period

2025-2029

Growth momentum & CAGR

Accelerate at a CAGR of 14.7%

Market growth 2025-2029

USD 8.35 billion

Market structure

Fragmented

YoY growth 2024-2025(%)

12.6

Key countries

US, China, Japan, India, South Korea, Germany, UK, France, Canada, and Italy

Competitive landscape

Leading Companies, Market Positioning of Companies, Competitive Strategies, and Industry Risks

Request Free Sample

What are the Key Data Covered in this Optical Switches Market Research and Growth Report?

  • CAGR of the Optical Switches industry during the forecast period
  • Detailed information on factors that will drive the growth and forecasting between 2025 and 2029
  • Precise estimation of the size of the market and its contribution of the industry in focus to the parent market
  • Accurate predictions about upcoming growth and trends and changes in consumer behaviour
  • Growth of the market across APAC, North America, Europe, Middle East and Africa, and South America
  • Thorough analysis of the market's competitive landscape and detailed information about companies
  • Comprehensive analysis of factors that will challenge the optical switches market growth and forecasting

We can help! Our analysts can customize this optical switches market research report to meet your requirements.

Get in touch

1 Executive Summary

  • 1.1 Market overview
    • Executive Summary - Chart on Market Overview
    • Executive Summary - Data Table on Market Overview
    • Executive Summary - Chart on Global Market Characteristics
    • Executive Summary - Chart on Market by Geography
    • Executive Summary - Chart on Market Segmentation by Application
    • Executive Summary - Chart on Market Segmentation by Type
    • Executive Summary - Chart on Market Segmentation by Technique
    • Executive Summary - Chart on Incremental Growth
    • Executive Summary - Data Table on Incremental Growth
    • Executive Summary - Chart on Company Market Positioning

2 Technavio Analysis

  • 2.1 Analysis of price sensitivity, lifecycle, customer purchase basket, adoption rates, and purchase criteria
    • Analysis of price sensitivity, lifecycle, customer purchase basket, adoption rates, and purchase criteria
  • 2.2 Criticality of inputs and Factors of differentiation
    • Overview on criticality of inputs and factors of differentiation
  • 2.3 Factors of disruption
    • Overview on factors of disruption
  • 2.4 Impact of drivers and challenges
    • Impact of drivers and challenges in 2024 and 2029

3 Market Landscape

  • 3.1 Market ecosystem
    • Parent Market
    • Data Table on - Parent Market
  • 3.2 Market characteristics
    • Market characteristics analysis
  • 3.3 Value chain analysis
    • Value chain analysis

4 Market Sizing

  • 4.1 Market definition
    • Offerings of companies included in the market definition
  • 4.2 Market segment analysis
    • Market segments
  • 4.3 Market size 2024
    • 4.4 Market outlook: Forecast for 2024-2029
      • Chart on Global - Market size and forecast 2024-2029 ($ million)
      • Data Table on Global - Market size and forecast 2024-2029 ($ million)
      • Chart on Global Market: Year-over-year growth 2024-2029 (%)
      • Data Table on Global Market: Year-over-year growth 2024-2029 (%)

    5 Historic Market Size

    • 5.1 Global Optical Switches Market 2019 - 2023
      • Historic Market Size - Data Table on Global Optical Switches Market 2019 - 2023 ($ million)
    • 5.2 Application segment analysis 2019 - 2023
      • Historic Market Size - Application Segment 2019 - 2023 ($ million)
    • 5.3 Type segment analysis 2019 - 2023
      • Historic Market Size - Type Segment 2019 - 2023 ($ million)
    • 5.4 Technique segment analysis 2019 - 2023
      • Historic Market Size - Technique Segment 2019 - 2023 ($ million)
    • 5.5 Geography segment analysis 2019 - 2023
      • Historic Market Size - Geography Segment 2019 - 2023 ($ million)
    • 5.6 Country segment analysis 2019 - 2023
      • Historic Market Size - Country Segment 2019 - 2023 ($ million)

    6 Qualitative Analysis

    • 6.1 The AI impact on global optical switches market

      7 Five Forces Analysis

      • 7.1 Five forces summary
        • Five forces analysis - Comparison between 2024 and 2029
      • 7.2 Bargaining power of buyers
        • Bargaining power of buyers - Impact of key factors 2024 and 2029
      • 7.3 Bargaining power of suppliers
        • Bargaining power of suppliers - Impact of key factors in 2024 and 2029
      • 7.4 Threat of new entrants
        • Threat of new entrants - Impact of key factors in 2024 and 2029
      • 7.5 Threat of substitutes
        • Threat of substitutes - Impact of key factors in 2024 and 2029
      • 7.6 Threat of rivalry
        • Threat of rivalry - Impact of key factors in 2024 and 2029
      • 7.7 Market condition
        • Chart on Market condition - Five forces 2024 and 2029

      8 Market Segmentation by Application

      • 8.1 Market segments
        • Chart on Application - Market share 2024-2029 (%)
        • Data Table on Application - Market share 2024-2029 (%)
      • 8.2 Comparison by Application
        • Chart on Comparison by Application
        • Data Table on Comparison by Application
      • 8.3 Data communications - Market size and forecast 2024-2029
        • Chart on Data communications - Market size and forecast 2024-2029 ($ million)
        • Data Table on Data communications - Market size and forecast 2024-2029 ($ million)
        • Chart on Data communications - Year-over-year growth 2024-2029 (%)
        • Data Table on Data communications - Year-over-year growth 2024-2029 (%)
      • 8.4 Telecommunications - Market size and forecast 2024-2029
        • Chart on Telecommunications - Market size and forecast 2024-2029 ($ million)
        • Data Table on Telecommunications - Market size and forecast 2024-2029 ($ million)
        • Chart on Telecommunications - Year-over-year growth 2024-2029 (%)
        • Data Table on Telecommunications - Year-over-year growth 2024-2029 (%)
      • 8.5 Others - Market size and forecast 2024-2029
        • Chart on Others - Market size and forecast 2024-2029 ($ million)
        • Data Table on Others - Market size and forecast 2024-2029 ($ million)
        • Chart on Others - Year-over-year growth 2024-2029 (%)
        • Data Table on Others - Year-over-year growth 2024-2029 (%)
      • 8.6 Market opportunity by Application
        • Market opportunity by Application ($ million)
        • Data Table on Market opportunity by Application ($ million)

      9 Market Segmentation by Type

      • 9.1 Market segments
        • Chart on Type - Market share 2024-2029 (%)
        • Data Table on Type - Market share 2024-2029 (%)
      • 9.2 Comparison by Type
        • Chart on Comparison by Type
        • Data Table on Comparison by Type
      • 9.3 Large enterprise - Market size and forecast 2024-2029
        • Chart on Large enterprise - Market size and forecast 2024-2029 ($ million)
        • Data Table on Large enterprise - Market size and forecast 2024-2029 ($ million)
        • Chart on Large enterprise - Year-over-year growth 2024-2029 (%)
        • Data Table on Large enterprise - Year-over-year growth 2024-2029 (%)
      • 9.4 SMEs - Market size and forecast 2024-2029
        • Chart on SMEs - Market size and forecast 2024-2029 ($ million)
        • Data Table on SMEs - Market size and forecast 2024-2029 ($ million)
        • Chart on SMEs - Year-over-year growth 2024-2029 (%)
        • Data Table on SMEs - Year-over-year growth 2024-2029 (%)
      • 9.5 Market opportunity by Type
        • Market opportunity by Type ($ million)
        • Data Table on Market opportunity by Type ($ million)

      10 Market Segmentation by Technique

      • 10.1 Market segments
        • Chart on Technique - Market share 2024-2029 (%)
        • Data Table on Technique - Market share 2024-2029 (%)
      • 10.2 Comparison by Technique
        • Chart on Comparison by Technique
        • Data Table on Comparison by Technique
      • 10.3 Circuit switching - Market size and forecast 2024-2029
        • Chart on Circuit switching - Market size and forecast 2024-2029 ($ million)
        • Data Table on Circuit switching - Market size and forecast 2024-2029 ($ million)
        • Chart on Circuit switching - Year-over-year growth 2024-2029 (%)
        • Data Table on Circuit switching - Year-over-year growth 2024-2029 (%)
      • 10.4 Multiplexing - Market size and forecast 2024-2029
        • Chart on Multiplexing - Market size and forecast 2024-2029 ($ million)
        • Data Table on Multiplexing - Market size and forecast 2024-2029 ($ million)
        • Chart on Multiplexing - Year-over-year growth 2024-2029 (%)
        • Data Table on Multiplexing - Year-over-year growth 2024-2029 (%)
      • 10.5 Cross-connects - Market size and forecast 2024-2029
        • Chart on Cross-connects - Market size and forecast 2024-2029 ($ million)
        • Data Table on Cross-connects - Market size and forecast 2024-2029 ($ million)
        • Chart on Cross-connects - Year-over-year growth 2024-2029 (%)
        • Data Table on Cross-connects - Year-over-year growth 2024-2029 (%)
      • 10.6 Signal monitoring - Market size and forecast 2024-2029
        • Chart on Signal monitoring - Market size and forecast 2024-2029 ($ million)
        • Data Table on Signal monitoring - Market size and forecast 2024-2029 ($ million)
        • Chart on Signal monitoring - Year-over-year growth 2024-2029 (%)
        • Data Table on Signal monitoring - Year-over-year growth 2024-2029 (%)
      • 10.7 Testing - Market size and forecast 2024-2029
        • Chart on Testing - Market size and forecast 2024-2029 ($ million)
        • Data Table on Testing - Market size and forecast 2024-2029 ($ million)
        • Chart on Testing - Year-over-year growth 2024-2029 (%)
        • Data Table on Testing - Year-over-year growth 2024-2029 (%)
      • 10.8 Market opportunity by Technique
        • Market opportunity by Technique ($ million)
        • Data Table on Market opportunity by Technique ($ million)

      11 Customer Landscape

      • 11.1 Customer landscape overview
        • Analysis of price sensitivity, lifecycle, customer purchase basket, adoption rates, and purchase criteria

      12 Geographic Landscape

      • 12.1 Geographic segmentation
        • Chart on Market share by geography 2024-2029 (%)
        • Data Table on Market share by geography 2024-2029 (%)
      • 12.2 Geographic comparison
        • Chart on Geographic comparison
        • Data Table on Geographic comparison
      • 12.3 APAC - Market size and forecast 2024-2029
        • Chart on APAC - Market size and forecast 2024-2029 ($ million)
        • Data Table on APAC - Market size and forecast 2024-2029 ($ million)
        • Chart on APAC - Year-over-year growth 2024-2029 (%)
        • Data Table on APAC - Year-over-year growth 2024-2029 (%)
      • 12.4 North America - Market size and forecast 2024-2029
        • Chart on North America - Market size and forecast 2024-2029 ($ million)
        • Data Table on North America - Market size and forecast 2024-2029 ($ million)
        • Chart on North America - Year-over-year growth 2024-2029 (%)
        • Data Table on North America - Year-over-year growth 2024-2029 (%)
      • 12.5 Europe - Market size and forecast 2024-2029
        • Chart on Europe - Market size and forecast 2024-2029 ($ million)
        • Data Table on Europe - Market size and forecast 2024-2029 ($ million)
        • Chart on Europe - Year-over-year growth 2024-2029 (%)
        • Data Table on Europe - Year-over-year growth 2024-2029 (%)
      • 12.6 Middle East and Africa - Market size and forecast 2024-2029
        • Chart on Middle East and Africa - Market size and forecast 2024-2029 ($ million)
        • Data Table on Middle East and Africa - Market size and forecast 2024-2029 ($ million)
        • Chart on Middle East and Africa - Year-over-year growth 2024-2029 (%)
        • Data Table on Middle East and Africa - Year-over-year growth 2024-2029 (%)
      • 12.7 South America - Market size and forecast 2024-2029
        • Chart on South America - Market size and forecast 2024-2029 ($ million)
        • Data Table on South America - Market size and forecast 2024-2029 ($ million)
        • Chart on South America - Year-over-year growth 2024-2029 (%)
        • Data Table on South America - Year-over-year growth 2024-2029 (%)
      • 12.8 China - Market size and forecast 2024-2029
        • Chart on China - Market size and forecast 2024-2029 ($ million)
        • Data Table on China - Market size and forecast 2024-2029 ($ million)
        • Chart on China - Year-over-year growth 2024-2029 (%)
        • Data Table on China - Year-over-year growth 2024-2029 (%)
      • 12.9 US - Market size and forecast 2024-2029
        • Chart on US - Market size and forecast 2024-2029 ($ million)
        • Data Table on US - Market size and forecast 2024-2029 ($ million)
        • Chart on US - Year-over-year growth 2024-2029 (%)
        • Data Table on US - Year-over-year growth 2024-2029 (%)
      • 12.10 Japan - Market size and forecast 2024-2029
        • Chart on Japan - Market size and forecast 2024-2029 ($ million)
        • Data Table on Japan - Market size and forecast 2024-2029 ($ million)
        • Chart on Japan - Year-over-year growth 2024-2029 (%)
        • Data Table on Japan - Year-over-year growth 2024-2029 (%)
      • 12.11 India - Market size and forecast 2024-2029
        • Chart on India - Market size and forecast 2024-2029 ($ million)
        • Data Table on India - Market size and forecast 2024-2029 ($ million)
        • Chart on India - Year-over-year growth 2024-2029 (%)
        • Data Table on India - Year-over-year growth 2024-2029 (%)
      • 12.12 South Korea - Market size and forecast 2024-2029
        • Chart on South Korea - Market size and forecast 2024-2029 ($ million)
        • Data Table on South Korea - Market size and forecast 2024-2029 ($ million)
        • Chart on South Korea - Year-over-year growth 2024-2029 (%)
        • Data Table on South Korea - Year-over-year growth 2024-2029 (%)
      • 12.13 Germany - Market size and forecast 2024-2029
        • Chart on Germany - Market size and forecast 2024-2029 ($ million)
        • Data Table on Germany - Market size and forecast 2024-2029 ($ million)
        • Chart on Germany - Year-over-year growth 2024-2029 (%)
        • Data Table on Germany - Year-over-year growth 2024-2029 (%)
      • 12.14 UK - Market size and forecast 2024-2029
        • Chart on UK - Market size and forecast 2024-2029 ($ million)
        • Data Table on UK - Market size and forecast 2024-2029 ($ million)
        • Chart on UK - Year-over-year growth 2024-2029 (%)
        • Data Table on UK - Year-over-year growth 2024-2029 (%)
      • 12.15 France - Market size and forecast 2024-2029
        • Chart on France - Market size and forecast 2024-2029 ($ million)
        • Data Table on France - Market size and forecast 2024-2029 ($ million)
        • Chart on France - Year-over-year growth 2024-2029 (%)
        • Data Table on France - Year-over-year growth 2024-2029 (%)
      • 12.16 Canada - Market size and forecast 2024-2029
        • Chart on Canada - Market size and forecast 2024-2029 ($ million)
        • Data Table on Canada - Market size and forecast 2024-2029 ($ million)
        • Chart on Canada - Year-over-year growth 2024-2029 (%)
        • Data Table on Canada - Year-over-year growth 2024-2029 (%)
      • 12.17 Italy - Market size and forecast 2024-2029
        • Chart on Italy - Market size and forecast 2024-2029 ($ million)
        • Data Table on Italy - Market size and forecast 2024-2029 ($ million)
        • Chart on Italy - Year-over-year growth 2024-2029 (%)
        • Data Table on Italy - Year-over-year growth 2024-2029 (%)
      • 12.18 Market opportunity by geography
        • Market opportunity by geography ($ million)
        • Data Tables on Market opportunity by geography ($ million)

      13 Drivers, Challenges, and Opportunity/Restraints

      • 13.1 Market drivers
        • 13.2 Market challenges
          • 13.3 Impact of drivers and challenges
            • Impact of drivers and challenges in 2024 and 2029
          • 13.4 Market opportunities/restraints

            14 Competitive Landscape

            • 14.1 Overview
              • 14.2 Competitive Landscape
                • Overview on criticality of inputs and factors of differentiation
              • 14.3 Landscape disruption
                • Overview on factors of disruption
              • 14.4 Industry risks
                • Impact of key risks on business

              15 Competitive Analysis

              • 15.1 Companies profiled
                • Companies covered
              • 15.2 Company ranking index
                • Company ranking index
              • 15.3 Market positioning of companies
                • Matrix on companies position and classification
              • 15.4 Agilent Technologies Inc.
                • Agilent Technologies Inc. - Overview
                • Agilent Technologies Inc. - Business segments
                • Agilent Technologies Inc. - Key news
                • Agilent Technologies Inc. - Key offerings
                • Agilent Technologies Inc. - Segment focus
                • SWOT
              • 15.5 Agiltron Inc.
                • Agiltron Inc. - Overview
                • Agiltron Inc. - Product / Service
                • Agiltron Inc. - Key offerings
                • SWOT
              • 15.6 Broadcom Inc.
                • Broadcom Inc. - Overview
                • Broadcom Inc. - Business segments
                • Broadcom Inc. - Key news
                • Broadcom Inc. - Key offerings
                • Broadcom Inc. - Segment focus
                • SWOT
              • 15.7 Cisco Systems Inc.
                • Cisco Systems Inc. - Overview
                • Cisco Systems Inc. - Business segments
                • Cisco Systems Inc. - Key news
                • Cisco Systems Inc. - Key offerings
                • Cisco Systems Inc. - Segment focus
                • SWOT
              • 15.8 D Link Corp.
                • D Link Corp. - Overview
                • D Link Corp. - Business segments
                • D Link Corp. - Key offerings
                • D Link Corp. - Segment focus
                • SWOT
              • 15.9 Fujitsu Ltd.
                • Fujitsu Ltd. - Overview
                • Fujitsu Ltd. - Business segments
                • Fujitsu Ltd. - Key news
                • Fujitsu Ltd. - Key offerings
                • Fujitsu Ltd. - Segment focus
                • SWOT
              • 15.10 Furukawa Electric Co. Ltd.
                • Furukawa Electric Co. Ltd. - Overview
                • Furukawa Electric Co. Ltd. - Business segments
                • Furukawa Electric Co. Ltd. - Key offerings
                • Furukawa Electric Co. Ltd. - Segment focus
                • SWOT
              • 15.11 HP Inc.
                • HP Inc. - Overview
                • HP Inc. - Business segments
                • HP Inc. - Key news
                • HP Inc. - Key offerings
                • HP Inc. - Segment focus
                • SWOT
              • 15.12 Huawei Technologies Co. Ltd.
                • Huawei Technologies Co. Ltd. - Overview
                • Huawei Technologies Co. Ltd. - Product / Service
                • Huawei Technologies Co. Ltd. - Key news
                • Huawei Technologies Co. Ltd. - Key offerings
                • SWOT
              • 15.13 Juniper Networks Inc.
                • Juniper Networks Inc. - Overview
                • Juniper Networks Inc. - Product / Service
                • Juniper Networks Inc. - Key news
                • Juniper Networks Inc. - Key offerings
                • SWOT
              • 15.14 Keysight Technologies Inc.
                • Keysight Technologies Inc. - Overview
                • Keysight Technologies Inc. - Business segments
                • Keysight Technologies Inc. - Key news
                • Keysight Technologies Inc. - Key offerings
                • Keysight Technologies Inc. - Segment focus
                • SWOT
              • 15.15 NEC Corp.
                • NEC Corp. - Overview
                • NEC Corp. - Business segments
                • NEC Corp. - Key news
                • NEC Corp. - Key offerings
                • NEC Corp. - Segment focus
                • SWOT
              • 15.16 Nokia Corp.
                • Nokia Corp. - Overview
                • Nokia Corp. - Business segments
                • Nokia Corp. - Key news
                • Nokia Corp. - Key offerings
                • Nokia Corp. - Segment focus
                • SWOT
              • 15.17 NTT Advanced Technology Corp.
                • NTT Advanced Technology Corp. - Overview
                • NTT Advanced Technology Corp. - Product / Service
                • NTT Advanced Technology Corp. - Key offerings
                • SWOT
              • 15.18 Telefonaktiebolaget LM Ericsson
                • Telefonaktiebolaget LM Ericsson - Overview
                • Telefonaktiebolaget LM Ericsson - Business segments
                • Telefonaktiebolaget LM Ericsson - Key news
                • Telefonaktiebolaget LM Ericsson - Key offerings
                • Telefonaktiebolaget LM Ericsson - Segment focus
                • SWOT

              16 Appendix

              • 16.1 Scope of the report
                • 16.2 Inclusions and exclusions checklist
                  • Inclusions checklist
                  • Exclusions checklist
                • 16.3 Currency conversion rates for US$
                  • Currency conversion rates for US$
                • 16.4 Research methodology
                  • Research methodology
                • 16.5 Data procurement
                  • Information sources
                • 16.6 Data validation
                  • Data validation
                • 16.7 Validation techniques employed for market sizing
                  • Validation techniques employed for market sizing
                • 16.8 Data synthesis
                  • Data synthesis
                • 16.9 360 degree market analysis
                  • 360 degree market analysis
                • 16.10 List of abbreviations
                  • List of abbreviations

                Research Methodology

                Technavio presents a detailed picture of the market by way of study, synthesis, and summation of data from multiple sources. The analysts have presented the various facets of the market with a particular focus on identifying the key industry influencers. The data thus presented is comprehensive, reliable, and the result of extensive research, both primary and secondary.

                INFORMATION SOURCES

                Primary sources

                • Manufacturers and suppliers
                • Channel partners
                • Industry experts
                • Strategic decision makers

                Secondary sources

                • Industry journals and periodicals
                • Government data
                • Financial reports of key industry players
                • Historical data
                • Press releases

                DATA ANALYSIS

                Data Synthesis

                • Collation of data
                • Estimation of key figures
                • Analysis of derived insights

                Data Validation

                • Triangulation with data models
                • Reference against proprietary databases
                • Corroboration with industry experts

                REPORT WRITING

                Qualitative

                • Market drivers
                • Market challenges
                • Market trends
                • Five forces analysis

                Quantitative

                • Market size and forecast
                • Market segmentation
                • Geographical insights
                • Competitive landscape

                Interested in this report?

                Get your sample now to see our research methodology and insights!

                Download Now

                Frequently Asked Questions

                Optical Switches market growth will increase by $ 8354.8 mn during 2025-2029.

                The Optical Switches market is expected to grow at a CAGR of 14.7% during 2025-2029.

                Optical Switches market is segmented by Application( Data communications, Telecommunications, Others) Type( Large enterprise, SMEs, Europe, MEA, South America) Technique( Circuit switching, Multiplexing, Cross-connects, Signal monitoring, Testing)

                Agilent Technologies Inc., Agiltron Inc., Broadcom Inc., Cisco Systems Inc., D Link Corp., Fujitsu Ltd., Furukawa Electric Co. Ltd., HP Inc., Huawei Technologies Co. Ltd., Juniper Networks Inc., Keysight Technologies Inc., NEC Corp., Nokia Corp., NTT Advanced Technology Corp., ON Semiconductor Corp., Siemens AG, Telefonaktiebolaget LM Ericsson, Yokogawa Electric Corp., ZTE Corp. are a few of the key vendors in the Optical Switches market.

                APAC will register the highest growth rate of 63% among the other regions. Therefore, the Optical Switches market in APAC is expected to garner significant business opportunities for the vendors during the forecast period.

                US, China, Japan, India, South Korea, Germany, UK, France, Canada, Italy

                • Increasing data center constructionOptical networking is the core of storage area networking and business connectivity solutions. Traditionally is the driving factor this market.
                • data centers used network resources and technologies that were available to them. However is the driving factor this market.
                • wide-scale investments in data centers are increasing the need for new optical modules to meet the demand for high bandwidth is the driving factor this market.
                • low power consumption is the driving factor this market.
                • and a broader reach. Modern data centers transfer data at rates of 10 GB or higher. Maintaining such data transfer rates is increasingly becoming a challenge for electrical interconnects based on copper wires.New data centers require larger portfolios of fiber optic modules to connect servers and switches. Therefore is the driving factor this market.
                • with the growth in data traffic and the emergence of the cloud in data centers and applications is the driving factor this market.
                • data center operators are relying on new-age technologies is the driving factor this market.
                • such as fiber optics networks. They need the newest fiber channel speed steps with high duplex throughput to accommodate the increasing data management requirements.Furthermore is the driving factor this market.
                • analytics applications used for big data analytics and other complex cloud-based applications require high-speed Internet connectivity. Data centers owned by Google is the driving factor this market.
                • Facebook is the driving factor this market.
                • and Microsoft are equipped with energy-efficient and high-performance storage infrastructure. Fiber optics network hardware is a crucial element of these data centers. For instance is the driving factor this market.
                • Googles data center is the driving factor this market.
                • located in Council Bluffs is the driving factor this market.
                • Iowa is the driving factor this market.
                • has a fiber-optic network connecting Googles websites. It can run at a speed that is 2 is the driving factor this market.
                • 00 is the driving factor this market.
                • 000 times faster than the typical US home Internet. The development of the cloud computing platform has been one of the major factors that have driven the need for an increase in data centers. For instance is the driving factor this market.
                • Google announced that it would increase its investments in data centers to support its growing cloud computing enterprise. Data centers have become an important part of almost all business enterprises. The massive growth in the data generated has compelled several companies to build data centers of their own or lease data center space. The growing focus on cloud computing will further drive the need for data centers. Several firms have been investing in the construction of data centers. For example is the driving factor this market.
                • in April 2024 is the driving factor this market.
                • Google broke ground on a $2 billion data center in Fort Wayne is the driving factor this market.
                • Indiana is the driving factor this market.
                • which will support the companys expanding AI and cloud infrastructure. The facility is the driving factor this market.
                • expected to create 200 new jobs is the driving factor this market.
                • is set to be completed by 2025.Several investments are being made in the construction of data centers is the driving factor this market.
                • which indicates the growing need for these data centers to support the enormous expansion in data volumes. Thus is the driving factor this market.
                • the growing demand for data centers also increases the need for fiber optic cables for data transmission is the driving factor this market.
                • which will drive the growth of the market during the forecast period.Fiber optic components is the driving factor this market.
                • such as optical switches is the driving factor this market.
                • will be required for fast and efficient data transmission. Moreover is the driving factor this market.
                • with increasing amounts of data being generated every day is the driving factor this market.
                • it is necessary to use the best technology. The increase in the need for optic fibers will lead to the growth of the fiber optic components market. The investments in data centers will drive the demand for optical modules. Optical modules can address important requirements is the driving factor this market.
                • such as low power consumption is the driving factor this market.
                • a broader reach is the driving factor this market.
                • and increasing bandwidth. The present requirement of data center speeds is the driving factor this market.
                • which easily crosses 10 Gbps is the driving factor this market.
                • cannot be supported by interconnects on copper cables. Thus is the driving factor this market.
                • many optic fiber modules are required to connect many servers is the driving factor this market.
                • storage devices is the driving factor this market.
                • and switches. This increases the need for fiber optic components is the driving factor this market.
                • which will likely drive the market.For fast and efficient data transmission to occur between the interconnects of data centers is the driving factor this market.
                • there is a need for a technology that can support high data transmission rates. Thus is the driving factor this market.
                • companies have adopted 10 Gbps Ethernet speeds and fiber channels. It is to be noted that Gbps is the driving factor this market.
                • either single-mode or multimode optic fibers is the driving factor this market.
                • are used for 10 Gbps Ethernet. Single-mode fibers are more suited for long-distance transmission is the driving factor this market.
                • whereas multimode optic fibers are preferred for transmission over shorter distances. Fiber optics is a preferred choice because of its low power consumption over long distances. With the growing number of data centers across the globe is the driving factor this market.
                • the demand for optical switches is expected to increase substantially. is the driving factor this market.

                The Optical Switches market vendors should focus on grabbing business opportunities from the Data communications segment as it accounted for the largest market share in the base year.
                RIA - Research AI Assistant
                Ask RIA