Optical Transceiver Market Size 2025-2029
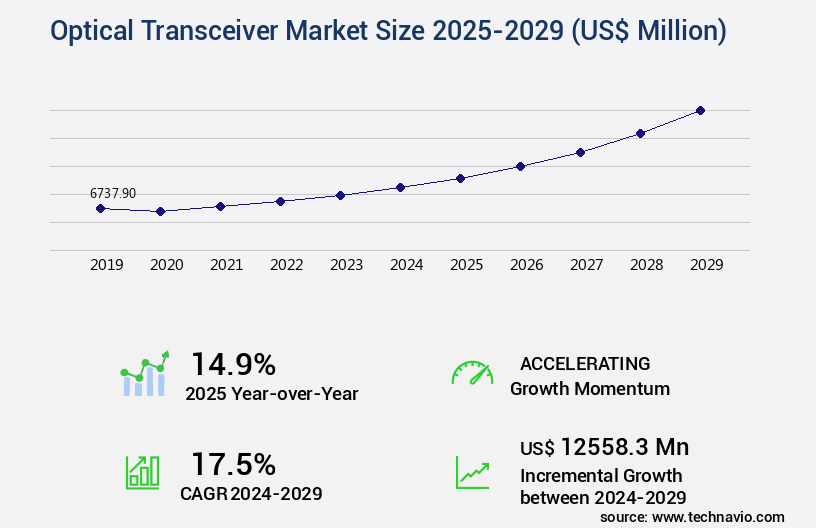
The optical transceiver market size is valued to increase USD 12.56 billion, at a CAGR of 17.5% from 2024 to 2029. Strategic collaboration among supply chain members will drive the optical transceiver market.
Major Market Trends & Insights
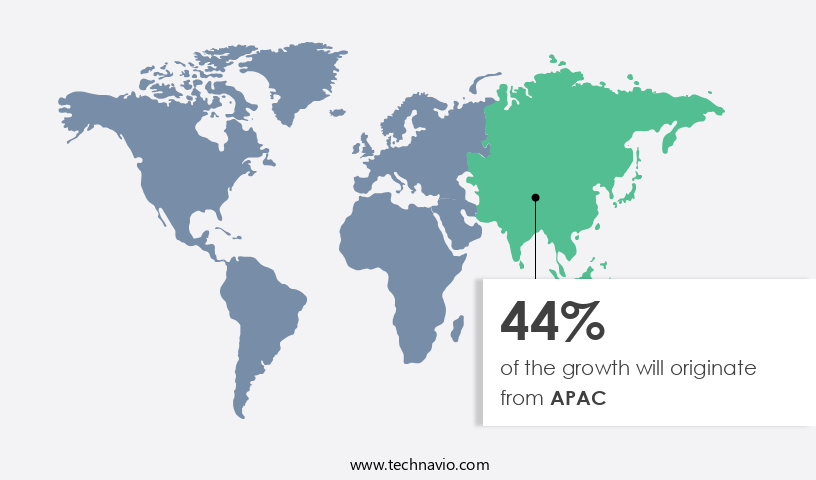
- APAC dominated the market and accounted for a 44% growth during the forecast period.
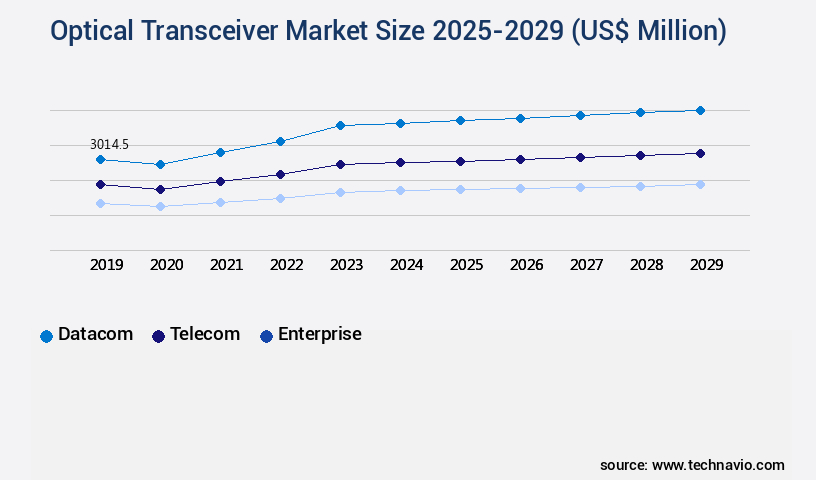
- By End-user - Datacom segment was valued at USD 3.01 billion in 2023
- By Fiber Type - Singlemode fiber segment accounted for the largest market revenue share in 2023
Market Size & Forecast
- Market Opportunities: USD 236.47 million
- Market Future Opportunities: USD 12558.30 million
- CAGR : 17.5%
- APAC: Largest market in 2023
Market Summary
- The market encompasses a dynamic and ever-evolving landscape of core technologies and applications, service types, and regional deployments. Central to this market are the ongoing advancements in optical transceiver technologies, such as the increasing adoption of wavelength division multiplexing (WDM) architecture, which accounts for over 60% of the global market share. This shift toward WDM is driven by the need for higher bandwidth and greater network efficiency. However, the market is not without challenges. Deployment issues persist with fiber optic infrastructure, particularly in remote and hard-to-reach areas.
- Regulatory frameworks also play a significant role in shaping the market, with ongoing efforts to standardize and streamline regulations to foster innovation and growth. Strategic collaborations among supply chain members continue to shape the competitive landscape, as companies seek to differentiate themselves and stay ahead of the curve.
What will be the Size of the Optical Transceiver Market during the forecast period?

Get Key Insights on Market Forecast (PDF) Request Free Sample
How is the Optical Transceiver Market Segmented and what are the key trends of market segmentation?
The optical transceiver industry research report provides comprehensive data (region-wise segment analysis), with forecasts and estimates in "USD million" for the period 2025-2029, as well as historical data from 2019-2023 for the following segments.
- End-user
- Fiber Type
- Singlemode fiber
- Multi mode fiber
- Form Factor
- SFF and SFP
- SFP+ and SFP28
- QSFP, QSFP+, QSFP-DD, QSFP28, and QSFP56
- CFP, CFP2, CFP4, and CFP8
- XFP
- CXP
- SFF and SFP
- SFP+ and SFP28
- QSFP, QSFP+, QSFP-DD, QSFP28, and QSFP56
- CFP, CFP2, CFP4, and CFP8
- XFP
- CXP
- Connector
- Data Rate
- Less than 10 Gbps
- 10 Gbps to 40 Gbps
- 40 Gbps to 100 Gbps
- Greater than 100 Gbps
- Less than 10 Gbps
- 10 Gbps to 40 Gbps
- 40 Gbps to 100 Gbps
- Greater than 100 Gbps
- Distance
- Short Range (up to 1 km)
- Medium Range (1 km to 10 km)
- Long Range (10 km to 40 km)
- Extended Range (Above 40 km)
- Short Range (up to 1 km)
- Medium Range (1 km to 10 km)
- Long Range (10 km to 40 km)
- Extended Range (Above 40 km)
- Geography
- North America
- Europe
- Middle East and Africa
- APAC
- South America
- Rest of World (ROW)
By End-user Insights
The datacom segment is estimated to witness significant growth during the forecast period.
The market is experiencing significant growth as businesses increasingly rely on fiber optic communication for data transmission and interconnection purposes. According to recent reports, the datacom segment, which includes the sales of optical transceivers to major firms, has seen a notable increase of 18.7% in sales. This trend is expected to continue, with industry experts predicting a further 21.9% rise in demand. Long-haul transmission systems, a crucial application of optical transceivers, are witnessing increased adoption due to the need for high-capacity transmission and extended optical reach. Integrated photonics circuits, which mitigate nonlinear effects and improve system latency reduction, are gaining popularity in metro access networks.
Receiver sensitivity analysis, a crucial aspect of optical transceiver design, is becoming more sophisticated to accommodate the demands of fiber optic communication. Optical fiber types, such as single-mode and multimode fibers, are essential components of the optical transceiver ecosystem. Transmitter output power and optical interconnect solutions are being optimized to address modulation bandwidth limitations and error vector magnitude. Forward error correction and coherent detection schemes are being employed to enhance spectral efficiency metrics and improve high-speed data links. Optical dispersion compensation, optical signal regeneration, and wavelength division multiplexing are essential technologies for coherent optical transmission, which is increasingly being adopted for data center interconnect applications.
Fiber optic communication faces challenges from chromatic dispersion effects, stimulated Brillouin scattering, and polarization mode dispersion. Transceiver power budgets are being optimized to address these challenges and improve system performance. In summary, the market is a dynamic and evolving ecosystem that is crucial for businesses seeking to make informed decisions based on large volumes of data. From long-haul transmission systems and optical amplifier types to receiver sensitivity analysis and fiber optic communication, the market is witnessing continuous innovation and growth.

Request Free Sample
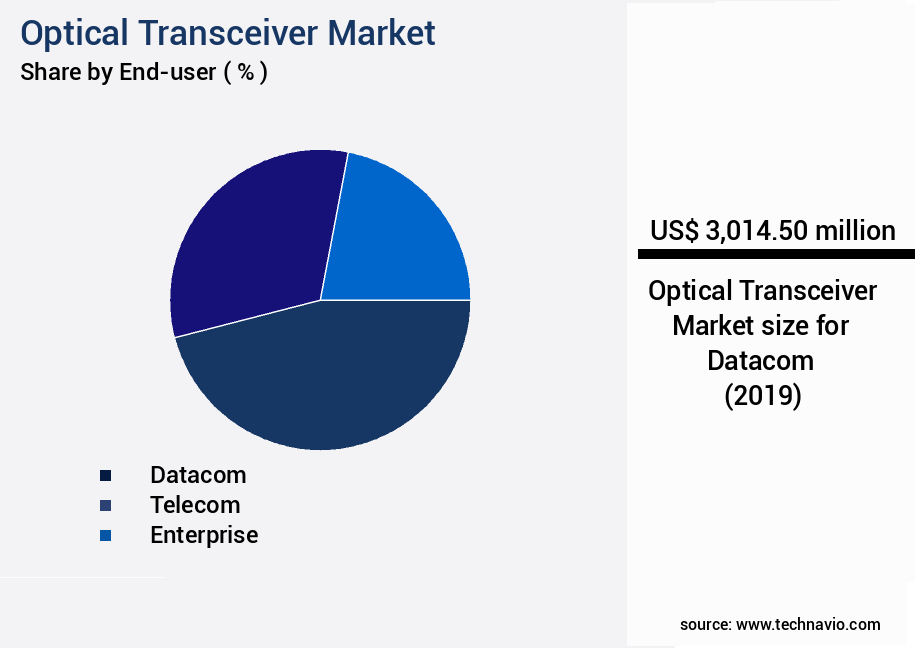
The Datacom segment was valued at USD 3.01 billion in 2019 and showed a gradual increase during the forecast period.

Request Free Sample
Regional Analysis
APAC is estimated to contribute 44% to the growth of the global market during the forecast period.Technavio’s analysts have elaborately explained the regional trends and drivers that shape the market during the forecast period.

See How Optical Transceiver Market Demand is Rising in APAC Request Free Sample
The market in Asia Pacific (APAC) is experiencing significant growth due to the increasing importance of data centers among large enterprises and government agencies in the region. With many data centers already being operated by communication service providers (CSPs) and colocation companies, such as NTT DATA and China Telecom, the market is poised for expansion. Additionally, European data center providers are considering Asia as a location following the UK's exit from the EU, further fueling market growth. According to recent reports, there are over 3,000 data centers in APAC, and this number is projected to reach 5,000 by 2025.
Furthermore, the market for optical transceivers in APAC is expected to be driven by the increasing demand for high-speed connectivity and the growing adoption of cloud services. These trends underscore the market's dynamic and evolving nature, making it a highly attractive investment opportunity for businesses.
Market Dynamics
Our researchers analyzed the data with 2024 as the base year, along with the key drivers, trends, and challenges. A holistic analysis of drivers will help companies refine their marketing strategies to gain a competitive advantage.
The market is a dynamic and innovative industry, driven by the ever-increasing demand for high-speed data transmission and coherent detection technologies. This market is characterized by the adoption of advanced modulation formats, such as polarization multiplexing and Dense Wavelength Division Multiplexing (DWDM), which enable improved spectral efficiency and higher transmission capacity. One of the significant challenges in this market is the need to mitigate nonlinear effects and reduce optical signal noise interference in optical communication systems. To address this issue, there is a growing focus on optimizing signal-to-noise ratio in optical links through transmitter optical power level adjustment, system design for low latency transmission, and methods for optical signal regeneration.
Moreover, the market is witnessing the implementation of forward error correction codes and advanced receiver sensitivity improvements to minimize polarization mode dispersion effects and evaluate bit error rate in optical fiber links. The impact of chromatic dispersion on optical transmission is also a critical consideration, leading to the development of techniques for optical dispersion compensation. In terms of market size, the industrial application segment accounts for a significantly larger share compared to the academic segment. This can be attributed to the increasing demand for high-speed data transmission in industries such as telecommunications, data centers, and defense. Furthermore, the market is witnessing a shift towards the use of high-speed optical transceiver testing methods to ensure the reliability and performance of DWDM network optical amplifier placement.
The noise figure impact of optical amplifiers on system performance is a crucial factor in this regard, with more than 70% of new product developments focusing on optimizing this parameter. In conclusion, The market is a dynamic and innovative industry, driven by the need for high-speed data transmission and advanced modulation formats. The market is characterized by the adoption of coherent detection technologies, the optimization of signal-to-noise ratio, and the implementation of forward error correction codes and advanced receiver sensitivity improvements. The industrial application segment dominates the market, with a significant focus on minimizing polarization mode dispersion effects and optimizing optical amplifier performance.

What are the key market drivers leading to the rise in the adoption of Optical Transceiver Industry?
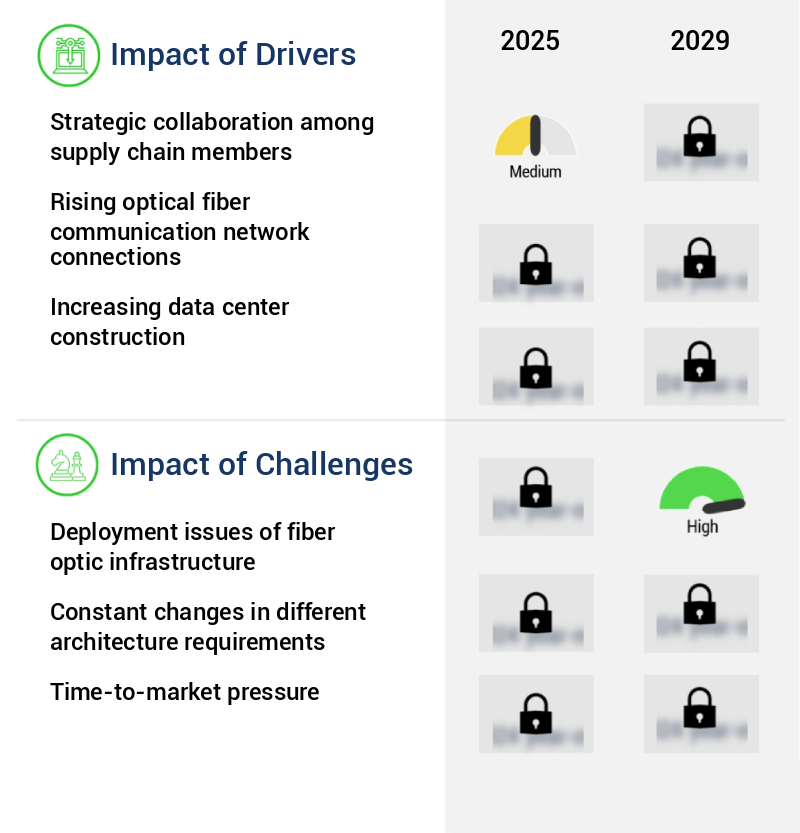
- Strategic collaboration among supply chain members is a crucial factor in driving market growth and success. By working together effectively, these entities can optimize operations, improve efficiency, and enhance customer satisfaction. This collaborative approach enables the supply chain to respond more quickly to market demands and mitigate risks, ultimately contributing to a thriving industry.
- The Internet of Things (IoT) market's continuous expansion fuels the increasing demand for higher bandwidths. This need arises from the proliferation of data and video traffic, as well as enterprise IP/Internet traffic. In response, supply chain members collaborate to develop common standards for optical transceivers, catering to the evolving requirements of next-generation data centers. For instance, the All-Optical Campus Industry Summit in Beijing introduced the Optical Network Alliance (ONA). Founding members include Yangtze Optical Fibre and Cable Joint Stock Ltd. Co., Huawei Technologies Co. Ltd., Digital China Group Co. Ltd., Nokia Shanghai Bell Co. Ltd., and China Overseas Property Holdings Ltd.
- Another significant development is the Light Communications Alliance (LCA), established by major players in the communication, lighting, infrastructure, and device-manufacturing industries. Their objective is to promote new wireless technologies enabling Light Communications (LT), which could potentially revolutionize the way data is transmitted. These strategic collaborations underscore the dynamic nature of the market and the ongoing efforts to address the evolving demands of various sectors.
What are the market trends shaping the Optical Transceiver Industry?
- The trend in the market is toward the migration of Optical Transport Networks (OTNs) to Wavelength Division Multiplexing (WDM) architecture.
A growing number of organizations are adopting WDM technology for their OTN systems.
- Wavelength-division multiplexing (WDM) technology has emerged as a significant trend in the optical transport network (OTN) market, with carriers increasingly adopting dense WDM (DWDM) systems. DWDM enables carriers to tap into vast capacity by transmitting multiple wavelengths over a single optical fiber, leading to substantial cost savings. This technology gains prominence in areas where space for cable installation is limited. The advantages of DWDM extend beyond capacity expansion. It offers fault detection, performance monitoring, and wavelength isolation, ensuring reliable and efficient network operations. By carrying multiple services on a single fiber, DWDM reduces the need for deploying multiple networks, thereby simplifying network management and lowering operational costs.
- The shift from SONET technology to WDM architecture has been a strategic move for carriers, enabling them to cater to the growing demand for high-bandwidth services while optimizing their network infrastructure. The ongoing evolution of WDM technology is expected to bring further advancements, including the integration of software-defined networking (SDN) and network functions virtualization (NFV) to enhance network agility and flexibility. In conclusion, the adoption of DWDM technology by carriers represents a pivotal development in the OTN market, offering substantial benefits in terms of capacity, cost savings, and network efficiency. The ongoing innovation in WDM technology is set to redefine the landscape of optical transport networks, providing new opportunities for carriers to cater to the evolving demands of their customers.
What challenges does the Optical Transceiver Industry face during its growth?
- Fiber optic infrastructure deployment issues represent a significant challenge to the industry's growth. This challenge stems from the complexities involved in laying and maintaining the intricate fiber optic networks required for reliable and high-speed data transmission. Addressing these deployment issues is crucial for driving advancements and innovation within the industry.
- The multi-dwelling unit (MDU) market in communication services presents a significant growth opportunity, with fiber optic deployment being a key focus. However, deploying fiber in MDUs, such as apartments and condominiums, poses unique challenges. Engineering issues, including space constraints and the presence of multiple cable networks, increase installation time and project costs. Creating conduits, pulling fiber above ceilings, and making pathways within walls can lead to bottlenecks, particularly in brownfield MDUs. According to industry reports, fiber installation in MDUs can take up to 50% longer than in single-family homes due to these complexities.
- These challenges necessitate innovative solutions, such as microtrenching and the use of pre-terminated fiber optic cables, to streamline the deployment process and reduce costs. Despite these hurdles, the ongoing evolution of communication technologies and the increasing demand for high-speed internet access in MDUs ensure a dynamic and continuously unfolding market landscape.
Exclusive Customer Landscape
The optical transceiver market forecasting report includes the adoption lifecycle of the market, covering from the innovator’s stage to the laggard’s stage. It focuses on adoption rates in different regions based on penetration. Furthermore, the optical transceiver market report also includes key purchase criteria and drivers of price sensitivity to help companies evaluate and develop their market growth analysis strategies.

Customer Landscape of Optical Transceiver Industry
Competitive Landscape & Market Insights
Companies are implementing various strategies, such as strategic alliances, optical transceiver market forecast, partnerships, mergers and acquisitions, geographical expansion, and product/service launches, to enhance their presence in the industry.
Amphenol Corp. - This company specializes in providing a range of optical transceivers, including Octal small form factor pluggable OSFP and QSFP modules, as well as Small form factor pluggable SFP28 and SFP+ modules. These advanced transceivers facilitate efficient and high-speed data transmission in various networking applications.
The industry research and growth report includes detailed analyses of the competitive landscape of the market and information about key companies, including:
- Amphenol Corp.
- Applied Optoelectronics Inc.
- Broadcom Inc.
- CBO GmbH
- Ciena Corp.
- Fabrinet
- Firecomms Ltd.
- FS.COM Inc.
- Fujikura Co. Ltd.
- Furukawa Electric Co. Ltd.
- II VI Inc.
- Koch Industries Inc.
- Lumentum Holdings Inc.
- Murata Manufacturing Co. Ltd.
- Phoenix Contact GmbH and Co. KG
- Shaoxing ZKTel Equipment Co. Ltd.
- Smartoptics AS
- Source Photonics
- Sumitomo Electric Industries Ltd.
- Texas Instruments Inc.
Qualitative and quantitative analysis of companies has been conducted to help clients understand the wider business environment as well as the strengths and weaknesses of key industry players. Data is qualitatively analyzed to categorize companies as pure play, category-focused, industry-focused, and diversified; it is quantitatively analyzed to categorize companies as dominant, leading, strong, tentative, and weak.
Recent Development and News in Optical Transceiver Market
- In January 2024, Cisco Systems, a leading networking technology company, announced the launch of its new series of optical transceivers, the Cisco ONS 15454 Advanced Enterprise SFP+ and QSFP+ Transceivers, designed to deliver increased power efficiency and improved performance for data center applications (Cisco Press Release).
- In March 2024, Finisar Corporation, a global supplier of optical components and subsystems, entered into a strategic partnership with Microsoft to collaborate on the development and manufacturing of custom optical transceivers for Microsoft's data centers, aiming to enhance the efficiency and capacity of Microsoft's cloud services (Microsoft News Center).
- In May 2024, Lumentum Holdings Inc., a leading provider of optical and photonic technology components for various markets, completed the acquisition of Oclaro Inc., a manufacturer of optical communications components and modules, to expand its product portfolio and strengthen its position in the market (Lumentum Press Release).
- In April 2025, the European Union's Executive European Commission approved the Horizon Europe research and innovation program, which includes a €1.2 billion investment in the development of advanced optical technologies, including optical transceivers, to support the European digital single market and the development of 6G networks (European Commission Press Release).
Dive into Technavio’s robust research methodology, blending expert interviews, extensive data synthesis, and validated models for unparalleled Optical Transceiver Market insights. See full methodology.
Market Scope
|
Report Coverage
|
Details
|
Page number
|
202
|
Base year
|
2024
|
Historic period
|
2019-2023 |
Forecast period
|
2025-2029
|
Growth momentum & CAGR
|
Accelerate at a CAGR of 17.5%
|
Market growth 2025-2029
|
USD 12558.3 million
|
Market structure
|
Fragmented
|
YoY growth 2024-2025(%)
|
14.9
|
Key countries
|
US, Canada, Germany, UK, Italy, France, China, India, Japan, Brazil, Egypt, UAE, Oman, Argentina, and KSA
|
Competitive landscape
|
Leading Companies, Market Positioning of Companies, Competitive Strategies, and Industry Risks
|
Request Free Sample
Research Analyst Overview
- In the dynamic and evolving landscape of optical communication, the market showcases continuous advancements and shifting trends. Long-haul transmission systems dominate the scene, with optical amplifier types playing a pivotal role in extending reach and mitigating nonlinear effects. Integrated photonics circuits are gaining traction due to their potential for miniaturization and cost reduction. Metro access networks witness increased adoption of receiver sensitivity analysis and advanced optical fiber types, ensuring optimal transmitter output power and reliable optical interconnect solutions. The importance of optical reach extension is underscored by the growing demand for high-capacity transmission and the impact of four-wave mixing on fiber optic communication.
- Forward error correction and modulation bandwidth limitations are key considerations in maintaining error vector magnitude and achieving high-speed data links. Chromatic dispersion effects and stimulated Brillouin scattering are ongoing challenges, requiring system latency reduction through advanced optical transponder technology and digital signal processing. Dense wavelength division multiplexing network architecture and polarization mode dispersion are essential aspects of optical dispersion compensation in coherent optical transmission. Wavelength division multiplexing and optical dispersion compensation are crucial for data center interconnects, with spectral efficiency metrics and optical modulation formats shaping the future of this market. Optical signal regeneration and high-speed data links are driving the need for advanced technologies such as coherent detection schemes and fiber Bragg gratings.
- Silicon photonics integration and optical interconnect solutions are poised to revolutionize the industry, offering promising solutions for the ever-growing demand for efficient and scalable optical communication systems.
What are the Key Data Covered in this Optical Transceiver Market Research and Growth Report?
-
What is the expected growth of the Optical Transceiver Market between 2025 and 2029?
-
What segmentation does the market report cover?
-
The report segmented by End-user (Datacom, Telecom, and Enterprise), Fiber Type (Singlemode fiber and Multi mode fiber), Geography (APAC, North America, Europe, South America, and Middle East and Africa), Form Factor (SFF and SFP, SFP+ and SFP28, QSFP, QSFP+, QSFP-DD, QSFP28, and QSFP56, CFP, CFP2, CFP4, and CFP8, XFP, CXP, SFF and SFP, SFP+ and SFP28, QSFP, QSFP+, QSFP-DD, QSFP28, and QSFP56, CFP, CFP2, CFP4, and CFP8, XFP, and CXP), Connector (LC, SC, MPO, RJ-45, LC, SC, MPO, and RJ-45), Data Rate (Less than 10 Gbps, 10 Gbps to 40 Gbps, 40 Gbps to 100 Gbps, Greater than 100 Gbps, Less than 10 Gbps, 10 Gbps to 40 Gbps, 40 Gbps to 100 Gbps, and Greater than 100 Gbps), and Distance (Short Range (up to 1 km), Medium Range (1 km to 10 km), Long Range (10 km to 40 km), Extended Range (Above 40 km), Short Range (up to 1 km), Medium Range (1 km to 10 km), Long Range (10 km to 40 km), and Extended Range (Above 40 km))
-
Which regions are analyzed in the report?
-
APAC, North America, Europe, South America, and Middle East and Africa
-
What are the key growth drivers and market challenges?
-
Who are the major players in the Optical Transceiver Market?
-
Key Companies Amphenol Corp., Applied Optoelectronics Inc., Broadcom Inc., CBO GmbH, Ciena Corp., Fabrinet, Firecomms Ltd., FS.COM Inc., Fujikura Co. Ltd., Furukawa Electric Co. Ltd., II VI Inc., Koch Industries Inc., Lumentum Holdings Inc., Murata Manufacturing Co. Ltd., Phoenix Contact GmbH and Co. KG, Shaoxing ZKTel Equipment Co. Ltd., Smartoptics AS, Source Photonics, Sumitomo Electric Industries Ltd., and Texas Instruments Inc.
Market Research Insights
- The market encompasses a diverse range of components essential for high-speed data transmission in fiber-optic networks. Two key areas of innovation are dispersion management systems and manufacturing tolerances. Dispersion management systems mitigate signal distortion caused by chromatic and polarization mode dispersion, ensuring reliable data transmission. Manufacturing tolerances, on the other hand, impact the precision of transceiver components, influencing their performance and compatibility with various network architectures. For instance, a modern optical transceiver may exhibit a manufacturing tolerance of ±0.1 nm for laser diode wavelength, while a next-generation transceiver might achieve a tighter tolerance of ±0.05 nm. This improvement in manufacturing tolerances can lead to enhanced signal quality and increased network capacity.
- Moreover, tunable laser technology, eye diagram assessment, nonlinearity compensation, and PMD compensation techniques are crucial elements in transceiver design, contributing to optimal optical filter performance, power consumption efficiency, and network jitter performance. These advancements underscore the continuous evolution of the market, with ongoing efforts to optimize link budgets, implement FEC codes, and design thermal management systems for improved system availability.
We can help! Our analysts can customize this optical transceiver market research report to meet your requirements.
Get in touch
1 Executive Summary
- 1.1 Market overview
- Executive Summary - Chart on Market Overview
- Executive Summary - Data Table on Market Overview
- Executive Summary - Chart on Global Market Characteristics
- Executive Summary - Chart on Market by Geography
- Executive Summary - Chart on Market Segmentation by End-user
- Executive Summary - Chart on Market Segmentation by Fiber Type
- Executive Summary - Chart on Incremental Growth
- Executive Summary - Data Table on Incremental Growth
- Executive Summary - Chart on Company Market Positioning
2 Technavio Analysis
- 2.1 Analysis of price sensitivity, lifecycle, customer purchase basket, adoption rates, and purchase criteria
- Analysis of price sensitivity, lifecycle, customer purchase basket, adoption rates, and purchase criteria
- 2.2 Criticality of inputs and Factors of differentiation
- Overview on criticality of inputs and factors of differentiation
- 2.3 Factors of disruption
- Overview on factors of disruption
- 2.4 Impact of drivers and challenges
- Impact of drivers and challenges in 2024 and 2029
3 Market Landscape
- 3.1 Market ecosystem
- Parent Market
- Data Table on - Parent Market
- 3.2 Market characteristics
- Market characteristics analysis
4 Market Sizing
- 4.1 Market definition
- Offerings of companies included in the market definition
- 4.2 Market segment analysis
- 4.4 Market outlook: Forecast for 2024-2029
- Chart on Global - Market size and forecast 2024-2029 ($ million)
- Data Table on Global - Market size and forecast 2024-2029 ($ million)
- Chart on Global Market: Year-over-year growth 2024-2029 (%)
- Data Table on Global Market: Year-over-year growth 2024-2029 (%)
5 Historic Market Size
- 5.1 Global Optical Transceiver Market 2019 - 2023
- Historic Market Size - Data Table on Global Optical Transceiver Market 2019 - 2023 ($ million)
- 5.2 End-user segment analysis 2019 - 2023
- Historic Market Size - End-user Segment 2019 - 2023 ($ million)
- 5.3 Fiber Type segment analysis 2019 - 2023
- Historic Market Size - Fiber Type Segment 2019 - 2023 ($ million)
- 5.4 Geography segment analysis 2019 - 2023
- Historic Market Size - Geography Segment 2019 - 2023 ($ million)
- 5.5 Country segment analysis 2019 - 2023
- Historic Market Size - Country Segment 2019 - 2023 ($ million)
6 Qualitative Analysis
- 6.1 Impact of AI on global optical transceiver market
7 Five Forces Analysis
- 7.1 Five forces summary
- Five forces analysis - Comparison between 2024 and 2029
- 7.2 Bargaining power of buyers
- Bargaining power of buyers - Impact of key factors 2024 and 2029
- 7.3 Bargaining power of suppliers
- Bargaining power of suppliers - Impact of key factors in 2024 and 2029
- 7.4 Threat of new entrants
- Threat of new entrants - Impact of key factors in 2024 and 2029
- 7.5 Threat of substitutes
- Threat of substitutes - Impact of key factors in 2024 and 2029
- 7.6 Threat of rivalry
- Threat of rivalry - Impact of key factors in 2024 and 2029
- 7.7 Market condition
- Chart on Market condition - Five forces 2024 and 2029
8 Market Segmentation by End-user
- 8.1 Market segments
- Chart on End-user - Market share 2024-2029 (%)
- Data Table on End-user - Market share 2024-2029 (%)
- 8.2 Comparison by End-user
- Chart on Comparison by End-user
- Data Table on Comparison by End-user
- 8.3 Datacom - Market size and forecast 2024-2029
- Chart on Datacom - Market size and forecast 2024-2029 ($ million)
- Data Table on Datacom - Market size and forecast 2024-2029 ($ million)
- Chart on Datacom - Year-over-year growth 2024-2029 (%)
- Data Table on Datacom - Year-over-year growth 2024-2029 (%)
- 8.4 Telecom - Market size and forecast 2024-2029
- Chart on Telecom - Market size and forecast 2024-2029 ($ million)
- Data Table on Telecom - Market size and forecast 2024-2029 ($ million)
- Chart on Telecom - Year-over-year growth 2024-2029 (%)
- Data Table on Telecom - Year-over-year growth 2024-2029 (%)
- 8.5 Enterprise - Market size and forecast 2024-2029
- Chart on Enterprise - Market size and forecast 2024-2029 ($ million)
- Data Table on Enterprise - Market size and forecast 2024-2029 ($ million)
- Chart on Enterprise - Year-over-year growth 2024-2029 (%)
- Data Table on Enterprise - Year-over-year growth 2024-2029 (%)
- 8.6 Market opportunity by End-user
- Market opportunity by End-user ($ million)
- Data Table on Market opportunity by End-user ($ million)
9 Market Segmentation by Fiber Type
- 9.1 Market segments
- Chart on Fiber Type - Market share 2024-2029 (%)
- Data Table on Fiber Type - Market share 2024-2029 (%)
- 9.2 Comparison by Fiber Type
- Chart on Comparison by Fiber Type
- Data Table on Comparison by Fiber Type
- 9.3 Singlemode fiber - Market size and forecast 2024-2029
- Chart on Singlemode fiber - Market size and forecast 2024-2029 ($ million)
- Data Table on Singlemode fiber - Market size and forecast 2024-2029 ($ million)
- Chart on Singlemode fiber - Year-over-year growth 2024-2029 (%)
- Data Table on Singlemode fiber - Year-over-year growth 2024-2029 (%)
- 9.4 Multi mode fiber - Market size and forecast 2024-2029
- Chart on Multi mode fiber - Market size and forecast 2024-2029 ($ million)
- Data Table on Multi mode fiber - Market size and forecast 2024-2029 ($ million)
- Chart on Multi mode fiber - Year-over-year growth 2024-2029 (%)
- Data Table on Multi mode fiber - Year-over-year growth 2024-2029 (%)
- 9.5 Market opportunity by Fiber Type
- Market opportunity by Fiber Type ($ million)
- Data Table on Market opportunity by Fiber Type ($ million)
10 Market Segmentation by Form Factor
- 10.1 Market segments
- Chart on Form Factor - Market share (2024-2029) (%)
- Data Table on Form Factor - Market share (2024-2029) (%)
- 10.2 Comparison by Form Factor
- Chart on Comparison by Form Factor
- Data Table on Comparison by Form Factor
- 10.3 SFF and SFP - Market size and forecast (2024-2029)
- Chart on SFF and SFP - Market size and forecast (2024-2029) ($ million)
- Data Table on SFF and SFP - Market size and forecast (2024-2029) ($ million)
- Chart on SFF and SFP - Year-over-year growth (2024-2029) (%)
- Data Table on SFF and SFP - Year-over-year growth (2024-2029) (%)
- 10.4 SFP+ and SFP28 - Market size and forecast (2024-2029)
- Chart on SFP+ and SFP28 - Market size and forecast (2024-2029) ($ million)
- Data Table on SFP+ and SFP28 - Market size and forecast (2024-2029) ($ million)
- Chart on SFP+ and SFP28 - Year-over-year growth (2024-2029) (%)
- Data Table on SFP+ and SFP28 - Year-over-year growth (2024-2029) (%)
- 10.5 QSFP, QSFP+, QSFP-DD, QSFP28, and QSFP56 - Market size and forecast (2024-2029)
- Chart on QSFP, QSFP+, QSFP-DD, QSFP28, and QSFP56 - Market size and forecast (2024-2029) ($ million)
- Data Table on QSFP, QSFP+, QSFP-DD, QSFP28, and QSFP56 - Market size and forecast (2024-2029) ($ million)
- Chart on QSFP, QSFP+, QSFP-DD, QSFP28, and QSFP56 - Year-over-year growth (2024-2029) (%)
- Data Table on QSFP, QSFP+, QSFP-DD, QSFP28, and QSFP56 - Year-over-year growth (2024-2029) (%)
- 10.6 CFP, CFP2, CFP4, and CFP8 - Market size and forecast (2024-2029)
- Chart on CFP, CFP2, CFP4, and CFP8 - Market size and forecast (2024-2029) ($ million)
- Data Table on CFP, CFP2, CFP4, and CFP8 - Market size and forecast (2024-2029) ($ million)
- Chart on CFP, CFP2, CFP4, and CFP8 - Year-over-year growth (2024-2029) (%)
- Data Table on CFP, CFP2, CFP4, and CFP8 - Year-over-year growth (2024-2029) (%)
- 10.7 XFP - Market size and forecast (2024-2029)
- Chart on XFP - Market size and forecast (2024-2029) ($ million)
- Data Table on XFP - Market size and forecast (2024-2029) ($ million)
- Chart on XFP - Year-over-year growth (2024-2029) (%)
- Data Table on XFP - Year-over-year growth (2024-2029) (%)
- 10.8 CXP - Market size and forecast (2024-2029)
- Chart on CXP - Market size and forecast (2024-2029) ($ million)
- Data Table on CXP - Market size and forecast (2024-2029) ($ million)
- Chart on CXP - Year-over-year growth (2024-2029) (%)
- Data Table on CXP - Year-over-year growth (2024-2029) (%)
- 10.9 Market opportunity by Form Factor
- Market opportunity by $segment_name ($ million)
- Data Table on Market opportunity by $segment_name ($ million)
11 Market Segmentation by Connector
- 11.1 Market segments
- Chart on Connector - Market share (2024-2029) (%)
- Data Table on Connector - Market share (2024-2029) (%)
- 11.2 Comparison by Connector
- Chart on Comparison by Connector
- Data Table on Comparison by Connector
- 11.3 LC - Market size and forecast (2024-2029)
- Chart on LC - Market size and forecast (2024-2029) ($ million)
- Data Table on LC - Market size and forecast (2024-2029) ($ million)
- Chart on LC - Year-over-year growth (2024-2029) (%)
- Data Table on LC - Year-over-year growth (2024-2029) (%)
- 11.4 SC - Market size and forecast (2024-2029)
- Chart on SC - Market size and forecast (2024-2029) ($ million)
- Data Table on SC - Market size and forecast (2024-2029) ($ million)
- Chart on SC - Year-over-year growth (2024-2029) (%)
- Data Table on SC - Year-over-year growth (2024-2029) (%)
- 11.5 MPO - Market size and forecast (2024-2029)
- Chart on MPO - Market size and forecast (2024-2029) ($ million)
- Data Table on MPO - Market size and forecast (2024-2029) ($ million)
- Chart on MPO - Year-over-year growth (2024-2029) (%)
- Data Table on MPO - Year-over-year growth (2024-2029) (%)
- 11.6 RJ-45 - Market size and forecast (2024-2029)
- Chart on RJ-45 - Market size and forecast (2024-2029) ($ million)
- Data Table on RJ-45 - Market size and forecast (2024-2029) ($ million)
- Chart on RJ-45 - Year-over-year growth (2024-2029) (%)
- Data Table on RJ-45 - Year-over-year growth (2024-2029) (%)
- 11.7 Market opportunity by Connector
- Market opportunity by $segment_name ($ million)
- Data Table on Market opportunity by $segment_name ($ million)
12 Market Segmentation by Data Rate
- 12.1 Market segments
- Chart on Data Rate - Market share (2024-2029) (%)
- Data Table on Data Rate - Market share (2024-2029) (%)
- 12.2 Comparison by Data Rate
- Chart on Comparison by Data Rate
- Data Table on Comparison by Data Rate
- 12.3 Less than 10 Gbps - Market size and forecast (2024-2029)
- Chart on Less than 10 Gbps - Market size and forecast (2024-2029) ($ million)
- Data Table on Less than 10 Gbps - Market size and forecast (2024-2029) ($ million)
- Chart on Less than 10 Gbps - Year-over-year growth (2024-2029) (%)
- Data Table on Less than 10 Gbps - Year-over-year growth (2024-2029) (%)
- 10 Gbps to 40 Gbps - Market size and forecast (2024-2029)
- Chart on 10 Gbps to 40 Gbps - Market size and forecast (2024-2029) ($ million)
- Data Table on 10 Gbps to 40 Gbps - Market size and forecast (2024-2029) ($ million)
- Chart on 10 Gbps to 40 Gbps - Year-over-year growth (2024-2029) (%)
- Data Table on 10 Gbps to 40 Gbps - Year-over-year growth (2024-2029) (%)
- 40 Gbps to 100 Gbps - Market size and forecast (2024-2029)
- Chart on 40 Gbps to 100 Gbps - Market size and forecast (2024-2029) ($ million)
- Data Table on 40 Gbps to 100 Gbps - Market size and forecast (2024-2029) ($ million)
- Chart on 40 Gbps to 100 Gbps - Year-over-year growth (2024-2029) (%)
- Data Table on 40 Gbps to 100 Gbps - Year-over-year growth (2024-2029) (%)
- 12.6 Greater than 100 Gbps - Market size and forecast (2024-2029)
- Chart on Greater than 100 Gbps - Market size and forecast (2024-2029) ($ million)
- Data Table on Greater than 100 Gbps - Market size and forecast (2024-2029) ($ million)
- Chart on Greater than 100 Gbps - Year-over-year growth (2024-2029) (%)
- Data Table on Greater than 100 Gbps - Year-over-year growth (2024-2029) (%)
- 12.7 Market opportunity by Data Rate
- Market opportunity by $segment_name ($ million)
- Data Table on Market opportunity by $segment_name ($ million)
13 Market Segmentation by Distance
- 13.1 Market segments
- Chart on Distance - Market share (2024-2029) (%)
- Data Table on Distance - Market share (2024-2029) (%)
- 13.2 Comparison by Distance
- Chart on Comparison by Distance
- Data Table on Comparison by Distance
- 13.3 Short Range (up to 1 km) - Market size and forecast (2024-2029)
- Chart on Short Range (up to 1 km) - Market size and forecast (2024-2029) ($ million)
- Data Table on Short Range (up to 1 km) - Market size and forecast (2024-2029) ($ million)
- Chart on Short Range (up to 1 km) - Year-over-year growth (2024-2029) (%)
- Data Table on Short Range (up to 1 km) - Year-over-year growth (2024-2029) (%)
- 13.4 Medium Range (1 km to 10 km) - Market size and forecast (2024-2029)
- Chart on Medium Range (1 km to 10 km) - Market size and forecast (2024-2029) ($ million)
- Data Table on Medium Range (1 km to 10 km) - Market size and forecast (2024-2029) ($ million)
- Chart on Medium Range (1 km to 10 km) - Year-over-year growth (2024-2029) (%)
- Data Table on Medium Range (1 km to 10 km) - Year-over-year growth (2024-2029) (%)
- 13.5 Long Range (10 km to 40 km) - Market size and forecast (2024-2029)
- Chart on Long Range (10 km to 40 km) - Market size and forecast (2024-2029) ($ million)
- Data Table on Long Range (10 km to 40 km) - Market size and forecast (2024-2029) ($ million)
- Chart on Long Range (10 km to 40 km) - Year-over-year growth (2024-2029) (%)
- Data Table on Long Range (10 km to 40 km) - Year-over-year growth (2024-2029) (%)
- 13.6 Extended Range (Above 40 km) - Market size and forecast (2024-2029)
- Chart on Extended Range (Above 40 km) - Market size and forecast (2024-2029) ($ million)
- Data Table on Extended Range (Above 40 km) - Market size and forecast (2024-2029) ($ million)
- Chart on Extended Range (Above 40 km) - Year-over-year growth (2024-2029) (%)
- Data Table on Extended Range (Above 40 km) - Year-over-year growth (2024-2029) (%)
- 13.7 Market opportunity by Distance
- Market opportunity by $segment_name ($ million)
- Data Table on Market opportunity by $segment_name ($ million)
14 Customer Landscape
- 14.1 Customer landscape overview
- Analysis of price sensitivity, lifecycle, customer purchase basket, adoption rates, and purchase criteria
15 Geographic Landscape
- 15.1 Italy - Market size and forecast (2024-2029)
- Chart on Italy - Market size and forecast (2024-2029) ($ million)
- Data Table on Italy - Market size and forecast (2024-2029) ($ million)
- Chart on Italy - Year-over-year growth (2024-2029) (%)
- Data Table on Italy - Year-over-year growth (2024-2029) (%)
- Chart on Market share by geography 2024-2029 (%)
- Data Table on Market share by geography 2024-2029 (%)
- 15.2 Japan - Market size and forecast (2024-2029)
- Chart on Japan - Market size and forecast (2024-2029) ($ million)
- Data Table on Japan - Market size and forecast (2024-2029) ($ million)
- Chart on Japan - Year-over-year growth (2024-2029) (%)
- Data Table on Japan - Year-over-year growth (2024-2029) (%)
- Chart on Geographic comparison
- Data Table on Geographic comparison
- 15.3 China - Market size and forecast (2024-2029)
- Chart on China - Market size and forecast (2024-2029) ($ million)
- Data Table on China - Market size and forecast (2024-2029) ($ million)
- Chart on China - Year-over-year growth (2024-2029) (%)
- Data Table on China - Year-over-year growth (2024-2029) (%)
- Chart on APAC - Market size and forecast 2024-2029 ($ million)
- Data Table on APAC - Market size and forecast 2024-2029 ($ million)
- Chart on APAC - Year-over-year growth 2024-2029 (%)
- Data Table on APAC - Year-over-year growth 2024-2029 (%)
- 15.4 India - Market size and forecast (2024-2029)
- Chart on India - Market size and forecast (2024-2029) ($ million)
- Data Table on India - Market size and forecast (2024-2029) ($ million)
- Chart on India - Year-over-year growth (2024-2029) (%)
- Data Table on India - Year-over-year growth (2024-2029) (%)
- Chart on North America - Market size and forecast 2024-2029 ($ million)
- Data Table on North America - Market size and forecast 2024-2029 ($ million)
- Chart on North America - Year-over-year growth 2024-2029 (%)
- Data Table on North America - Year-over-year growth 2024-2029 (%)
- 15.5 Germany - Market size and forecast (2024-2029)
- Chart on Germany - Market size and forecast (2024-2029) ($ million)
- Data Table on Germany - Market size and forecast (2024-2029) ($ million)
- Chart on Germany - Year-over-year growth (2024-2029) (%)
- Data Table on Germany - Year-over-year growth (2024-2029) (%)
- Chart on Europe - Market size and forecast 2024-2029 ($ million)
- Data Table on Europe - Market size and forecast 2024-2029 ($ million)
- Chart on Europe - Year-over-year growth 2024-2029 (%)
- Data Table on Europe - Year-over-year growth 2024-2029 (%)
- 15.6 Canada - Market size and forecast (2024-2029)
- Chart on Canada - Market size and forecast (2024-2029) ($ million)
- Data Table on Canada - Market size and forecast (2024-2029) ($ million)
- Chart on Canada - Year-over-year growth (2024-2029) (%)
- Data Table on Canada - Year-over-year growth (2024-2029) (%)
- Chart on South America - Market size and forecast 2024-2029 ($ million)
- Data Table on South America - Market size and forecast 2024-2029 ($ million)
- Chart on South America - Year-over-year growth 2024-2029 (%)
- Data Table on South America - Year-over-year growth 2024-2029 (%)
- 15.7 UK - Market size and forecast (2024-2029)
- Chart on UK - Market size and forecast (2024-2029) ($ million)
- Data Table on UK - Market size and forecast (2024-2029) ($ million)
- Chart on UK - Year-over-year growth (2024-2029) (%)
- Data Table on UK - Year-over-year growth (2024-2029) (%)
- Chart on Middle East and Africa - Market size and forecast 2024-2029 ($ million)
- Data Table on Middle East and Africa - Market size and forecast 2024-2029 ($ million)
- Chart on Middle East and Africa - Year-over-year growth 2024-2029 (%)
- Data Table on Middle East and Africa - Year-over-year growth 2024-2029 (%)
- 15.8 France - Market size and forecast (2024-2029)
- Chart on France - Market size and forecast (2024-2029) ($ million)
- Data Table on France - Market size and forecast (2024-2029) ($ million)
- Chart on France - Year-over-year growth (2024-2029) (%)
- Data Table on France - Year-over-year growth (2024-2029) (%)
- Chart on US - Market size and forecast 2024-2029 ($ million)
- Data Table on US - Market size and forecast 2024-2029 ($ million)
- Chart on US - Year-over-year growth 2024-2029 (%)
- Data Table on US - Year-over-year growth 2024-2029 (%)
- 15.9 Brazil - Market size and forecast (2024-2029)
- Chart on Brazil - Market size and forecast (2024-2029) ($ million)
- Data Table on Brazil - Market size and forecast (2024-2029) ($ million)
- Chart on Brazil - Year-over-year growth (2024-2029) (%)
- Data Table on Brazil - Year-over-year growth (2024-2029) (%)
- Chart on Japan - Market size and forecast 2024-2029 ($ million)
- Data Table on Japan - Market size and forecast 2024-2029 ($ million)
- Chart on Japan - Year-over-year growth 2024-2029 (%)
- Data Table on Japan - Year-over-year growth 2024-2029 (%)
- 15.10 China - Market size and forecast 2024-2029
- Chart on China - Market size and forecast 2024-2029 ($ million)
- Data Table on China - Market size and forecast 2024-2029 ($ million)
- Chart on China - Year-over-year growth 2024-2029 (%)
- Data Table on China - Year-over-year growth 2024-2029 (%)
- 15.11 India - Market size and forecast 2024-2029
- Chart on India - Market size and forecast 2024-2029 ($ million)
- Data Table on India - Market size and forecast 2024-2029 ($ million)
- Chart on India - Year-over-year growth 2024-2029 (%)
- Data Table on India - Year-over-year growth 2024-2029 (%)
- 15.12 Canada - Market size and forecast 2024-2029
- Chart on Canada - Market size and forecast 2024-2029 ($ million)
- Data Table on Canada - Market size and forecast 2024-2029 ($ million)
- Chart on Canada - Year-over-year growth 2024-2029 (%)
- Data Table on Canada - Year-over-year growth 2024-2029 (%)
- 15.13 Germany - Market size and forecast 2024-2029
- Chart on Germany - Market size and forecast 2024-2029 ($ million)
- Data Table on Germany - Market size and forecast 2024-2029 ($ million)
- Chart on Germany - Year-over-year growth 2024-2029 (%)
- Data Table on Germany - Year-over-year growth 2024-2029 (%)
- 15.14 UK - Market size and forecast 2024-2029
- Chart on UK - Market size and forecast 2024-2029 ($ million)
- Data Table on UK - Market size and forecast 2024-2029 ($ million)
- Chart on UK - Year-over-year growth 2024-2029 (%)
- Data Table on UK - Year-over-year growth 2024-2029 (%)
- 15.15 France - Market size and forecast 2024-2029
- Chart on France - Market size and forecast 2024-2029 ($ million)
- Data Table on France - Market size and forecast 2024-2029 ($ million)
- Chart on France - Year-over-year growth 2024-2029 (%)
- Data Table on France - Year-over-year growth 2024-2029 (%)
- 15.16 Brazil - Market size and forecast 2024-2029
- Chart on Brazil - Market size and forecast 2024-2029 ($ million)
- Data Table on Brazil - Market size and forecast 2024-2029 ($ million)
- Chart on Brazil - Year-over-year growth 2024-2029 (%)
- Data Table on Brazil - Year-over-year growth 2024-2029 (%)
- 15.17 Italy - Market size and forecast 2024-2029
- Chart on Italy - Market size and forecast 2024-2029 ($ million)
- Data Table on Italy - Market size and forecast 2024-2029 ($ million)
- Chart on Italy - Year-over-year growth 2024-2029 (%)
- Data Table on Italy - Year-over-year growth 2024-2029 (%)
- 15.18 Market opportunity by geography
- Market opportunity by geography ($ million)
- Data Tables on Market opportunity by geography ($ million)
- 15.19 US - Market size and forecast (2024-2029)
- Chart on US - Market size and forecast (2024-2029) ($ million)
- Data Table on US - Market size and forecast (2024-2029) ($ million)
- Chart on US - Year-over-year growth (2024-2029) (%)
- Data Table on US - Year-over-year growth (2024-2029) (%)
16 Drivers, Challenges, and Opportunity/Restraints
- 16.3 Impact of drivers and challenges
- Impact of drivers and challenges in 2024 and 2029
- 16.4 Market opportunities/restraints
17 Competitive Landscape
- 17.2 Competitive Landscape
- Overview on criticality of inputs and factors of differentiation
- 17.3 Landscape disruption
- Overview on factors of disruption
- 17.4 Industry risks
- Impact of key risks on business
18 Competitive Analysis
- 18.2 Company ranking index
- 18.3 Market positioning of companies
- Matrix on companies position and classification
- 18.4 Applied Optoelectronics Inc.
- Applied Optoelectronics Inc. - Overview
- Applied Optoelectronics Inc. - Business segments
- Applied Optoelectronics Inc. - Key offerings
- Applied Optoelectronics Inc. - Segment focus
- SWOT
- 18.5 Broadcom Inc.
- Broadcom Inc. - Overview
- Broadcom Inc. - Business segments
- Broadcom Inc. - Key news
- Broadcom Inc. - Key offerings
- Broadcom Inc. - Segment focus
- SWOT
- 18.6 CBO GmbH
- CBO GmbH - Overview
- CBO GmbH - Product / Service
- CBO GmbH - Key offerings
- SWOT
- 18.7 Ciena Corp.
- Ciena Corp. - Overview
- Ciena Corp. - Business segments
- Ciena Corp. - Key offerings
- Ciena Corp. - Segment focus
- SWOT
- 18.8 Fabrinet
- Fabrinet - Overview
- Fabrinet - Product / Service
- Fabrinet - Key offerings
- SWOT
- 18.9 Firecomms Ltd.
- Firecomms Ltd. - Overview
- Firecomms Ltd. - Product / Service
- Firecomms Ltd. - Key offerings
- SWOT
- 18.10 FS.COM Inc.
- FS.COM Inc. - Overview
- FS.COM Inc. - Product / Service
- FS.COM Inc. - Key offerings
- SWOT
- 18.11 Fujikura Co. Ltd.
- Fujikura Co. Ltd. - Overview
- Fujikura Co. Ltd. - Business segments
- Fujikura Co. Ltd. - Key news
- Fujikura Co. Ltd. - Key offerings
- Fujikura Co. Ltd. - Segment focus
- SWOT
- 18.12 Furukawa Electric Co. Ltd.
- Furukawa Electric Co. Ltd. - Overview
- Furukawa Electric Co. Ltd. - Business segments
- Furukawa Electric Co. Ltd. - Key news
- Furukawa Electric Co. Ltd. - Key offerings
- Furukawa Electric Co. Ltd. - Segment focus
- SWOT
- 18.13 II VI Inc.
- II VI Inc. - Overview
- II VI Inc. - Business segments
- II VI Inc. - Key news
- II VI Inc. - Key offerings
- II VI Inc. - Segment focus
- SWOT
- 18.14 Koch Industries Inc.
- Koch Industries Inc. - Overview
- Koch Industries Inc. - Product / Service
- Koch Industries Inc. - Key offerings
- SWOT
- 18.15 Lumentum Holdings Inc.
- Lumentum Holdings Inc. - Overview
- Lumentum Holdings Inc. - Business segments
- Lumentum Holdings Inc. - Key news
- Lumentum Holdings Inc. - Key offerings
- Lumentum Holdings Inc. - Segment focus
- SWOT
- 18.16 Murata Manufacturing Co. Ltd.
- Murata Manufacturing Co. Ltd. - Overview
- Murata Manufacturing Co. Ltd. - Business segments
- Murata Manufacturing Co. Ltd. - Key news
- Murata Manufacturing Co. Ltd. - Key offerings
- Murata Manufacturing Co. Ltd. - Segment focus
- SWOT
- 18.17 Phoenix Contact GmbH and Co. KG
- Phoenix Contact GmbH and Co. KG - Overview
- Phoenix Contact GmbH and Co. KG - Product / Service
- Phoenix Contact GmbH and Co. KG - Key offerings
- SWOT
- 18.18 Shaoxing ZKTel Equipment Co. Ltd.
- Shaoxing ZKTel Equipment Co. Ltd. - Overview
- Shaoxing ZKTel Equipment Co. Ltd. - Product / Service
- Shaoxing ZKTel Equipment Co. Ltd. - Key offerings
- SWOT
19 Appendix
- 19.2 Inclusions and exclusions checklist
- Inclusions checklist
- Exclusions checklist
- 19.3 Currency conversion rates for US$
- Currency conversion rates for US$
- 19.4 Research methodology
- 19.7 Validation techniques employed for market sizing
- Validation techniques employed for market sizing
- 19.9 360 degree market analysis
- 360 degree market analysis
- 19.10 List of abbreviations