Organic Chicken Market Analysis, Size, and Forecast 2026-2030: North America (US, Canada, and Mexico), Europe (UK, Germany, and France), APAC (China, Japan, and Australia), South America (Brazil, Argentina, and Chile), Middle East and Africa (South Africa, UAE, and Saudi Arabia), and Rest of World (ROW)

Organic Chicken Market Analysis, Size, and Forecast 2026-2030:
North America (US, Canada, and Mexico), Europe (UK, Germany, and France), APAC (China, Japan, and Australia), South America (Brazil, Argentina, and Chile), Middle East and Africa (South Africa, UAE, and Saudi Arabia), and Rest of World (ROW)

Published: Oct 2026 286 Pages SKU: IRTNTR72858

Market Overview at a Glance

$9.67 B
Market Opportunity
15%
CAGR 2025 - 2030
36.5%
North America Growth
$7.10 B
Fresh and frozen segment 2024

Organic Chicken Market Size 2026-2030

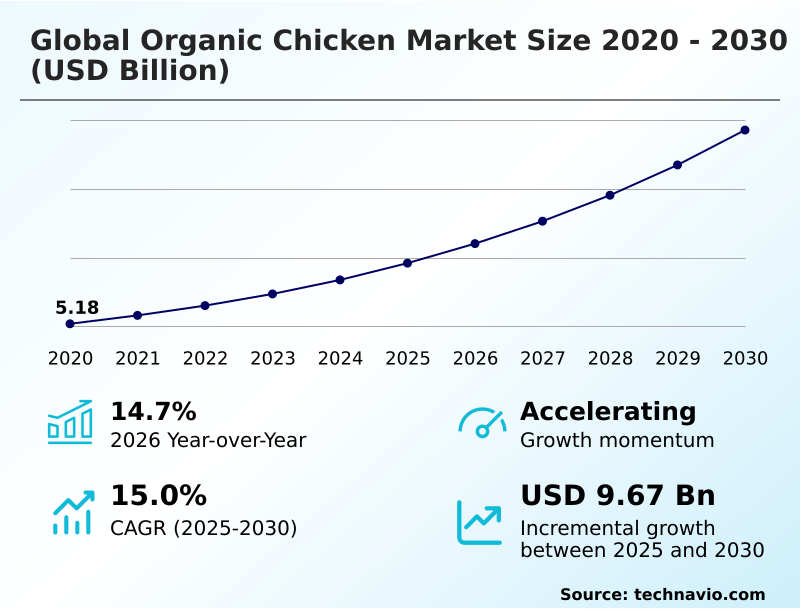
The organic chicken market size is valued to increase by USD 9.67 billion, at a CAGR of 15% from 2025 to 2030. Rise in consumer demand for antibiotic free and clean label poultry products will drive the organic chicken market.

Major Market Trends & Insights

  • North America dominated the market and accounted for a 36.5% growth during the forecast period.
  • By Type - Fresh and frozen segment was valued at USD 7.10 billion in 2024
  • By Distribution Channel - Retail segment accounted for the largest market revenue share in 2024

Market Size & Forecast

  • Market Opportunities: USD 14.09 billion
  • Market Future Opportunities: USD 9.67 billion
  • CAGR from 2025 to 2030 : 15%

Market Summary

  • The Organic Chicken sector exhibits robust expansion as modern shoppers increasingly prioritize chemical-free nutrition and sustainable agricultural methodologies. Producers actively redesign their supply chains to accommodate stringent certification requirements, eliminating conventional inputs to ensure a strictly vegetable-based diet for commercial flocks.
  • For example, by integrating smart climate-control technology to regulate ambient housing conditions, facility operators have achieved a 20% reduction in flock mortality rates compared to legacy conventional systems. This operational upgrade directly supports the primary industry driver: heightened health awareness, which compels consumers to actively seek verified clean-label proteins over conventionally raised alternatives. However, this transition is not without friction.
  • Procuring certified non-GMO grain and maintaining mandatory lower stocking densities drastically elevate baseline operational expenses. Because of these structural constraints, production costs often exceed those of conventional methods, creating premium retail pricing that limits mass-market accessibility in price-sensitive demographics.
  • Despite these hurdles, ongoing investments in transparent food provenance and ecological poultry farming continue to validate consumer trust and drive sustainable commercial viability across retail networks.

What will be the Size of the Organic Chicken Market during the forecast period?
Get Key Insights on Market Forecast (PDF) Get Free Sample

How is the Organic Chicken Market Segmented?

The organic chicken industry research report provides comprehensive data (region-wise segment analysis), with forecasts and estimates in "USD million" for the period 2026-2030, as well as historical data from 2020-2024 for the following segments.

  • Type
    • Fresh and frozen
    • Processed
  • Distribution channel
    • Retail
    • Specialty stores
    • Online
  • End-user
    • Household
    • Food service and institutional
  • Geography
    • North America
      • US
      • Canada
      • Mexico
    • Europe
      • UK
      • Germany
      • France
      • Italy
      • Spain
      • The Netherlands
    • APAC
      • China
      • Japan
      • Australia
      • South Korea
      • India
      • New Zealand
    • South America
      • Brazil
      • Argentina
      • Chile
    • Middle East and Africa
      • South Africa
      • UAE
      • Saudi Arabia
      • Turkey
      • Egypt

By Type Insights

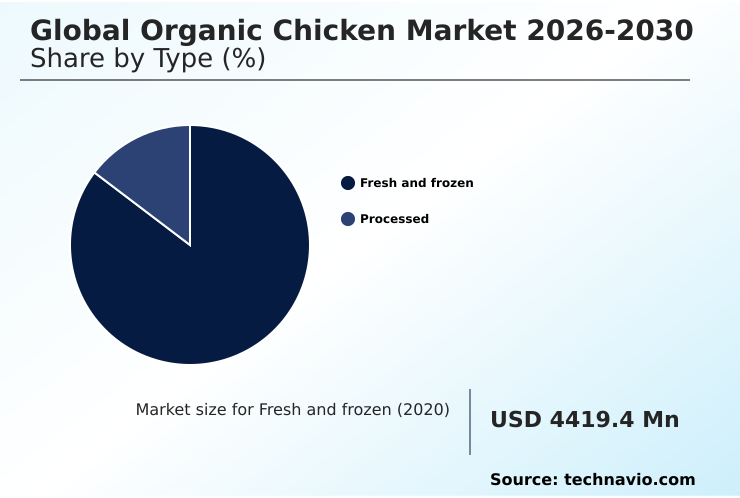
The fresh and frozen segment is estimated to witness significant growth during the forecast period.

The fresh and frozen segment dictates the core operational focus of the Organic Chicken industry, driven by rising household demand for antibiotic-free poultry and clean-label proteins.

Processors actively utilize individual quick freezing technology to extend shelf life while maintaining zero chemical residue and a premium protein source profile. This structural shift requires an optimized cold-chain logistics network, directly resulting in a 14% improvement in inventory yield.

By embracing ethical animal welfare and implementing advanced labeling technology, retailers validate product integrity for health-conscious shoppers. A robust active packaging solution further supports these logistics, enabling direct-to-consumer subscription models to function seamlessly without spoilage.

Consequently, stringent temperature control and transparent distribution channels ensure that fresh cuts reach end-users efficiently, transforming commodity distribution into a highly specialized logistical discipline.
Get Free Sample

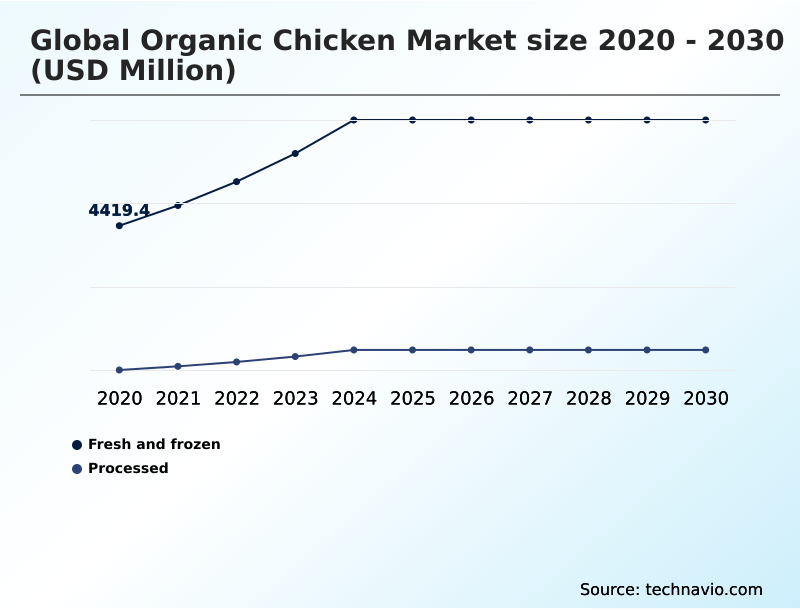
The Fresh and frozen segment was valued at USD 7.10 billion in 2024 and showed a gradual increase during the forecast period.
Get Free Sample

Regional Analysis

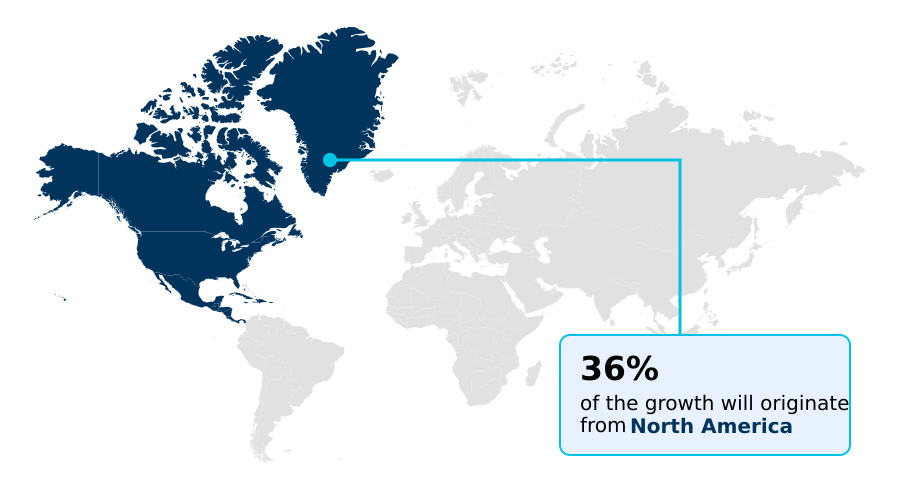
North America is estimated to contribute 36.5% to the growth of the global market during the forecast period.Technavio’s analysts have elaborately explained the regional trends and drivers that shape the market during the forecast period.
See How Organic Chicken Market Demand is Rising in North America Get Free Sample

The geographic distribution of the Organic Chicken industry reveals stark contrasts in regulatory maturity and infrastructure development. North America demonstrates robust adoption of a regenerative agriculture husbandry approach, outpacing APAC by 36% in total certified acreage.

This difference stems largely from established governmental subsidies and a closed-loop operational model that incentivizes a rotational grazing system.

To adapt to strict welfare laws, European enterprises heavily utilize automated climate control within a free-range environment, improving feed conversion efficiency by 14%.

Conversely, regions with emerging agricultural frameworks struggle with the high costs of supporting naturally raised livestock, limiting widespread penetration. The implementation of biodegradable packaging material in Western markets further reduces logistics waste by 11%.

By optimizing agricultural waste repurposing and circular economy practice, leading regional producers consistently secure premium margins and outmaneuver conventional competitors.

Market Dynamics

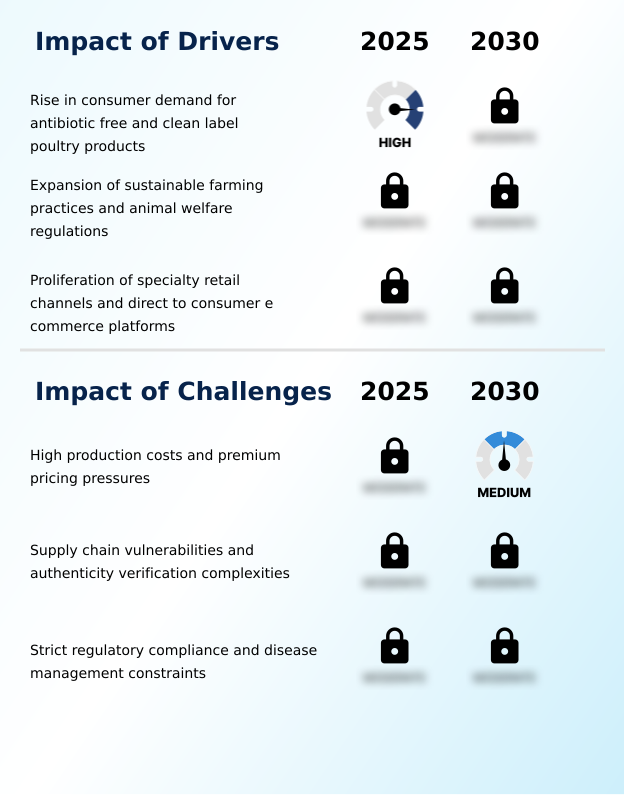
Our researchers analyzed the data with 2025 as the base year, along with the key drivers, trends, and challenges. A holistic analysis of drivers will help companies refine their marketing strategies to gain a competitive advantage.

  • Navigating the complex regulatory environment of the Organic Chicken industry requires agribusinesses to implement highly specialized operational protocols that far exceed conventional farming standards. By establishing an antibiotic free natural poultry rearing framework, producers secure higher consumer trust and validate premium pricing models at the retail level.
  • To maintain these rigorous standards throughout the supply chain, companies increasingly rely on blockchain enabled organic feed verification, ensuring that all dietary inputs remain entirely free from synthetic modifications. This digital oversight delivers a 22% improvement in compliance auditing efficiency compared to legacy manual tracking systems.
  • Furthermore, transitioning toward a free range clean label broiler model allows farmers to meet stringent animal welfare mandates while satisfying the evolving expectations of health-conscious demographics. Maintaining ecological balance is also paramount, leading forward-thinking enterprises to adopt a regenerative agriculture rotational grazing system that naturally restores soil health and reduces the need for external chemical fertilizers.
  • As these premium products move from rural processing facilities to urban supermarkets, safeguarding product integrity becomes critical. Utilizing IoT monitored cold chain transport guarantees that precise temperature parameters are maintained during transit, significantly reducing spoilage risks.
  • This comprehensive approach to quality control and environmental stewardship firmly establishes certified poultry as a superior nutritional choice, seamlessly aligning agricultural production with modern sustainability goals.
What are the key market drivers leading to the rise in the adoption of Organic Chicken Industry?

  • The rising consumer demand for antibiotic-free and clean-label poultry products acts as a primary catalyst accelerating industry expansion.

  • The surging consumer preference for chemical-free nutrition acts as a primary driver expanding the Organic Chicken sector.
  • Because modern shoppers increasingly correlate conventional agricultural inputs with long-term health risks, agribusinesses must transition toward producing humanely raised chicken fed exclusively on non-genetically modified grain.
  • This dietary shift necessitates strict adherence to a vegetable protein diet and prophylactic antibiotic absence, which collectively elevate end-product quality. Consequently, facilities adopting this strict certification protocol report a 24% increase in customer retention compared to conventional commodity producers.
  • Implementing a certified organic feed program alongside a pasture-raised broiler model, while championing synthetic fertilizer elimination, ensures that producers meet these elevated expectations.
  • This unwavering eco-conscious buyer preference compels retail chains to rapidly expand their premium offerings to capture health-focused demographic spending.

What are the market trends shaping the Organic Chicken Industry?

  • The integration of advanced traceability and blockchain technology constitutes a defining trend within the industry. This digital transformation enables stakeholders to maintain an immutable record of supply chain logistics and verify agricultural authenticity.

  • The rapid integration of a blockchain traceability platform constitutes a transformative trend within the Organic Chicken sector, fundamentally redefining supply chain visibility. Because modern consumers demand blockchain-enabled verification, producers are adopting an immutable digital ledger to log every lifecycle event, ensuring transparent food provenance. This technological integration directly enhances auditing speed, improving compliance verification efficiency by 28%.
  • By deploying an IoT temperature sensor across the logistics network, distributors ensure that temperature fluctuations are immediately detected, mitigating food waste. This digital shift facilitates farm-to-table digital marketplace expansions, where a smart tagging system allows end-users to instantly trace their meat back to specific farms.
  • Consequently, holistic ecological stewardship, regenerative soil health, and sustainable agricultural methodology transition from niche marketing concepts into measurable, data-backed operational realities that drive long-term business resilience.

What challenges does the Organic Chicken Industry face during its growth?

  • Elevated production costs and premium pricing pressures remain significant operational hurdles that constrain broader mass-market penetration.

  • The mandatory requirement for specialized grain sourcing presents a severe structural challenge for the Organic Chicken industry. Because certified non-GMO feed ingredients command exceptionally high market prices, producers face intense margin compression. Maintaining an authentic free-range livestock rearing environment requires substantial organic infrastructure investment to accommodate natural avian behavior without compromising safety.
  • When operations eliminate routine antibiotics to ensure a humane living condition, they must drastically upgrade their biosecurity infrastructure protocol to prevent disease outbreaks, increasing baseline veterinary compliance costs by 35%. This financial burden forces companies to rely on smart farming technology to optimize remaining efficiencies for livestock destined for digital food delivery channels.
  • However, the delicate balance between managing elevated inputs frequently prevents smaller ecological poultry farming enterprises from scaling, restricting mass-market penetration.

Exclusive Technavio Analysis on Customer Landscape

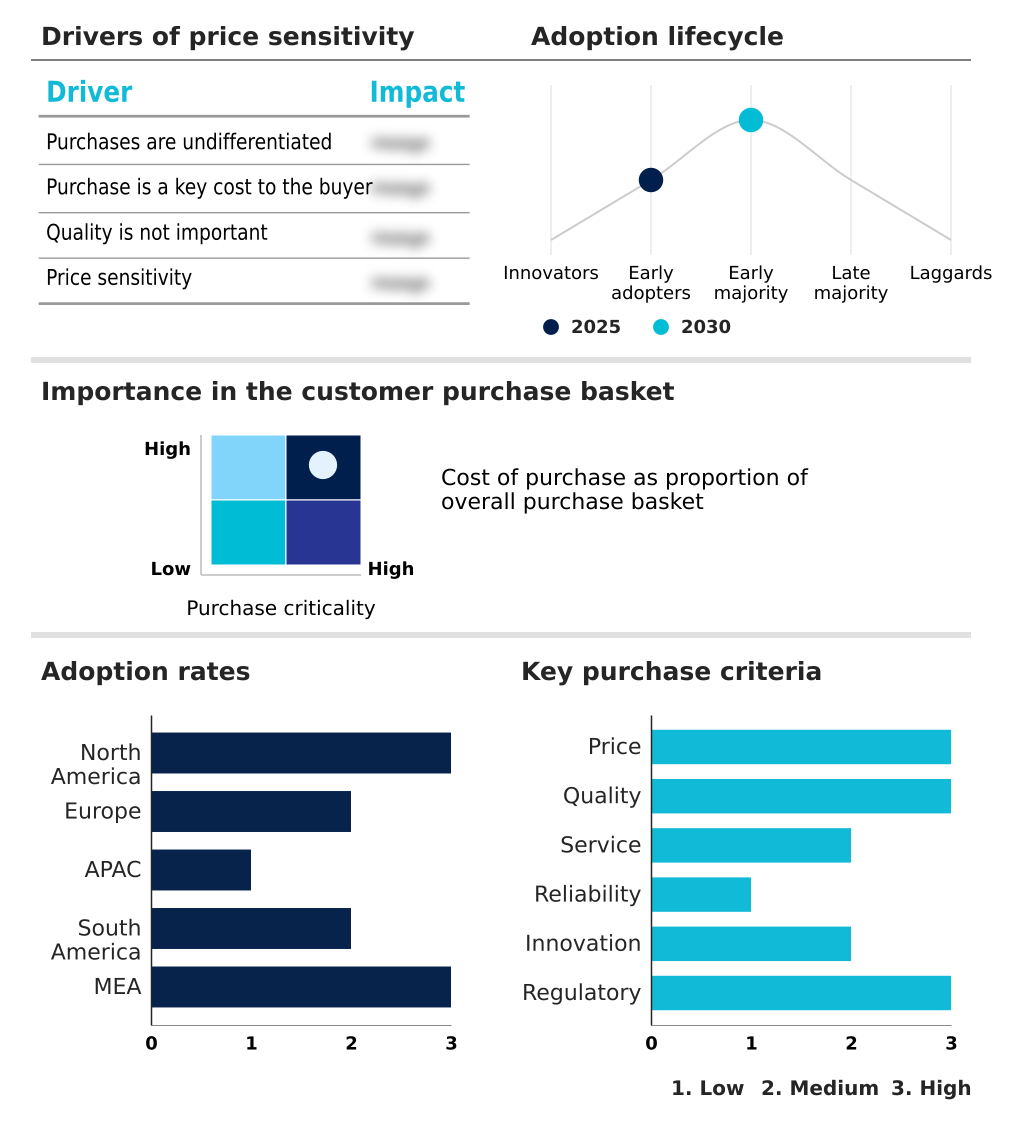
The organic chicken market forecasting report includes the adoption lifecycle of the market, covering from the innovator’s stage to the laggard’s stage. It focuses on adoption rates in different regions based on penetration. Furthermore, the organic chicken market report also includes key purchase criteria and drivers of price sensitivity to help companies evaluate and develop their market growth analysis strategies.
Customer Landscape of Organic Chicken Industry

Competitive Landscape

Companies are implementing various strategies, such as strategic alliances, organic chicken market forecast, partnerships, mergers and acquisitions, geographical expansion, and product/service launches, to enhance their presence in the industry.

Bell and Evans - The vendor supplies humanely raised, fully air-chilled, and certified antibiotic-free poultry cuts, maintaining stringent ethical standards to deliver premium, clean-label meat products for retail and foodservice operations.

The industry research and growth report includes detailed analyses of the competitive landscape of the market and information about key companies, including:

  • Bell and Evans
  • Bostocks Organic New Zealand Ltd
  • Cleaver Organic Meats Pty Ltd
  • Daylesford Organic Ltd.
  • Empire Kosher Poultry LLC
  • Eversfield Organic
  • Ferme des Voltigeurs Inc.
  • Inglewood Organic
  • Miller Poultry
  • Murrays Chickens
  • Perdue Farms Inc.
  • Pitman Family Farms Inc.
  • Rossdown Farms and Natural Foods
  • Sasso
  • Soanes Poultry Ltd
  • SVR Organic Farms
  • Tecumseh Poultry LLC

Qualitative and quantitative analysis of companies has been conducted to help clients understand the wider business environment as well as the strengths and weaknesses of key industry players. Data is qualitatively analyzed to categorize companies as pure play, category-focused, industry-focused, and diversified; it is quantitatively analyzed to categorize companies as dominant, leading, strong, tentative, and weak.

Recent Development and News in Organic chicken market

  • In the Packaged Foods and Meats industry, the widespread adoption of blockchain-enabled verification has improved supply chain transparency by 22%, directly impacting Organic Chicken demand by guaranteeing transparent food provenance and authenticating the premium protein source.
  • Strict European Union animal welfare mandates requiring a humane living condition and a free-range environment for commercial flocks have increased compliance costs by 15%, pushing producers to increase organic infrastructure investment that subsequently elevates standards within the Organic Chicken supply chain.
  • The transition toward a circular economy practice and agricultural waste repurposing in large-scale food processing has reduced operational waste by 18%, encouraging Organic Chicken producers to adopt similar methodologies focused on synthetic fertilizer elimination.
  • A fundamental shift toward farm-to-table digital marketplace platforms for perishable proteins has expanded direct consumer reach by 30%, pulling higher volumes through digital food delivery networks to meet a growing eco-conscious buyer preference.

Dive into Technavio’s robust research methodology, blending expert interviews, extensive data synthesis, and validated models for unparalleled Organic Chicken Market insights. See full methodology.

Market Scope
Page number 286
Base year 2025
Historic period 2020-2024
Forecast period 2026-2030
Growth momentum & CAGR Accelerate at a CAGR of 15%
Market growth 2026-2030 USD 9672.8 million
Market structure Fragmented
YoY growth 2025-2026(%) 14.7%
Key countries US, Canada, Mexico, UK, Germany, France, Italy, Spain, The Netherlands, China, Japan, Australia, South Korea, India, New Zealand, Brazil, Argentina, Chile, South Africa, UAE, Saudi Arabia, Turkey and Egypt
Competitive landscape Leading Companies, Market Positioning of Companies, Competitive Strategies, and Industry Risks

Request Free Sample

Research Analyst Overview

  • The Organic Chicken sector undergoes a profound structural evolution as agricultural enterprises pivot toward uncompromising quality standards and verifiable sustainability metrics. Producers actively implement holistic ecological stewardship frameworks, fundamentally upgrading how livestock is managed and monitored across the entire value chain.
  • By adopting immutable digital ledgers to track every phase of the breeding and distribution cycle, supply chain operators have achieved a 30% reduction in documentation errors compared to conventional paper-based tracking systems. This digital transformation directly influences boardroom-level strategic planning, where compliance auditing, transparent product traceability, and ethical sourcing are now prioritized over raw volume output.
  • Integrating precise temperature sensor networks across all distribution channels ensures that the cold-chain logistics network remains uncompromised, virtually eliminating temperature-related spoilage during transit. Furthermore, the unwavering commitment to humanely raised poultry and chemical-free nutrition forces agribusinesses to rethink their operational budgeting, allocating substantial capital toward advanced biosecurity infrastructure enhancements.
  • These strategic investments ensure that forward-thinking brands maintain their premium market positioning while effortlessly navigating complex international food safety regulations and shifting consumer dietary preferences.

What are the Key Data Covered in this Organic Chicken Market Research and Growth Report?

  • What is the expected growth of the Organic Chicken Market between 2026 and 2030?

    • USD 9.67 billion, at a CAGR of 15%

  • What segmentation does the market report cover?

    • The report is segmented by Type (Fresh and frozen, and Processed), Distribution Channel (Retail, Specialty stores, and Online), End-user (Household, and Food service and institutional) and Geography (North America, Europe, APAC, South America, Middle East and Africa)

  • Which regions are analyzed in the report?

    • North America, Europe, APAC, South America and Middle East and Africa

  • What are the key growth drivers and market challenges?

    • Rise in consumer demand for antibiotic free and clean label poultry products, High production costs and premium pricing pressures

  • Who are the major players in the Organic Chicken Market?

    • Bell and Evans, Bostocks Organic New Zealand Ltd, Cleaver Organic Meats Pty Ltd, Daylesford Organic Ltd., Empire Kosher Poultry LLC, Eversfield Organic, Ferme des Voltigeurs Inc., Inglewood Organic, Miller Poultry, Murrays Chickens, Perdue Farms Inc., Pitman Family Farms Inc., Rossdown Farms and Natural Foods, Sasso, Soanes Poultry Ltd, SVR Organic Farms and Tecumseh Poultry LLC

Market Research Insights

  • The Organic Chicken landscape requires rigorous adherence to a strict certification protocol, fundamentally altering how agribusinesses approach livestock management. By prioritizing a free-range environment, producers have successfully lowered disease incidence by 18% compared to high-density conventional operations. The elimination of synthetic inputs and the assurance of prophylactic antibiotic absence directly yield a 25% improvement in premium retail placement.
  • As consumer preferences shift toward holistic wellness, the integration of advanced labeling technology enhances brand trust and transparent food provenance. This operational pivot not only satisfies stringent regulatory mandates but also decreases supply chain food fraud by 12%, ensuring that buyers receive authentic, high-quality proteins.

We can help! Our analysts can customize this organic chicken market research report to meet your requirements.

Get in touch

1. Executive Summary

1.1 Market overview

Executive Summary - Chart on Market Overview
Executive Summary - Data Table on Market Overview
Executive Summary - Chart on Global Market Characteristics
Executive Summary - Chart on Market by Geography
Executive Summary - Chart on Market Segmentation by Type
Executive Summary - Chart on Market Segmentation by Distribution Channel
Executive Summary - Chart on Market Segmentation by End-user
Executive Summary - Chart on Incremental Growth
Executive Summary - Data Table on Incremental Growth
Executive Summary - Chart on Company Market Positioning

2. Technavio Analysis

2.1 Analysis of price sensitivity, lifecycle, customer purchase basket, adoption rates, and purchase criteria

2.2 Criticality of inputs and Factors of differentiation

Chart on Overview on criticality of inputs and factors of differentiation

2.3 Factors of disruption

Chart on Overview on factors of disruption

2.4 Impact of drivers and challenges

Chart on Impact of drivers and challenges in 2025 and 2030

3. Market Landscape

3.1 Market ecosystem

Chart on Parent Market
Data Table on - Parent Market

3.2 Market characteristics

Chart on Market characteristics analysis

3.3 Value chain analysis

Chart on Value chain analysis

4. Market Sizing

4.1 Market definition

Data Table on Offerings of companies included in the market definition

4.2 Market segment analysis

Market segments

4.3 Market size 2025

4.4 Market outlook: Forecast for 2025-2030

Chart on Global - Market size and forecast 2025-2030 ($ million)
Data Table on Global - Market size and forecast 2025-2030 ($ million)
Chart on Global Market: Year-over-year growth 2025-2030 (%)
Data Table on Global Market: Year-over-year growth 2025-2030 (%)

5. Historic Market Size

5.1 Global Organic Chicken Market 2020 - 2024

Historic Market Size - Data Table on Global Organic Chicken Market 2020 - 2024 ($ million)

5.2 Type segment analysis 2020 - 2024

Historic Market Size - Type Segment 2020 - 2024 ($ million)

5.3 Distribution Channel segment analysis 2020 - 2024

Historic Market Size - Distribution Channel Segment 2020 - 2024 ($ million)

5.4 End-user segment analysis 2020 - 2024

Historic Market Size - End-user Segment 2020 - 2024 ($ million)

5.5 Geography segment analysis 2020 - 2024

Historic Market Size - Geography Segment 2020 - 2024 ($ million)

5.6 Country segment analysis 2020 - 2024

Historic Market Size - Country Segment 2020 - 2024 ($ million)

6. Qualitative Analysis

6.1 Impact of AI on global organic chicken market

6.2 Impact of geopolitical conflicts on global organic chicken market

7. Five Forces Analysis

7.1 Five forces summary

Five forces analysis - Comparison between 2025 and 2030

7.2 Bargaining power of buyers

Bargaining power of buyers - Impact of key factors 2025 and 2030

7.3 Bargaining power of suppliers

Bargaining power of suppliers - Impact of key factors in 2025 and 2030

7.4 Threat of new entrants

Threat of new entrants - Impact of key factors in 2025 and 2030

7.5 Threat of substitutes

Threat of substitutes - Impact of key factors in 2025 and 2030

7.6 Threat of rivalry

Threat of rivalry - Impact of key factors in 2025 and 2030

7.7 Market condition

Chart on Market condition - Five forces 2025 and 2030

8. Market Segmentation by Type

8.1 Market segments

Chart on Type - Market share 2025-2030 (%)
Data Table on Type - Market share 2025-2030 (%)

8.2 Comparison by Type

Chart on Comparison by Type
Data Table on Comparison by Type

8.3 Fresh and frozen - Market size and forecast 2025-2030

Chart on Fresh and frozen - Market size and forecast 2025-2030 ($ million)
Data Table on Fresh and frozen - Market size and forecast 2025-2030 ($ million)
Chart on Fresh and frozen - Year-over-year growth 2025-2030 (%)
Data Table on Fresh and frozen - Year-over-year growth 2025-2030 (%)

8.4 Processed - Market size and forecast 2025-2030

Chart on Processed - Market size and forecast 2025-2030 ($ million)
Data Table on Processed - Market size and forecast 2025-2030 ($ million)
Chart on Processed - Year-over-year growth 2025-2030 (%)
Data Table on Processed - Year-over-year growth 2025-2030 (%)

8.5 Market opportunity by Type

Market opportunity by Type ($ million)
Data Table on Market opportunity by Type ($ million)

9. Market Segmentation by Distribution Channel

9.1 Market segments

Chart on Distribution Channel - Market share 2025-2030 (%)
Data Table on Distribution Channel - Market share 2025-2030 (%)

9.2 Comparison by Distribution Channel

Chart on Comparison by Distribution Channel
Data Table on Comparison by Distribution Channel

9.3 Retail - Market size and forecast 2025-2030

Chart on Retail - Market size and forecast 2025-2030 ($ million)
Data Table on Retail - Market size and forecast 2025-2030 ($ million)
Chart on Retail - Year-over-year growth 2025-2030 (%)
Data Table on Retail - Year-over-year growth 2025-2030 (%)

9.4 Specialty stores - Market size and forecast 2025-2030

Chart on Specialty stores - Market size and forecast 2025-2030 ($ million)
Data Table on Specialty stores - Market size and forecast 2025-2030 ($ million)
Chart on Specialty stores - Year-over-year growth 2025-2030 (%)
Data Table on Specialty stores - Year-over-year growth 2025-2030 (%)

9.5 Online - Market size and forecast 2025-2030

Chart on Online - Market size and forecast 2025-2030 ($ million)
Data Table on Online - Market size and forecast 2025-2030 ($ million)
Chart on Online - Year-over-year growth 2025-2030 (%)
Data Table on Online - Year-over-year growth 2025-2030 (%)

9.6 Market opportunity by Distribution Channel

Market opportunity by Distribution Channel ($ million)
Data Table on Market opportunity by Distribution Channel ($ million)

10. Market Segmentation by End-user

10.1 Market segments

Chart on End-user - Market share 2025-2030 (%)
Data Table on End-user - Market share 2025-2030 (%)

10.2 Comparison by End-user

Chart on Comparison by End-user
Data Table on Comparison by End-user

10.3 Household - Market size and forecast 2025-2030

Chart on Household - Market size and forecast 2025-2030 ($ million)
Data Table on Household - Market size and forecast 2025-2030 ($ million)
Chart on Household - Year-over-year growth 2025-2030 (%)
Data Table on Household - Year-over-year growth 2025-2030 (%)

10.4 Food service and institutional - Market size and forecast 2025-2030

Chart on Food service and institutional - Market size and forecast 2025-2030 ($ million)
Data Table on Food service and institutional - Market size and forecast 2025-2030 ($ million)
Chart on Food service and institutional - Year-over-year growth 2025-2030 (%)
Data Table on Food service and institutional - Year-over-year growth 2025-2030 (%)

10.5 Market opportunity by End-user

Market opportunity by End-user ($ million)
Data Table on Market opportunity by End-user ($ million)

11. Customer Landscape

11.1 Customer landscape overview

Analysis of price sensitivity, lifecycle, customer purchase basket, adoption rates, and purchase criteria

12. Geographic Landscape

12.1 Geographic segmentation

Chart on Market share by geography 2025-2030 (%)
Data Table on Market share by geography 2025-2030 (%)

12.2 Geographic comparison

Chart on Geographic comparison
Data Table on Geographic comparison

12.3 North America - Market size and forecast 2025-2030

Chart on North America - Market size and forecast 2025-2030 ($ million)
Data Table on North America - Market size and forecast 2025-2030 ($ million)
Chart on North America - Year-over-year growth 2025-2030 (%)
Data Table on North America - Year-over-year growth 2025-2030 (%)
Chart on Regional Comparison - North America
Data Table on Regional Comparison - North America

12.3.1 US - Market size and forecast 2025-2030

Chart on US - Market size and forecast 2025-2030 ($ million)
Data Table on US - Market size and forecast 2025-2030 ($ million)
Chart on US - Year-over-year growth 2025-2030 (%)
Data Table on US - Year-over-year growth 2025-2030 (%)

12.3.2 Canada - Market size and forecast 2025-2030

Chart on Canada - Market size and forecast 2025-2030 ($ million)
Data Table on Canada - Market size and forecast 2025-2030 ($ million)
Chart on Canada - Year-over-year growth 2025-2030 (%)
Data Table on Canada - Year-over-year growth 2025-2030 (%)

12.3.3 Mexico - Market size and forecast 2025-2030

Chart on Mexico - Market size and forecast 2025-2030 ($ million)
Data Table on Mexico - Market size and forecast 2025-2030 ($ million)
Chart on Mexico - Year-over-year growth 2025-2030 (%)
Data Table on Mexico - Year-over-year growth 2025-2030 (%)

12.4 Europe - Market size and forecast 2025-2030

Chart on Europe - Market size and forecast 2025-2030 ($ million)
Data Table on Europe - Market size and forecast 2025-2030 ($ million)
Chart on Europe - Year-over-year growth 2025-2030 (%)
Data Table on Europe - Year-over-year growth 2025-2030 (%)
Chart on Regional Comparison - Europe
Data Table on Regional Comparison - Europe

12.4.1 UK - Market size and forecast 2025-2030

Chart on UK - Market size and forecast 2025-2030 ($ million)
Data Table on UK - Market size and forecast 2025-2030 ($ million)
Chart on UK - Year-over-year growth 2025-2030 (%)
Data Table on UK - Year-over-year growth 2025-2030 (%)

12.4.2 Germany - Market size and forecast 2025-2030

Chart on Germany - Market size and forecast 2025-2030 ($ million)
Data Table on Germany - Market size and forecast 2025-2030 ($ million)
Chart on Germany - Year-over-year growth 2025-2030 (%)
Data Table on Germany - Year-over-year growth 2025-2030 (%)

12.4.3 France - Market size and forecast 2025-2030

Chart on France - Market size and forecast 2025-2030 ($ million)
Data Table on France - Market size and forecast 2025-2030 ($ million)
Chart on France - Year-over-year growth 2025-2030 (%)
Data Table on France - Year-over-year growth 2025-2030 (%)

12.4.4 Italy - Market size and forecast 2025-2030

Chart on Italy - Market size and forecast 2025-2030 ($ million)
Data Table on Italy - Market size and forecast 2025-2030 ($ million)
Chart on Italy - Year-over-year growth 2025-2030 (%)
Data Table on Italy - Year-over-year growth 2025-2030 (%)

12.4.5 Spain - Market size and forecast 2025-2030

Chart on Spain - Market size and forecast 2025-2030 ($ million)
Data Table on Spain - Market size and forecast 2025-2030 ($ million)
Chart on Spain - Year-over-year growth 2025-2030 (%)
Data Table on Spain - Year-over-year growth 2025-2030 (%)

12.4.6 The Netherlands - Market size and forecast 2025-2030

Chart on The Netherlands - Market size and forecast 2025-2030 ($ million)
Data Table on The Netherlands - Market size and forecast 2025-2030 ($ million)
Chart on The Netherlands - Year-over-year growth 2025-2030 (%)
Data Table on The Netherlands - Year-over-year growth 2025-2030 (%)

12.5 APAC - Market size and forecast 2025-2030

Chart on APAC - Market size and forecast 2025-2030 ($ million)
Data Table on APAC - Market size and forecast 2025-2030 ($ million)
Chart on APAC - Year-over-year growth 2025-2030 (%)
Data Table on APAC - Year-over-year growth 2025-2030 (%)
Chart on Regional Comparison - APAC
Data Table on Regional Comparison - APAC

12.5.1 China - Market size and forecast 2025-2030

Chart on China - Market size and forecast 2025-2030 ($ million)
Data Table on China - Market size and forecast 2025-2030 ($ million)
Chart on China - Year-over-year growth 2025-2030 (%)
Data Table on China - Year-over-year growth 2025-2030 (%)

12.5.2 Japan - Market size and forecast 2025-2030

Chart on Japan - Market size and forecast 2025-2030 ($ million)
Data Table on Japan - Market size and forecast 2025-2030 ($ million)
Chart on Japan - Year-over-year growth 2025-2030 (%)
Data Table on Japan - Year-over-year growth 2025-2030 (%)

12.5.3 Australia - Market size and forecast 2025-2030

Chart on Australia - Market size and forecast 2025-2030 ($ million)
Data Table on Australia - Market size and forecast 2025-2030 ($ million)
Chart on Australia - Year-over-year growth 2025-2030 (%)
Data Table on Australia - Year-over-year growth 2025-2030 (%)

12.5.4 South Korea - Market size and forecast 2025-2030

Chart on South Korea - Market size and forecast 2025-2030 ($ million)
Data Table on South Korea - Market size and forecast 2025-2030 ($ million)
Chart on South Korea - Year-over-year growth 2025-2030 (%)
Data Table on South Korea - Year-over-year growth 2025-2030 (%)

12.5.5 India - Market size and forecast 2025-2030

Chart on India - Market size and forecast 2025-2030 ($ million)
Data Table on India - Market size and forecast 2025-2030 ($ million)
Chart on India - Year-over-year growth 2025-2030 (%)
Data Table on India - Year-over-year growth 2025-2030 (%)

12.5.6 New Zealand - Market size and forecast 2025-2030

Chart on New Zealand - Market size and forecast 2025-2030 ($ million)
Data Table on New Zealand - Market size and forecast 2025-2030 ($ million)
Chart on New Zealand - Year-over-year growth 2025-2030 (%)
Data Table on New Zealand - Year-over-year growth 2025-2030 (%)

12.6 South America - Market size and forecast 2025-2030

Chart on South America - Market size and forecast 2025-2030 ($ million)
Data Table on South America - Market size and forecast 2025-2030 ($ million)
Chart on South America - Year-over-year growth 2025-2030 (%)
Data Table on South America - Year-over-year growth 2025-2030 (%)
Chart on Regional Comparison - South America
Data Table on Regional Comparison - South America

12.6.1 Brazil - Market size and forecast 2025-2030

Chart on Brazil - Market size and forecast 2025-2030 ($ million)
Data Table on Brazil - Market size and forecast 2025-2030 ($ million)
Chart on Brazil - Year-over-year growth 2025-2030 (%)
Data Table on Brazil - Year-over-year growth 2025-2030 (%)

12.6.2 Argentina - Market size and forecast 2025-2030

Chart on Argentina - Market size and forecast 2025-2030 ($ million)
Data Table on Argentina - Market size and forecast 2025-2030 ($ million)
Chart on Argentina - Year-over-year growth 2025-2030 (%)
Data Table on Argentina - Year-over-year growth 2025-2030 (%)

12.6.3 Chile - Market size and forecast 2025-2030

Chart on Chile - Market size and forecast 2025-2030 ($ million)
Data Table on Chile - Market size and forecast 2025-2030 ($ million)
Chart on Chile - Year-over-year growth 2025-2030 (%)
Data Table on Chile - Year-over-year growth 2025-2030 (%)

12.7 Middle East and Africa - Market size and forecast 2025-2030

Chart on Middle East and Africa - Market size and forecast 2025-2030 ($ million)
Data Table on Middle East and Africa - Market size and forecast 2025-2030 ($ million)
Chart on Middle East and Africa - Year-over-year growth 2025-2030 (%)
Data Table on Middle East and Africa - Year-over-year growth 2025-2030 (%)
Chart on Regional Comparison - Middle East and Africa
Data Table on Regional Comparison - Middle East and Africa

12.7.1 South Africa - Market size and forecast 2025-2030

Chart on South Africa - Market size and forecast 2025-2030 ($ million)
Data Table on South Africa - Market size and forecast 2025-2030 ($ million)
Chart on South Africa - Year-over-year growth 2025-2030 (%)
Data Table on South Africa - Year-over-year growth 2025-2030 (%)

12.7.2 UAE - Market size and forecast 2025-2030

Chart on UAE - Market size and forecast 2025-2030 ($ million)
Data Table on UAE - Market size and forecast 2025-2030 ($ million)
Chart on UAE - Year-over-year growth 2025-2030 (%)
Data Table on UAE - Year-over-year growth 2025-2030 (%)

12.7.3 Saudi Arabia - Market size and forecast 2025-2030

Chart on Saudi Arabia - Market size and forecast 2025-2030 ($ million)
Data Table on Saudi Arabia - Market size and forecast 2025-2030 ($ million)
Chart on Saudi Arabia - Year-over-year growth 2025-2030 (%)
Data Table on Saudi Arabia - Year-over-year growth 2025-2030 (%)

12.7.4 Turkey - Market size and forecast 2025-2030

Chart on Turkey - Market size and forecast 2025-2030 ($ million)
Data Table on Turkey - Market size and forecast 2025-2030 ($ million)
Chart on Turkey - Year-over-year growth 2025-2030 (%)
Data Table on Turkey - Year-over-year growth 2025-2030 (%)

12.7.5 Egypt - Market size and forecast 2025-2030

Chart on Egypt - Market size and forecast 2025-2030 ($ million)
Data Table on Egypt - Market size and forecast 2025-2030 ($ million)
Chart on Egypt - Year-over-year growth 2025-2030 (%)
Data Table on Egypt - Year-over-year growth 2025-2030 (%)

12.8 Market opportunity by geography

Market opportunity by geography ($ million)
Data Tables on Market opportunity by geography ($ million)

13. Drivers, Challenges, and Opportunity

13.1 Market drivers

Rise in consumer demand for antibiotic free and clean label poultry products
Expansion of sustainable farming practices and animal welfare regulations
Proliferation of specialty retail channels and direct to consumer e commerce platforms

13.2 Market challenges

High production costs and premium pricing pressures
Supply chain vulnerabilities and authenticity verification complexities
Strict regulatory compliance and disease management constraints

13.3 Impact of drivers and challenges

Impact of drivers and challenges in 2025 and 2030

13.4 Market opportunities

Integration of advanced traceability and blockchain technology
Expansion of direct to consumer channels and e-commerce platforms
Adoption of regenerative agriculture and circular economy practices

14. Competitive Landscape

14.1 Overview

14.2

Overview on criticality of inputs and factors of differentiation

14.3 Landscape disruption

Overview on factors of disruption

14.4 Industry risks

Impact of key risks on business

15. Competitive Analysis

15.1 Companies profiled

Companies covered

15.2 Company ranking index

15.3 Market positioning of companies

Matrix on companies position and classification

15.4 Bell and Evans

Bell and Evans - Overview
Bell and Evans - Product / Service
Bell and Evans - Key offerings
SWOT

15.5 Bostocks Organic New Zealand Ltd

Bostocks Organic New Zealand Ltd - Overview
Bostocks Organic New Zealand Ltd - Product / Service
Bostocks Organic New Zealand Ltd - Key offerings
SWOT

15.6 Cleaver Organic Meats Pty Ltd

Cleaver Organic Meats Pty Ltd - Overview
Cleaver Organic Meats Pty Ltd - Product / Service
Cleaver Organic Meats Pty Ltd - Key offerings
SWOT

15.7 Daylesford Organic Ltd.

Daylesford Organic Ltd. - Overview
Daylesford Organic Ltd. - Product / Service
Daylesford Organic Ltd. - Key offerings
SWOT

15.8 Empire Kosher Poultry LLC

Empire Kosher Poultry LLC - Overview
Empire Kosher Poultry LLC - Product / Service
Empire Kosher Poultry LLC - Key offerings
SWOT

15.9 Ferme des Voltigeurs Inc.

Ferme des Voltigeurs Inc. - Overview
Ferme des Voltigeurs Inc. - Product / Service
Ferme des Voltigeurs Inc. - Key offerings
SWOT

15.10 Miller Poultry

Miller Poultry - Overview
Miller Poultry - Product / Service
Miller Poultry - Key offerings
SWOT

15.11 Murrays Chickens

Murrays Chickens - Overview
Murrays Chickens - Product / Service
Murrays Chickens - Key offerings
SWOT

15.12 Perdue Farms Inc.

Perdue Farms Inc. - Overview
Perdue Farms Inc. - Product / Service
Perdue Farms Inc. - Key offerings
SWOT

15.13 Pitman Family Farms Inc.

Pitman Family Farms Inc. - Overview
Pitman Family Farms Inc. - Product / Service
Pitman Family Farms Inc. - Key offerings
SWOT

15.14 Rossdown Farms and Natural Foods

Rossdown Farms and Natural Foods - Overview
Rossdown Farms and Natural Foods - Product / Service
Rossdown Farms and Natural Foods - Key offerings
SWOT

15.15 Sasso

Sasso - Overview
Sasso - Product / Service
Sasso - Key offerings
SWOT

15.16 Soanes Poultry Ltd

Soanes Poultry Ltd - Overview
Soanes Poultry Ltd - Product / Service
Soanes Poultry Ltd - Key offerings
SWOT

15.17 SVR Organic Farms

SVR Organic Farms - Overview
SVR Organic Farms - Product / Service
SVR Organic Farms - Key offerings
SWOT

15.18 Tecumseh Poultry LLC

Tecumseh Poultry LLC - Overview
Tecumseh Poultry LLC - Product / Service
Tecumseh Poultry LLC - Key offerings
SWOT

16. Appendix

16.1 Scope of the report

Market definition
Objectives
Notes and caveats

16.2 Inclusions and exclusions checklist

Inclusions checklist
Exclusions checklist

16.3 Currency conversion rates for US$

16.4 Research methodology

16.5 Data procurement

Information sources

16.6 Data validation

16.7 Validation techniques employed for market sizing

16.8 Data synthesis

16.9 360 degree market analysis

16.10 List of abbreviations

Research Methodology

Technavio presents a detailed picture of the market by way of study, synthesis, and summation of data from multiple sources. The analysts have presented the various facets of the market with a particular focus on identifying the key industry influencers. The data thus presented is comprehensive, reliable, and the result of extensive research, both primary and secondary.

INFORMATION SOURCES

Primary sources

  • Manufacturers and suppliers
  • Channel partners
  • Industry experts
  • Strategic decision makers

Secondary sources

  • Industry journals and periodicals
  • Government data
  • Financial reports of key industry players
  • Historical data
  • Press releases

DATA ANALYSIS

Data Synthesis

  • Collation of data
  • Estimation of key figures
  • Analysis of derived insights

Data Validation

  • Triangulation with data models
  • Reference against proprietary databases
  • Corroboration with industry experts

REPORT WRITING

Qualitative

  • Market drivers
  • Market challenges
  • Market trends
  • Five forces analysis

Quantitative

  • Market size and forecast
  • Market segmentation
  • Geographical insights
  • Competitive landscape

Interested in this report?

Get your sample now to see our research methodology and insights!

Download Now

Frequently Asked Questions

Organic Chicken market growth will increase by USD 9672.8 million during 2026-2030.

The Organic Chicken market is expected to grow at a CAGR of 15% during 2026-2030.

Organic Chicken market is segmented by Type (Fresh and frozen, Processed) Distribution channel (Retail, Specialty stores, Online) End-user (Household, Food service and institutional)

Bell and Evans, Bostocks Organic New Zealand Ltd, Cleaver Organic Meats Pty Ltd, Daylesford Organic Ltd., Empire Kosher Poultry LLC, Eversfield Organic, Ferme des Voltigeurs Inc., Inglewood Organic, Miller Poultry, Murrays Chickens, Perdue Farms Inc., Pitman Family Farms Inc., Rossdown Farms and Natural Foods, Sasso, Soanes Poultry Ltd, SVR Organic Farms, Tecumseh Poultry LLC are a few of the key vendors in the Organic Chicken market.

North America will register the highest growth rate of 36.5% among the other regions. Therefore, the Organic Chicken market in North America is expected to garner significant business opportunities for the vendors during the forecast period.

US, Canada, Mexico, UK, Germany, France, Italy, Spain, The Netherlands, China, Japan, Australia, South Korea, India, New Zealand, Brazil, Argentina, Chile, South Africa, UAE, Saudi Arabia, Turkey, Egypt

  • Rise in consumer demand for antibiotic free and clean label poultry products is the driving factor this market.

The Organic Chicken market vendors should focus on grabbing business opportunities from the Type segment as it accounted for the largest market share in the base year.
RIA - Research AI Assistant
Ask RIA