Orthopedic 3D Printed Devices Market Analysis, Size, and Forecast 2025-2029: North America (US, Canada, and Mexico), Europe (France, Germany, Italy, and UK), APAC (China, India, and Japan), and Rest of World (ROW)

Orthopedic 3D Printed Devices Market Analysis, Size, and Forecast 2025-2029:
North America (US, Canada, and Mexico), Europe (France, Germany, Italy, and UK), APAC (China, India, and Japan), and Rest of World (ROW)

Published: Jun 2025 235 Pages SKU: IRTNTR43540

Market Overview at a Glance

$2.06 B
Market Opportunity
20.2%
CAGR
16.6
YoY growth 2024-2025(%)

Orthopedic 3D Printed Devices Market Size 2025-2029

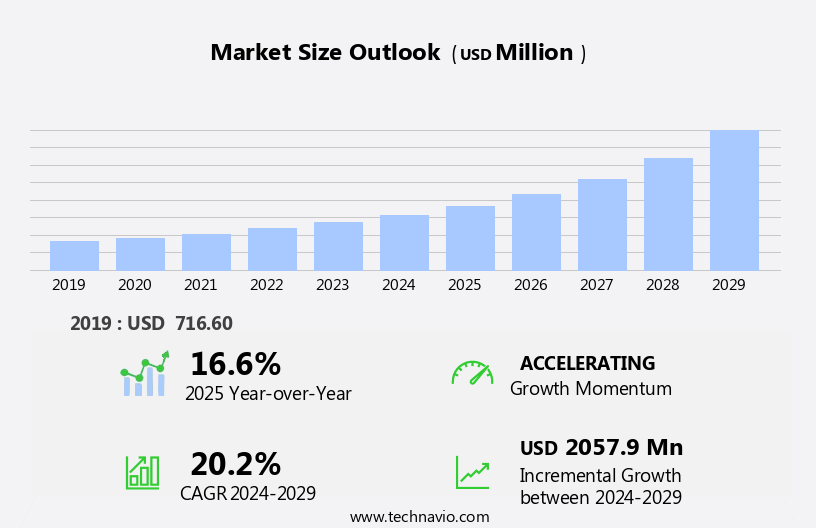
The orthopedic 3D printed devices market size is forecast to increase by USD 2.06 billion at a CAGR of 20.2% between 2024 and 2029.

  • The market is experiencing significant growth due to the increasing demand for personalized orthopedic solutions. The ability of 3D printing technology to create customized devices tailored to individual patient needs is a key driver in this market. Medical professionals are increasingly adopting this technology to improve patient outcomes and enhance the overall patient experience. These trends are primarily driven by the increasing demand for innovative solutions, advancements in medical technology, and changing consumer preferences. However, high initial costs associated with setting up a 3D printing facility pose a significant challenge for market entrants. Despite this hurdle, the potential for innovation and the ability to address unmet clinical needs make the market an attractive proposition for companies seeking to capitalize on emerging opportunities.
  • By focusing on cost reduction strategies and collaborative partnerships, market players can navigate the challenges and seize the potential of this dynamic and evolving market. The market's growth in the coming years will be fueled by the increasing number of elective orthopedic operations, advancements in implant materials and surgical techniques, and the integration of telemedicine and robotic operation assistants.

What will be the Size of the Orthopedic 3D Printed Devices Market during the forecast period?

Orthopedic 3D Printed Devices Market Size

 Explore in-depth regional segment analysis with market size data - historical 2019-2023 and forecasts 2025-2029 - in the full report.  
Request Free Sample

  • The market is experiencing significant advancements, particularly in trauma operations and sports medicine. Artificial intelligence (AI) and machine learning algorithms are revolutionizing design optimization and software solutions, enabling reverse engineering and 3D scanning for personalized implants. Polylactic acid (PLA), polyurethane (PU), polypropylene (PP), and bioabsorbable polymers are popular materials for functional restoration, while ceramic materials and composite structures cater to spinal disorders and bone cancer patients.
  • Orthopedic operation and physical therapy are benefiting from AI-assisted pain management and data analytics. Surgical robotics and PEEK polymers are transforming complex procedures, while bioactive glasses and PE enhance implant integration. These trends are improving the quality of life for patients and driving market growth.

How is this Orthopedic 3D Printed Devices Industry segmented?

The orthopedic 3D printed devices industry research report provides comprehensive data (region-wise segment analysis), with forecasts and estimates in "USD million" for the period 2025-2029, as well as historical data from 2019-2023 for the following segments.

  • Application
    • Orthopedic implants
    • Surgical planning
    • Surgical instruments
  • Type
    • Plastics
    • Nylon
    • Biomaterials
    • Others
  • Technology
    • Stereolithography (SLA)
    • Fused deposition modeling (FDM)
    • Selective laser sintering (SLS)
    • Electron beam melting (EBM)
    • Others
  • Geography
    • North America
      • US
      • Canada
      • Mexico
    • Europe
      • France
      • Germany
      • Italy
      • UK
    • APAC
      • China
      • India
      • Japan
    • Rest of World (ROW)

By Application Insights

The orthopedic implants segment is estimated to witness significant growth during the forecast period. The market encompasses surgical guides, mechanical strength medical devices, patient-specific designs, and various orthopedic implants. This sector leverages 3D printing and additive manufacturing to create complex structures, including bone implants, dental implants, and custom orthotics. Titanium alloys, with their high fracture toughness and biocompatibility, are commonly used materials in this field. Manufacturing automation through computer-aided design (CAD) and 3D printing technology enables the production of customized implants, addressing the unique needs of individual patients. Biocompatibility testing and biomechanical modeling ensure the safety and efficacy of these devices. 3D printing allows for the creation of intricate structures, unattainable through traditional manufacturing methods, and facilitates the production of patient-matched implants.

The technology's potential in personalized medicine reduces healthcare costs by minimizing the need for multiple implant sizes and types. Regulatory approvals, clinical trials, and patient outcomes are crucial factors driving the growth of the market. Advanced manufacturing techniques, such as stereolithography (SLA), powder bed fusion, and surface finishing, contribute to the development of high-quality, durable implants with improved wear resistance and fatigue strength. Bioresorbable materials and image-guided operation further expand the application scope of 3D printed orthopedic devices, enhancing patient care and surgical precision. Quality control measures ensure consistent product performance and reliability, making 3D printed orthopedic devices a promising solution for various orthopedic applications.

Orthopedic 3D Printed Devices Market Size

 Download Free Sample Report

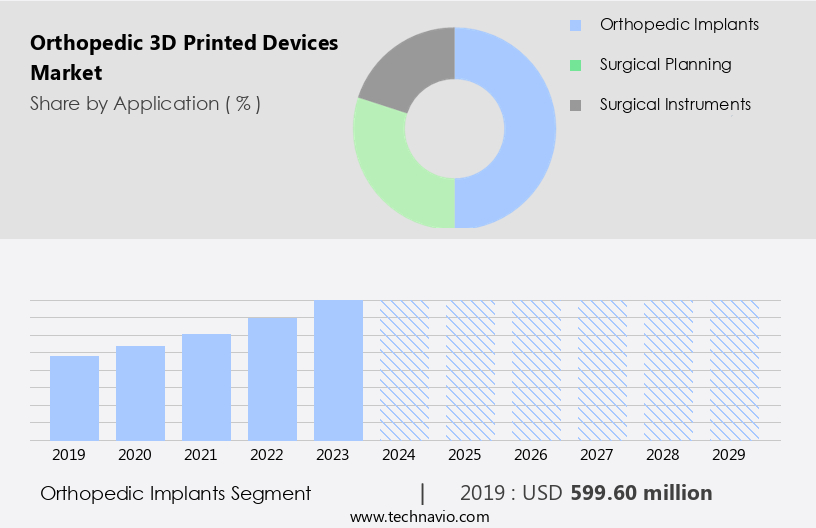
The Orthopedic implants segment was valued at USD 599.60 billion in 2019 and showed a gradual increase during the forecast period.

Regional Analysis

North America is estimated to contribute 39% to the growth of the global market during the forecast period. Technavio's analysts have elaborately explained the regional trends and drivers that shape the market during the forecast period.

Orthopedic 3D Printed Devices Market Share by Geography

View Free PDF Sample

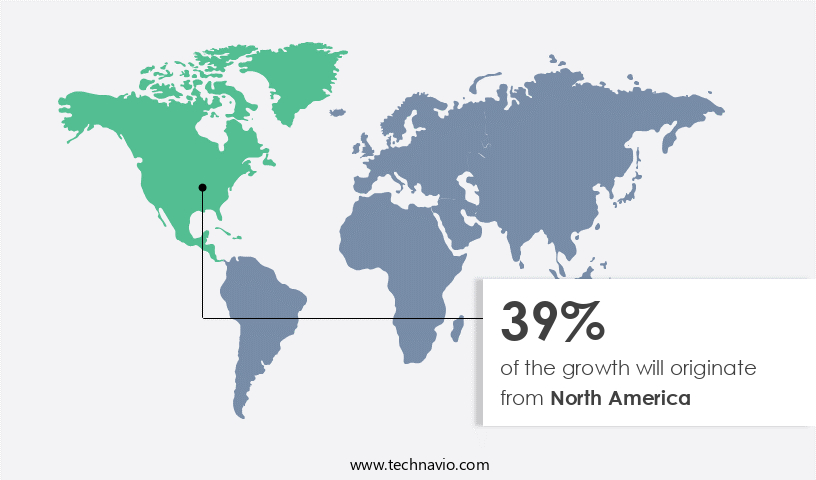
The market experienced significant growth in 2024, with North America leading the revenue share. The US and Canada were the primary contributors to the market in the Americas, driven by enhanced healthcare infrastructure, increased adoption of 3D printing devices in healthcare facilities, and the presence of established companies. In Canada, around 59,000 hip replacements and over 70,000 knee replacements were performed between 2017 and 2018, according to the Canadian Joint Replacement Registry (CJRR). Additionally, over 9,700 hip and knee revision operations took place the previous year. The market's expansion can also be attributed to the advantages of patient-specific designs, mechanical strength from materials like titanium alloys and biocompatible materials, and the potential for tissue engineering and joint replacements.

Regulatory approvals, clinical trials, and quality control are crucial aspects of the market, ensuring the biocompatibility, fatigue strength, and wear resistance of these devices. Technological advancements, such as additive manufacturing, computer-aided design, stereolithography, and surface finishing, contribute to the market's evolution. The integration of medical imaging and image-guided operation further enhances the precision and customization of these devices. Manufacturing automation and biomechanical modeling enable efficient production and accurate design, while material extrusion and powder bed fusion are essential fabrication techniques. The market's trends include the development of bioresorbable materials and joint replacements, catering to the demand for personalized medicine and minimally invasive procedures.

Market Dynamics

Our researchers analyzed the data with 2024 as the base year, along with the key drivers, trends, and challenges. A holistic analysis of drivers will help companies refine their marketing strategies to gain a competitive advantage.

What are the Orthopedic 3D Printed Devices market drivers leading to the rise in the adoption of Industry?

  • The increase in demand for personalized and customized orthopedic devices is the primary market driver, as patients increasingly seek individualized solutions to address their unique orthopedic needs. Three-dimensional (3D) printing technology is revolutionizing the orthopedic medical device industry by enabling the creation of patient-specific surgical guides and implants. This technology allows for the fabrication of customized devices using a patient's medical imaging data. The intricate shapes and geometric features possible with additive layer manufacturing are not achievable through traditional subtractive manufacturing techniques, regardless of cost. 3D printing is particularly valuable in the development of complex orthopedic applications, such as customized prosthetic limbs. The technology facilitates the creation of porous engineered structures, tortuous internal channels, and internal support structures, all of which enhance implant performance and patient outcomes.
  • The use of 3D printing in orthopedics is not limited to complex cases. It also offers advantages in the production of standard implants, as it allows for the rapid prototyping and testing of new designs. Furthermore, the use of materials like titanium alloys ensures the required mechanical strength and fracture toughness for orthopedic applications. Personalized medicine is a growing trend in healthcare, and 3D printing plays a significant role in its implementation. The ability to create patient-specific devices using 3D printing technology reduces healthcare costs by minimizing the need for multiple surgical procedures and reducing the time and resources required for traditional manufacturing methods.

What are the Orthopedic 3D Printed Devices market trends shaping the Industry?

  • Medical professionals are increasingly adopting 3D printing technology, marking a significant trend in the healthcare industry. This advanced technology enables the creation of customized medical devices and implants, improving patient outcomes and reducing costs. 3D printing, a cutting-edge technology, is revolutionizing the medical field, particularly in orthopedics. This additive manufacturing process enables the creation of intricately designed bone implants, dental implants, and other medical devices. The technology's integration into orthopedic procedures enhances manufacturing automation, leading to improved accuracy, efficiency, and cost savings. Biocompatibility testing and biomechanical modeling are crucial aspects of 3D printing in orthopedics. Material extrusion is a common 3D printing technique used to produce implants, ensuring they mimic the mechanical properties of natural bone. These advancements offer operations a more deep experience, enabling them to anticipate surgical challenges and optimize patient treatment.
  • Pre-surgical planning, such as that for shoulder arthroplasty, benefits significantly from 3D printed anatomical models. These models provide a more comprehensive understanding of complex anatomy and pathology compared to traditional 2D representations. 

How does Orthopedic 3D Printed Devices market face challenges during its growth?

  • The high initial costs associated with establishing a 3D printing facility pose a significant challenge and hinder the industry's growth. The market is experiencing significant growth due to the advancements in biocompatible materials and tissue engineering. Regulatory approvals for these devices are increasing, enabling custom orthotics and prosthetics to become more accessible. Computer-aided design (CAD) technology plays a crucial role in the production process, ensuring precise and accurate designs. However, high capital costs are a barrier to widespread adoption. These costs include the expensive equipment required for 3D printing or outsourced print service contracts, as well as the advanced software used in post-processing activities. High-end additive manufacturing (AM) printers, such as SLS, material jetting, and metal printing, can cost from USD200,000 to USD850,000, and sometimes even several millions of dollars.
  • End-users must also bear the costs of maintenance and repairs on the 3D printing machines. Additionally, the cost of proprietary raw materials sold by 3D printer manufacturers contributes to the high costs. Clinical trials and patient outcomes studies are essential to validate the effectiveness and safety of these devices, further increasing the overall costs. Despite these challenges, the potential benefits of 3D printed orthopedic devices, such as improved fatigue strength and customization, make them an attractive option for the healthcare industry.

Exclusive Customer Landscape

The orthopedic 3D printed devices market forecasting report includes the adoption lifecycle of the market, covering from the innovator's stage to the laggard's stage. It focuses on adoption rates in different regions based on penetration. Furthermore, the orthopedic 3D printed devices market report also includes key purchase criteria and drivers of price sensitivity to help companies evaluate and develop their market growth analysis strategies.

Orthopedic 3D Printed Devices Market Share by Geography

 Customer Landscape

Key Companies & Market Insights

Companies are implementing various strategies, such as strategic alliances, orthopedic 3D printed devices market forecast, partnerships, mergers and acquisitions, geographical expansion, and product/service launches, to enhance their presence in the industry.

3D Systems Corp. - This company provides orthopedic operations with advanced 3D visualization technology, enabling them to examine a patient's anatomy in detail and create customized surgical plans before procedures. 

The industry research and growth report includes detailed analyses of the competitive landscape of the market and information about key companies, including:

  • 3D Systems Corp.
  • Biomedical Modeling Inc.
  • Dimension Inx.
  • EOS GmbH
  • Formlabs Inc.
  • General Electric Co.
  • Johnson and Johnson Services Inc.
  • MATERIALISE NV
  • Medtronic Plc
  • Osteo3D
  • Renishaw Plc
  • SLM Solutions Group AG
  • Smith and Nephew plc
  • Stratasys Ltd.
  • Ultimaker BV
  • Zimmer Biomet Holdings Inc.

Qualitative and quantitative analysis of companies has been conducted to help clients understand the wider business environment as well as the strengths and weaknesses of key industry players. Data is qualitatively analyzed to categorize companies as pure play, category-focused, industry-focused, and diversified; it is quantitatively analyzed to categorize companies as dominant, leading, strong, tentative, and weak.

Recent Development and News in Orthopedic 3D Printed Devices Market

  • In February 2024, Stryker Corporation, a leading medical technology company, announced the FDA clearance and commercial launch of its 3D printed, custom-made titanium knee implants. This innovative product expansion marks a significant step forward in personalized orthopedic solutions (Stryker Corporation Press Release, 2024).
  • In May 2025, Medtronic and GE Additive, a leading metal 3D printing company, announced a strategic partnership to develop and commercialize 3D-printed orthopedic implants. This collaboration combines Medtronic's clinical expertise and market reach with GE Additive's advanced 3D printing technology (Medtronic Press Release, 2025).
  • In July 2024, Nano Dimension, a leading additive manufacturing solutions provider, raised USD120 million in a funding round to expand its production capacity and accelerate the development of its DragonFly LMD 3D printer for bioprinting orthopedic implants. This investment signifies a strong market demand and confidence in the potential of 3D-printed orthopedic devices (Nano Dimension Press Release, 2024).

Research Analyst Overview

The market continues to evolve, driven by advancements in biocompatible materials, tissue engineering, and regulatory approvals. The integration of computer-aided design (CAD) and medical imaging enables the creation of patient-specific designs, leading to improved fit and functionality. Titanium alloys, known for their mechanical strength and fracture toughness, remain popular choices for bone implants. Manufacturing automation through additive manufacturing techniques, such as material extrusion and powder bed fusion, streamlines production and reduces healthcare costs. Bone implants, dental implants, and custom orthotics are among the sectors benefiting from these innovations. Biocompatibility testing and biomechanical modeling ensure the durability and wear resistance of these devices.

Regulatory approvals continue to be granted, enabling wider market access. Ongoing clinical trials provide valuable insights into patient outcomes, further fueling market growth. The future of orthopedic devices lies in personalized medicine, with a focus on patient-specific designs and tissue engineering. Bioresorbable materials offer the potential for minimally invasive procedures and reduced recovery times. Image-guided operations and surface finishing techniques enhance precision and accuracy. Market dynamics remain fluid, with ongoing research and development shaping the landscape. The ongoing integration of technology and biology promises to unlock new possibilities in the orthopedic devices sector.

Dive into Technavio's robust research methodology, blending expert interviews, extensive data synthesis, and validated models for unparalleled Orthopedic 3D Printed Devices Market insights. See full methodology.

Market Scope

Report Coverage

Details

Page number

235

Base year

2024

Historic period

2019-2023

Forecast period

2025-2029

Growth momentum & CAGR

Accelerate at a CAGR of 20.2%

Market growth 2025-2029

USD 2.06 billion

Market structure

Fragmented

YoY growth 2024-2025(%)

16.6

Key countries

US, Germany, China, UK, Canada, France, Italy, Japan, India, and Mexico

Competitive landscape

Leading Companies, Market Positioning of Companies, Competitive Strategies, and Industry Risks

Request Free Sample

What are the Key Data Covered in this Orthopedic 3D Printed Devices Market Research and Growth Report?

  • CAGR of the Orthopedic 3D Printed Devices industry during the forecast period
  • Detailed information on factors that will drive the growth and forecasting between 2025 and 2029
  • Precise estimation of the size of the market and its contribution of the industry in focus to the parent market
  • Accurate predictions about upcoming growth and trends and changes in consumer behaviour
  • Growth of the market across North America, Europe, Asia, and Rest of World (ROW)
  • Thorough analysis of the market's competitive landscape and detailed information about companies
  • Comprehensive analysis of factors that will challenge the orthopedic 3D printed devices market growth of industry companies

We can help! Our analysts can customize this orthopedic 3D printed devices market research report to meet your requirements.

Get in touch

1 Executive Summary

  • 1.1 Market overview
    • Executive Summary - Chart on Market Overview
    • Executive Summary - Data Table on Market Overview
    • Executive Summary - Chart on Global Market Characteristics
    • Executive Summary - Chart on Market by Geography
    • Executive Summary - Chart on Market Segmentation by Application
    • Executive Summary - Chart on Market Segmentation by Type
    • Executive Summary - Chart on Market Segmentation by Technology
    • Executive Summary - Chart on Incremental Growth
    • Executive Summary - Data Table on Incremental Growth
    • Executive Summary - Chart on Company Market Positioning

2 Technavio Analysis

  • 2.1 Analysis of price sensitivity, lifecycle, customer purchase basket, adoption rates, and purchase criteria
    • Analysis of price sensitivity, lifecycle, customer purchase basket, adoption rates, and purchase criteria
  • 2.2 Criticality of inputs and Factors of differentiation
    • Overview on criticality of inputs and factors of differentiation
  • 2.3 Factors of disruption
    • Overview on factors of disruption
  • 2.4 Impact of drivers and challenges
    • Impact of drivers and challenges in 2024 and 2029

3 Market Landscape

  • 3.1 Market ecosystem
    • Parent Market
    • Data Table on - Parent Market
  • 3.2 Market characteristics
    • Market characteristics analysis
  • 3.3 Value chain analysis
    • Value chain analysis

4 Market Sizing

  • 4.1 Market definition
    • Offerings of companies included in the market definition
  • 4.2 Market segment analysis
    • Market segments
  • 4.3 Market size 2024
    • 4.4 Market outlook: Forecast for 2024-2029
      • Chart on Global - Market size and forecast 2024-2029 ($ million)
      • Data Table on Global - Market size and forecast 2024-2029 ($ million)
      • Chart on Global Market: Year-over-year growth 2024-2029 (%)
      • Data Table on Global Market: Year-over-year growth 2024-2029 (%)

    5 Historic Market Size

    • 5.1 Global Orthopedic 3D Printed Devices Market 2019 - 2023
      • Historic Market Size - Data Table on Global Orthopedic 3D Printed Devices Market 2019 - 2023 ($ million)
    • 5.2 Application segment analysis 2019 - 2023
      • Historic Market Size - Application Segment 2019 - 2023 ($ million)
    • 5.3 Type segment analysis 2019 - 2023
      • Historic Market Size - Type Segment 2019 - 2023 ($ million)
    • 5.4 Technology segment analysis 2019 - 2023
      • Historic Market Size - Technology Segment 2019 - 2023 ($ million)
    • 5.5 Geography segment analysis 2019 - 2023
      • Historic Market Size - Geography Segment 2019 - 2023 ($ million)
    • 5.6 Country segment analysis 2019 - 2023
      • Historic Market Size - Country Segment 2019 - 2023 ($ million)

    6 Qualitative Analysis

    • 6.1 Impact of AI in global orthopedic 3D printed devices market

      7 Five Forces Analysis

      • 7.1 Five forces summary
        • Five forces analysis - Comparison between 2024 and 2029
      • 7.2 Bargaining power of buyers
        • Bargaining power of buyers - Impact of key factors 2024 and 2029
      • 7.3 Bargaining power of suppliers
        • Bargaining power of suppliers - Impact of key factors in 2024 and 2029
      • 7.4 Threat of new entrants
        • Threat of new entrants - Impact of key factors in 2024 and 2029
      • 7.5 Threat of substitutes
        • Threat of substitutes - Impact of key factors in 2024 and 2029
      • 7.6 Threat of rivalry
        • Threat of rivalry - Impact of key factors in 2024 and 2029
      • 7.7 Market condition
        • Chart on Market condition - Five forces 2024 and 2029

      8 Market Segmentation by Application

      • 8.1 Market segments
        • Chart on Application - Market share 2024-2029 (%)
        • Data Table on Application - Market share 2024-2029 (%)
      • 8.2 Comparison by Application
        • Chart on Comparison by Application
        • Data Table on Comparison by Application
      • 8.3 Orthopedic implants - Market size and forecast 2024-2029
        • Chart on Orthopedic implants - Market size and forecast 2024-2029 ($ million)
        • Data Table on Orthopedic implants - Market size and forecast 2024-2029 ($ million)
        • Chart on Orthopedic implants - Year-over-year growth 2024-2029 (%)
        • Data Table on Orthopedic implants - Year-over-year growth 2024-2029 (%)
      • 8.4 Surgical planning - Market size and forecast 2024-2029
        • Chart on Surgical planning - Market size and forecast 2024-2029 ($ million)
        • Data Table on Surgical planning - Market size and forecast 2024-2029 ($ million)
        • Chart on Surgical planning - Year-over-year growth 2024-2029 (%)
        • Data Table on Surgical planning - Year-over-year growth 2024-2029 (%)
      • 8.5 Surgical instruments - Market size and forecast 2024-2029
        • Chart on Surgical instruments - Market size and forecast 2024-2029 ($ million)
        • Data Table on Surgical instruments - Market size and forecast 2024-2029 ($ million)
        • Chart on Surgical instruments - Year-over-year growth 2024-2029 (%)
        • Data Table on Surgical instruments - Year-over-year growth 2024-2029 (%)
      • 8.6 Market opportunity by Application
        • Market opportunity by Application ($ million)
        • Data Table on Market opportunity by Application ($ million)

      9 Market Segmentation by Type

      • 9.1 Market segments
        • Chart on Type - Market share 2024-2029 (%)
        • Data Table on Type - Market share 2024-2029 (%)
      • 9.2 Comparison by Type
        • Chart on Comparison by Type
        • Data Table on Comparison by Type
      • 9.3 Plastics - Market size and forecast 2024-2029
        • Chart on Plastics - Market size and forecast 2024-2029 ($ million)
        • Data Table on Plastics - Market size and forecast 2024-2029 ($ million)
        • Chart on Plastics - Year-over-year growth 2024-2029 (%)
        • Data Table on Plastics - Year-over-year growth 2024-2029 (%)
      • 9.4 Nylon - Market size and forecast 2024-2029
        • Chart on Nylon - Market size and forecast 2024-2029 ($ million)
        • Data Table on Nylon - Market size and forecast 2024-2029 ($ million)
        • Chart on Nylon - Year-over-year growth 2024-2029 (%)
        • Data Table on Nylon - Year-over-year growth 2024-2029 (%)
      • 9.5 Biomaterials - Market size and forecast 2024-2029
        • Chart on Biomaterials - Market size and forecast 2024-2029 ($ million)
        • Data Table on Biomaterials - Market size and forecast 2024-2029 ($ million)
        • Chart on Biomaterials - Year-over-year growth 2024-2029 (%)
        • Data Table on Biomaterials - Year-over-year growth 2024-2029 (%)
      • 9.6 Others - Market size and forecast 2024-2029
        • Chart on Others - Market size and forecast 2024-2029 ($ million)
        • Data Table on Others - Market size and forecast 2024-2029 ($ million)
        • Chart on Others - Year-over-year growth 2024-2029 (%)
        • Data Table on Others - Year-over-year growth 2024-2029 (%)
      • 9.7 Market opportunity by Type
        • Market opportunity by Type ($ million)
        • Data Table on Market opportunity by Type ($ million)

      10 Market Segmentation by Technology

      • 10.1 Market segments
        • Chart on Technology - Market share 2024-2029 (%)
        • Data Table on Technology - Market share 2024-2029 (%)
      • 10.2 Comparison by Technology
        • Chart on Comparison by Technology
        • Data Table on Comparison by Technology
      • 10.3 Stereolithography (SLA) - Market size and forecast 2024-2029
        • Chart on Stereolithography (SLA) - Market size and forecast 2024-2029 ($ million)
        • Data Table on Stereolithography (SLA) - Market size and forecast 2024-2029 ($ million)
        • Chart on Stereolithography (SLA) - Year-over-year growth 2024-2029 (%)
        • Data Table on Stereolithography (SLA) - Year-over-year growth 2024-2029 (%)
      • 10.4 Fused deposition modeling (FDM) - Market size and forecast 2024-2029
        • Chart on Fused deposition modeling (FDM) - Market size and forecast 2024-2029 ($ million)
        • Data Table on Fused deposition modeling (FDM) - Market size and forecast 2024-2029 ($ million)
        • Chart on Fused deposition modeling (FDM) - Year-over-year growth 2024-2029 (%)
        • Data Table on Fused deposition modeling (FDM) - Year-over-year growth 2024-2029 (%)
      • 10.5 Selective laser sintering (SLS) - Market size and forecast 2024-2029
        • Chart on Selective laser sintering (SLS) - Market size and forecast 2024-2029 ($ million)
        • Data Table on Selective laser sintering (SLS) - Market size and forecast 2024-2029 ($ million)
        • Chart on Selective laser sintering (SLS) - Year-over-year growth 2024-2029 (%)
        • Data Table on Selective laser sintering (SLS) - Year-over-year growth 2024-2029 (%)
      • 10.6 Electron beam melting (EBM) - Market size and forecast 2024-2029
        • Chart on Electron beam melting (EBM) - Market size and forecast 2024-2029 ($ million)
        • Data Table on Electron beam melting (EBM) - Market size and forecast 2024-2029 ($ million)
        • Chart on Electron beam melting (EBM) - Year-over-year growth 2024-2029 (%)
        • Data Table on Electron beam melting (EBM) - Year-over-year growth 2024-2029 (%)
      • 10.7 Others - Market size and forecast 2024-2029
        • Chart on Others - Market size and forecast 2024-2029 ($ million)
        • Data Table on Others - Market size and forecast 2024-2029 ($ million)
        • Chart on Others - Year-over-year growth 2024-2029 (%)
        • Data Table on Others - Year-over-year growth 2024-2029 (%)
      • 10.8 Market opportunity by Technology
        • Market opportunity by Technology ($ million)
        • Data Table on Market opportunity by Technology ($ million)

      11 Customer Landscape

      • 11.1 Customer landscape overview
        • Analysis of price sensitivity, lifecycle, customer purchase basket, adoption rates, and purchase criteria

      12 Geographic Landscape

      • 12.1 Geographic segmentation
        • Chart on Market share by geography 2024-2029 (%)
        • Data Table on Market share by geography 2024-2029 (%)
      • 12.2 Geographic comparison
        • Chart on Geographic comparison
        • Data Table on Geographic comparison
      • 12.3 North America - Market size and forecast 2024-2029
        • Chart on North America - Market size and forecast 2024-2029 ($ million)
        • Data Table on North America - Market size and forecast 2024-2029 ($ million)
        • Chart on North America - Year-over-year growth 2024-2029 (%)
        • Data Table on North America - Year-over-year growth 2024-2029 (%)
      • 12.4 Europe - Market size and forecast 2024-2029
        • Chart on Europe - Market size and forecast 2024-2029 ($ million)
        • Data Table on Europe - Market size and forecast 2024-2029 ($ million)
        • Chart on Europe - Year-over-year growth 2024-2029 (%)
        • Data Table on Europe - Year-over-year growth 2024-2029 (%)
      • 12.5 Asia - Market size and forecast 2024-2029
        • Chart on Asia - Market size and forecast 2024-2029 ($ million)
        • Data Table on Asia - Market size and forecast 2024-2029 ($ million)
        • Chart on Asia - Year-over-year growth 2024-2029 (%)
        • Data Table on Asia - Year-over-year growth 2024-2029 (%)
      • 12.6 Rest of World (ROW) - Market size and forecast 2024-2029
        • Chart on Rest of World (ROW) - Market size and forecast 2024-2029 ($ million)
        • Data Table on Rest of World (ROW) - Market size and forecast 2024-2029 ($ million)
        • Chart on Rest of World (ROW) - Year-over-year growth 2024-2029 (%)
        • Data Table on Rest of World (ROW) - Year-over-year growth 2024-2029 (%)
      • 12.7 US - Market size and forecast 2024-2029
        • Chart on US - Market size and forecast 2024-2029 ($ million)
        • Data Table on US - Market size and forecast 2024-2029 ($ million)
        • Chart on US - Year-over-year growth 2024-2029 (%)
        • Data Table on US - Year-over-year growth 2024-2029 (%)
      • 12.8 Germany - Market size and forecast 2024-2029
        • Chart on Germany - Market size and forecast 2024-2029 ($ million)
        • Data Table on Germany - Market size and forecast 2024-2029 ($ million)
        • Chart on Germany - Year-over-year growth 2024-2029 (%)
        • Data Table on Germany - Year-over-year growth 2024-2029 (%)
      • 12.9 China - Market size and forecast 2024-2029
        • Chart on China - Market size and forecast 2024-2029 ($ million)
        • Data Table on China - Market size and forecast 2024-2029 ($ million)
        • Chart on China - Year-over-year growth 2024-2029 (%)
        • Data Table on China - Year-over-year growth 2024-2029 (%)
      • 12.10 UK - Market size and forecast 2024-2029
        • Chart on UK - Market size and forecast 2024-2029 ($ million)
        • Data Table on UK - Market size and forecast 2024-2029 ($ million)
        • Chart on UK - Year-over-year growth 2024-2029 (%)
        • Data Table on UK - Year-over-year growth 2024-2029 (%)
      • 12.11 Canada - Market size and forecast 2024-2029
        • Chart on Canada - Market size and forecast 2024-2029 ($ million)
        • Data Table on Canada - Market size and forecast 2024-2029 ($ million)
        • Chart on Canada - Year-over-year growth 2024-2029 (%)
        • Data Table on Canada - Year-over-year growth 2024-2029 (%)
      • 12.12 France - Market size and forecast 2024-2029
        • Chart on France - Market size and forecast 2024-2029 ($ million)
        • Data Table on France - Market size and forecast 2024-2029 ($ million)
        • Chart on France - Year-over-year growth 2024-2029 (%)
        • Data Table on France - Year-over-year growth 2024-2029 (%)
      • 12.13 Japan - Market size and forecast 2024-2029
        • Chart on Japan - Market size and forecast 2024-2029 ($ million)
        • Data Table on Japan - Market size and forecast 2024-2029 ($ million)
        • Chart on Japan - Year-over-year growth 2024-2029 (%)
        • Data Table on Japan - Year-over-year growth 2024-2029 (%)
      • 12.14 Italy - Market size and forecast 2024-2029
        • Chart on Italy - Market size and forecast 2024-2029 ($ million)
        • Data Table on Italy - Market size and forecast 2024-2029 ($ million)
        • Chart on Italy - Year-over-year growth 2024-2029 (%)
        • Data Table on Italy - Year-over-year growth 2024-2029 (%)
      • 12.15 India - Market size and forecast 2024-2029
        • Chart on India - Market size and forecast 2024-2029 ($ million)
        • Data Table on India - Market size and forecast 2024-2029 ($ million)
        • Chart on India - Year-over-year growth 2024-2029 (%)
        • Data Table on India - Year-over-year growth 2024-2029 (%)
      • 12.16 Mexico - Market size and forecast 2024-2029
        • Chart on Mexico - Market size and forecast 2024-2029 ($ million)
        • Data Table on Mexico - Market size and forecast 2024-2029 ($ million)
        • Chart on Mexico - Year-over-year growth 2024-2029 (%)
        • Data Table on Mexico - Year-over-year growth 2024-2029 (%)
      • 12.17 Market opportunity by geography
        • Market opportunity by geography ($ million)
        • Data Tables on Market opportunity by geography ($ million)

      13 Drivers, Challenges, and Opportunity/Restraints

      • 13.1 Market drivers
        • 13.2 Market challenges
          • 13.3 Impact of drivers and challenges
            • Impact of drivers and challenges in 2024 and 2029
          • 13.4 Market opportunities/restraints

            14 Competitive Landscape

            • 14.1 Overview
              • 14.2 Competitive Landscape
                • Overview on criticality of inputs and factors of differentiation
              • 14.3 Landscape disruption
                • Overview on factors of disruption
              • 14.4 Industry risks
                • Impact of key risks on business

              15 Competitive Analysis

              • 15.1 Companies profiled
                • Companies covered
              • 15.2 Company ranking index
                • Company ranking index
              • 15.3 Market positioning of companies
                • Matrix on companies position and classification
              • 3D Systems Corp.
                • 3D Systems Corp. - Overview
                • 3D Systems Corp. - Business segments
                • 3D Systems Corp. - Key news
                • 3D Systems Corp. - Key offerings
                • 3D Systems Corp. - Segment focus
                • SWOT
              • 15.5 Biomedical Modeling Inc.
                • Biomedical Modeling Inc. - Overview
                • Biomedical Modeling Inc. - Product / Service
                • Biomedical Modeling Inc. - Key offerings
                • SWOT
              • 15.6 Dimension Inx.
                • Dimension Inx. - Overview
                • Dimension Inx. - Product / Service
                • Dimension Inx. - Key offerings
                • SWOT
              • 15.7 EOS GmbH
                • EOS GmbH - Overview
                • EOS GmbH - Product / Service
                • EOS GmbH - Key news
                • EOS GmbH - Key offerings
                • SWOT
              • 15.8 Formlabs Inc.
                • Formlabs Inc. - Overview
                • Formlabs Inc. - Product / Service
                • Formlabs Inc. - Key offerings
                • SWOT
              • 15.9 General Electric Co.
                • General Electric Co. - Overview
                • General Electric Co. - Business segments
                • General Electric Co. - Key news
                • General Electric Co. - Key offerings
                • General Electric Co. - Segment focus
                • SWOT
              • 15.10 Johnson and Johnson Services Inc.
                • Johnson and Johnson Services Inc. - Overview
                • Johnson and Johnson Services Inc. - Business segments
                • Johnson and Johnson Services Inc. - Key news
                • Johnson and Johnson Services Inc. - Key offerings
                • Johnson and Johnson Services Inc. - Segment focus
                • SWOT
              • 15.11 MATERIALISE NV
                • MATERIALISE NV - Overview
                • MATERIALISE NV - Business segments
                • MATERIALISE NV - Key news
                • MATERIALISE NV - Key offerings
                • MATERIALISE NV - Segment focus
                • SWOT
              • 15.12 Medtronic Plc
                • Medtronic Plc - Overview
                • Medtronic Plc - Business segments
                • Medtronic Plc - Key news
                • Medtronic Plc - Key offerings
                • Medtronic Plc - Segment focus
                • SWOT
              • 15.13 Osteo3d
                • Osteo3d - Overview
                • Osteo3d - Product / Service
                • Osteo3d - Key offerings
                • SWOT
              • 15.14 Renishaw Plc
                • Renishaw Plc - Overview
                • Renishaw Plc - Business segments
                • Renishaw Plc - Key offerings
                • Renishaw Plc - Segment focus
                • SWOT
              • 15.15 SLM Solutions Group AG
                • SLM Solutions Group AG - Overview
                • SLM Solutions Group AG - Business segments
                • SLM Solutions Group AG - Key offerings
                • SLM Solutions Group AG - Segment focus
                • SWOT
              • 15.16 Smith and Nephew plc
                • Smith and Nephew plc - Overview
                • Smith and Nephew plc - Business segments
                • Smith and Nephew plc - Key news
                • Smith and Nephew plc - Key offerings
                • Smith and Nephew plc - Segment focus
                • SWOT
              • 15.17 Stratasys Ltd.
                • Stratasys Ltd. - Overview
                • Stratasys Ltd. - Product / Service
                • Stratasys Ltd. - Key news
                • Stratasys Ltd. - Key offerings
                • SWOT
              • 15.18 Zimmer Biomet Holdings Inc.
                • Zimmer Biomet Holdings Inc. - Overview
                • Zimmer Biomet Holdings Inc. - Business segments
                • Zimmer Biomet Holdings Inc. - Key news
                • Zimmer Biomet Holdings Inc. - Key offerings
                • Zimmer Biomet Holdings Inc. - Segment focus
                • SWOT

              16 Appendix

              • 16.1 Scope of the report
                • 16.2 Inclusions and exclusions checklist
                  • Inclusions checklist
                  • Exclusions checklist
                • 16.3 Currency conversion rates for US$
                  • Currency conversion rates for US$
                • 16.4 Research methodology
                  • Research methodology
                • 16.5 Data procurement
                  • Information sources
                • 16.6 Data validation
                  • Data validation
                • 16.7 Validation techniques employed for market sizing
                  • Validation techniques employed for market sizing
                • 16.8 Data synthesis
                  • Data synthesis
                • 16.9 360 degree market analysis
                  • 360 degree market analysis
                • 16.10 List of abbreviations
                  • List of abbreviations

                Research Methodology

                Technavio presents a detailed picture of the market by way of study, synthesis, and summation of data from multiple sources. The analysts have presented the various facets of the market with a particular focus on identifying the key industry influencers. The data thus presented is comprehensive, reliable, and the result of extensive research, both primary and secondary.

                INFORMATION SOURCES

                Primary sources

                • Manufacturers and suppliers
                • Channel partners
                • Industry experts
                • Strategic decision makers

                Secondary sources

                • Industry journals and periodicals
                • Government data
                • Financial reports of key industry players
                • Historical data
                • Press releases

                DATA ANALYSIS

                Data Synthesis

                • Collation of data
                • Estimation of key figures
                • Analysis of derived insights

                Data Validation

                • Triangulation with data models
                • Reference against proprietary databases
                • Corroboration with industry experts

                REPORT WRITING

                Qualitative

                • Market drivers
                • Market challenges
                • Market trends
                • Five forces analysis

                Quantitative

                • Market size and forecast
                • Market segmentation
                • Geographical insights
                • Competitive landscape

                Interested in this report?

                Get your sample now to see our research methodology and insights!

                Download Now

                Frequently Asked Questions

                Orthopedic 3D Printed Devices market growth will increase by $ 2057.9 mn during 2025-2029 .

                The Orthopedic 3D Printed Devices market is expected to grow at a CAGR of 20.2% during 2025-2029 .

                Orthopedic 3D Printed Devices market is segmented by Application( Orthopedic implants, Surgical planning, Surgical instruments) Type( Plastics, Nylon, Biomaterials, Others, MEA) Technology( Stereolithography (SLA), Fused deposition modeling (FDM), Selective laser sintering (SLS), Electron beam melting (EBM), Others)

                3D Systems Corp., Biomedical Modeling Inc., Dimension Inx., EOS GmbH, Formlabs Inc., General Electric Co., Johnson and Johnson Services Inc., MATERIALISE NV, Medtronic Plc, Osteo3d, Renishaw Plc, SLM Solutions Group AG, Smith and Nephew plc, Stratasys Ltd., Ultimaker BV, Zimmer Biomet Holdings Inc. are a few of the key vendors in the Orthopedic 3D Printed Devices market.

                North America will register the highest growth rate of 39% among the other regions. Therefore, the Orthopedic 3D Printed Devices market in North America is expected to garner significant business opportunities for the vendors during the forecast period.

                US, Germany, China, UK, Canada, France, Italy, Japan, India, Mexico

                • Increased demand for personalized or customized orthopedic devices3D printing technologies are increasingly being used to develop patient-matched (or patient-specific) devices and surgical instrumentation by using a patients own medical imaging. The nature of additive layer manufacturing in 3D printing enables clinicians to fabricate customized implants that involve complex shapes and geometric features. This facilitates the creation of porous engineered structures is the driving factor this market.
                • tortuous internal channels is the driving factor this market.
                • and internal support structures is the driving factor this market.
                • all of which would not be possible using conventional subtractive manufacturing techniques is the driving factor this market.
                • irrespective of the costs. Therefore is the driving factor this market.
                • 3D printing is increasingly being used to fabricate patient-specific devices for various orthopedic applications is the driving factor this market.
                • especially in the development of standard and complex customized prosthetic limbs.Traditionally is the driving factor this market.
                • hitherto is the driving factor this market.
                • prostheses have been manufactured only in a limited number of sizes. While this method reduces cost is the driving factor this market.
                • it also has limitations is the driving factor this market.
                • such as reduced patient comfort and limited lifespan of the hardware. Customized prostheses can overcome many of the limitations of conventionally manufactured prostheses. 3D printing speeds up the manufacturing process significantly and makes the prostheses thus manufactured not only relatively less costly but also as effective as those manufactured using traditional manufacturing processes. The US FDA has already approved many 3D-printed prostheses is the driving factor this market.
                • including joint prostheses. The use of 3D implants can significantly reduce the cosmetic deformities associated with such surgeries. 3D printing is increasingly being used in the construction of custom joint prostheses. Such 3D printed is the driving factor this market.
                • customized prosthetics not only suit and fit the wearer but also offer enhanced patient comfort. The low cost of these products makes them particularly suitable for children is the driving factor this market.
                • who tend to outgrow their prosthetic limbs very quickly.3D printing is also finding increasing application in the development of customized surgical implants. As 3D printing can quickly produce customized surgical implants is the driving factor this market.
                • it solves an important problem in orthopedics is the driving factor this market.
                • namely is the driving factor this market.
                • that traditional implants are often unsatisfactory for a significant number of patients is the driving factor this market.
                • especially in complex cases. Traditionally is the driving factor this market.
                • surgeons had to perform bone graft surgeries or use scalpels and drills to modify surgical implants by shaving off pieces of metal and plastic to the required shape is the driving factor this market.
                • size is the driving factor this market.
                • and fit. Therefore is the driving factor this market.
                • 3D printing is an effective solution for such patients as customized implants can be designed to fit precisely into any anatomical defects or malformations. Thus is the driving factor this market.
                • the global orthopedic 3D printed devices market is expected to witness growth during the forecast period. is the driving factor this market.

                The Orthopedic 3D Printed Devices market vendors should focus on grabbing business opportunities from the Orthopedic implants segment as it accounted for the largest market share in the base year.