Orthopedic Plates And Screws Market Size 2025-2029
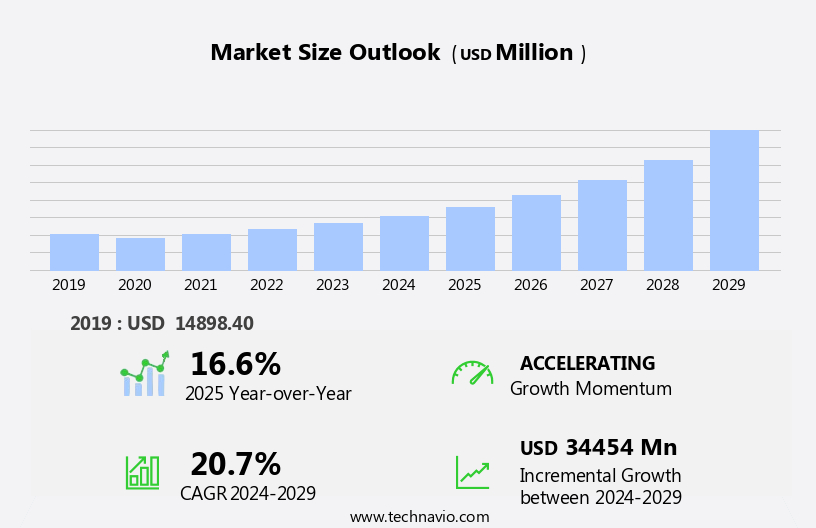
The orthopedic plates and screws market size is forecast to increase by USD 34.45 billion at a CAGR of 20.7% between 2024 and 2029.
- The market is experiencing significant growth, driven by the increasing prevalence of orthopedic conditions worldwide. According to the World Health Organization, musculoskeletal conditions account for an estimated 14% of the global burden of disease. This trend is particularly pronounced in emerging markets and untapped regions, where the burden of orthopedic conditions is increasing due to aging populations, urbanization, and lifestyle changes. However, the market faces challenges that may hinder its growth potential. Regulatory hurdles impact adoption, as stringent regulations and lengthy approval processes can delay market entry for new orthopedic implants. Furthermore, the high costs associated with these implants can limit accessibility, particularly in low-income countries and uninsured populations. These devices, which include insulin pumps, cosmetic implants, orthopedic implants such as knee replacements and spinal implants, ventricular assist devices, neurostimulation devices, dental implants, and implantable MRI systems, are transforming healthcare services.
- Supply chain inconsistencies can also pose challenges, as the demand for orthopedic implants can be unpredictable, making it difficult for manufacturers to maintain a consistent supply. Companies seeking to capitalize on market opportunities and navigate challenges effectively must focus on developing cost-effective solutions, navigating regulatory landscapes, and building robust supply chains.
What will be the Size of the Orthopedic Plates And Screws Market during the forecast period?
- The market encompasses a range of products, including joint replacement devices, trauma devices, spinal devices, and external fixation systems. Advanced technologies, such as finite element analysis and computer-aided engineering, are increasingly utilized in the design and development of these devices for improved biomechanical testing and surgical planning. Pre-operative planning using image-guided surgery and surgical navigation systems enhances accuracy and reduces healthcare costs. Orthopedic implants market growth is driven by the rising prevalence of musculoskeletal disorders, increasing demand for minimally invasive procedures, and the aging population. Patient education and payor landscape dynamics also influence market trends. Additionally, the increasing prevalence of chronic diseases like diabetes and cardiovascular conditions necessitates the development of more advanced and cost-effective implantable medical devices for chronic disease management. The market is expected to witness significant growth in the coming years, particularly in areas such as extremities, cardiac pacemakers, and insulin pumps.
- Anti-bacterial coatings, corrosion resistance, and biocompatible coatings are essential features for implants, ensuring economic outcomes, clinical outcomes, functional outcomes, and patient satisfaction. The surgical implants market continues to evolve with advancements in biomechanical testing, bone grafting, and bone morphogenetic protein technology. Surgical simulation and quality of life assessments are crucial for assessing the impact of these devices on patients.
How is this Orthopedic Plates And Screws Industry segmented?
The orthopedic plates and screws industry research report provides comprehensive data (region-wise segment analysis), with forecasts and estimates in "USD million" for the period 2025-2029, as well as historical data from 2019-2023 for the following segments.
- End-user
- Hospitals
- Ambulatory surgery centers
- Type
- Plates
- Screws
- Material
- Titanium
- Stainless steel
- Bioabsorbable
- PEEK polymer
- Application
- Fracture Fixation
- Spinal Fusion
- CMF Surgeries
- Joint Replacement
- Geography
- North America
- US
- Canada
- Europe
- France
- Germany
- Italy
- UK
- APAC
- China
- India
- Japan
- South America
- Brazil
- Rest of World (ROW)
- North America
By End-user Insights
The hospitals segment is estimated to witness significant growth during the forecast period. Orthopedic plates and screws are essential components in the healthcare industry, particularly in hospitals, where they play a crucial role in the treatment of various orthopedic conditions. The demand for these implants is driven by the rising prevalence of orthopedic diseases, including osteoarthritis, fractures, and sports injuries, which necessitate surgical interventions. The elderly population is another significant factor fueling the demand for orthopedic plates and screws, given their increased susceptibility to orthopedic conditions. Advancements in material science have led to the development of biocompatible materials for orthopedic implants, ensuring better patient outcomes and faster bone healing.
Implant manufacturers are also investing in research and development to create smart implants, which can improve surgical techniques and enhance patient care. These advancements have led to the increased acceptance of minimally invasive surgical procedures, which require fewer orthopedic plates and screws but offer faster recovery times and reduced post-operative care. The supply chain for orthopedic plates and screws is a complex one, involving numerous stakeholders, including orthopedic surgeons, healthcare providers, insurance companies, and regulatory agencies. Government agencies play a critical role in ensuring the safety and efficacy of these implants through regulatory approval processes.
Clinical trials and research studies are also essential to validate the safety and effectiveness of new orthopedic implant technologies. Orthopedic surgeons are at the forefront of using the latest orthopedic plates and screw technologies to provide optimal care to their patients. Personalized medicine and tissue engineering are emerging trends in orthopedic surgery, with 3D printing and additive manufacturing playing a significant role in creating customized implants. Robotic surgery and digital surgery are also transforming the way orthopedic procedures are performed, offering greater precision and accuracy. Bone fixation devices, such as laminar hooks, dynamic compression plates, pedicle screws, and locking plates, are essential in orthopedic surgery, particularly in spinal surgery and joint replacement procedures.
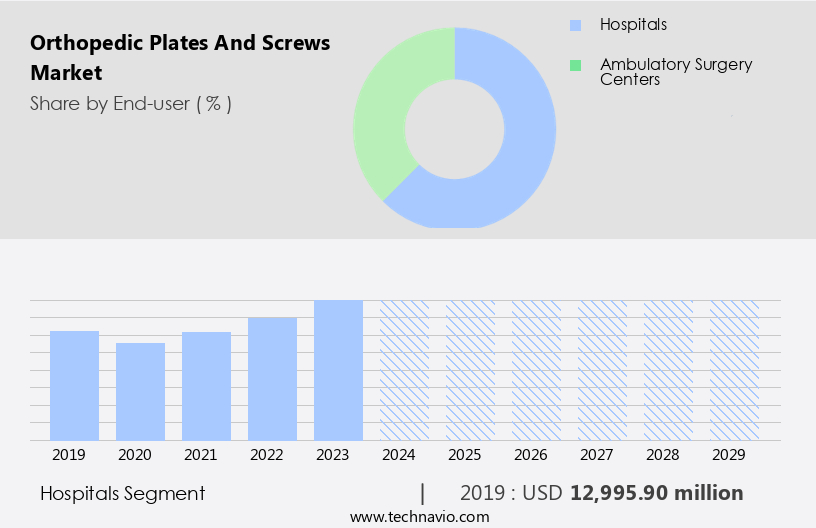
The Hospitals segment was valued at USD 13 billion in 2019 and showed a gradual increase during the forecast period. Stainless steel and titanium implants are commonly used due to their biocompatibility and durability. However, there is growing interest in bioresorbable materials and stem cells for orthopedic implants, as they offer the potential for natural bone healing and reduced reliance on surgical interventions. The market is dynamic and evolving, driven by advancements in material science, surgical techniques, and regulatory approval processes. Hospitals and healthcare providers are investing in the latest technologies to provide optimal care to their patients, while implant manufacturers are working to meet the expanding demands of the market. The market is expected to continue growing, offering significant opportunities for innovation and growth in the medical devices industry.
Regional Analysis
North America is estimated to contribute 50% to the growth of the global market during the forecast period. Technavio's analysts have elaborately explained the regional trends and drivers that shape the market during the forecast period.
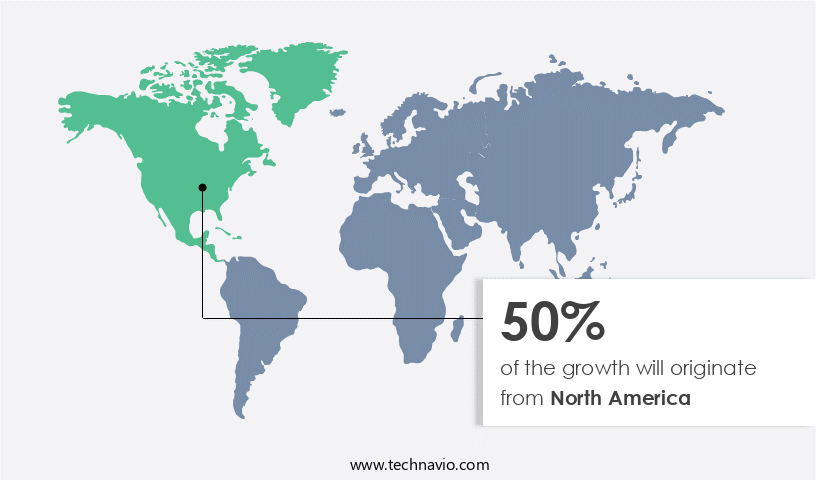
The market in North America is experiencing steady growth, driven by the increasing prevalence of orthopedic conditions, advancements in material science, and technological innovations. Orthopedic surgeons are increasingly utilizing biocompatible materials, such as stainless steel and titanium implants, for procedures like fracture repair, joint replacement, and spinal surgery. These implants are engineered to ensure optimal patient outcomes and are integral to the recovery process. The supply chain for orthopedic implants is streamlined, with healthcare providers and insurance companies collaborating to ensure timely access to these essential medical devices. Clinical trials and regulatory approval processes are rigorous, ensuring the safety and efficacy of new products, such as smart implants and locking plates.
Material science continues to evolve, with the integration of 3D printing, additive manufacturing, and tissue engineering in the production of orthopedic implants. This results in more personalized and effective solutions for patients, addressing the unique needs of individual cases. Minimally invasive surgical techniques, such as the use of laminar hooks and dynamic compression plates, are gaining popularity due to their reduced recovery time and lower risk of complications. Robotic surgery and digital surgery are also increasingly being adopted to enhance precision and accuracy during procedures. Government agencies and non-profit organizations are playing a crucial role in raising awareness about orthopedic conditions and advocating for research and development in the field. Devices include implantable cardiac pacemakers, implantable cardioverter defibrillators, implantable hearing devices, implantable shock absorbers, neurostimulators, and ventricular assist devices.
This, in turn, is fueling innovation and driving market growth. The medical devices industry is continually investing in research and development to create advanced implantable devices, such as stem cell therapies and bioresorbable materials, to address the complex needs of orthopedic patients. These advancements are expected to significantly impact patient outcomes and shape the future of orthopedic care.
Market Dynamics
Our researchers analyzed the data with 2024 as the base year, along with the key drivers, trends, and challenges. A holistic analysis of drivers will help companies refine their marketing strategies to gain a competitive advantage.
What are the Orthopedic Plates And Screws market drivers leading to the rise in the adoption of Industry?
- The market is significantly driven by the rising prevalence of various orthopedic conditions. This trend is attributed to an aging population, increasing obesity rates, and sedentary lifestyles, leading to a higher demand for orthopedic treatments and solutions. The market is experiencing steady growth due to the increasing prevalence of orthopedic conditions, which pose a significant health challenge for individuals of all ages and strain healthcare systems. This trend is driven by several factors, including the aging population. As people age, the risk of developing degenerative musculoskeletal conditions, such as osteoarthritis, osteoporosis, and spinal disorders, increases. Aging joints and bones become more susceptible to wear and tear, leading to a higher demand for orthopedic interventions. Advancements in orthopedic technology, such as titanium implants, pedicle screws, locking plates, and spinal surgery techniques, are also contributing to market growth.
- Clinical trials and surgical techniques continue to evolve, improving patient outcomes and reducing recovery times. Personalized medicine and 3D printing are emerging trends in the orthopedic industry, offering customized solutions for individual patients. Orthopedic surgeons are increasingly adopting these advanced technologies and techniques to provide better care for their patients. The market is expected to continue growing as the demand for effective orthopedic solutions increases. Overall, the market is a dynamic and innovative industry, driven by the need to address the growing burden of orthopedic conditions and improve patient outcomes.
What are the Orthopedic Plates And Screws market trends shaping the Industry?
- The trend in the business world is shifting towards emerging markets and previously untapped regions. These areas offer significant growth opportunities for professionals and organizations. The market holds promising opportunities for growth in emerging markets and untapped regions. These areas exhibit expanding healthcare infrastructure, leading to the development of new hospitals, clinics, and surgical facilities. This growth in healthcare infrastructure fosters a favorable environment for the adoption of advanced orthopedic procedures and implants. Moreover, the increasing number of orthopedic surgical procedures in these regions is driven by rising healthcare awareness and access. Orthopedic plates and screws play a crucial role in fracture repair and bone healing, making them essential implantable devices in orthopedic surgery. Innovations in orthopedic technology, such as self-tapping screws and cannulated screws, contribute to the market's expansion.
- Digital surgery and biomaterials science are also transforming the orthopedic industry, offering potential solutions for improved patient outcomes and streamlined post-operative care. Regulatory approval processes are essential in ensuring the safety and efficacy of orthopedic plates and screws. Companies invest in research and development to meet these requirements and introduce innovative products to the market. Additive manufacturing is another emerging trend in the orthopedic industry, offering customized implant solutions and potential cost savings. The integration of technology in healthcare, such as digital surgery, is expected to further revolutionize the market. The market is poised for growth, driven by the increasing demand for advanced medical interventions and the expanding healthcare infrastructure in emerging markets and untapped regions. The potential of this market lies in its ability to address the unique needs of these areas and offer innovative solutions in the realm of fracture repair and bone healing.
How does Orthopedic Plates And Screws market faces challenges face during its growth?
- The escalating costs linked to orthopedic implants pose a significant challenge and hinder the expansion of the industry. The market encompasses advanced medical devices used in bone fixation during trauma surgery and tissue engineering. Factors driving the market's growth include advancements in technology, such as robotic surgery, and the integration of regenerative medicine through the use of stem cells and bioresorbable materials. These innovations aim to improve patient outcomes and reduce recovery time. The high costs of orthopedic implants, including plates and screws, stem from the extensive research and development process. Companies invest substantially in R&D to innovate materials, technologies, and implant designs. High-quality materials, like titanium and specialized alloys, are crucial due to their biocompatibility and strength.
- These factors contribute to the overall expense of orthopedic implants. Moreover, insurance companies play a significant role in the market dynamics, as they often cover a portion of the costs for patients. The medical devices industry continues to evolve, with a focus on producing more efficient and effective implants to meet the growing demand. The market is shaped by various factors, including R&D investments, material costs, and insurance coverage, ultimately impacting the affordability and accessibility of these essential medical devices.
Exclusive Customer Landscape
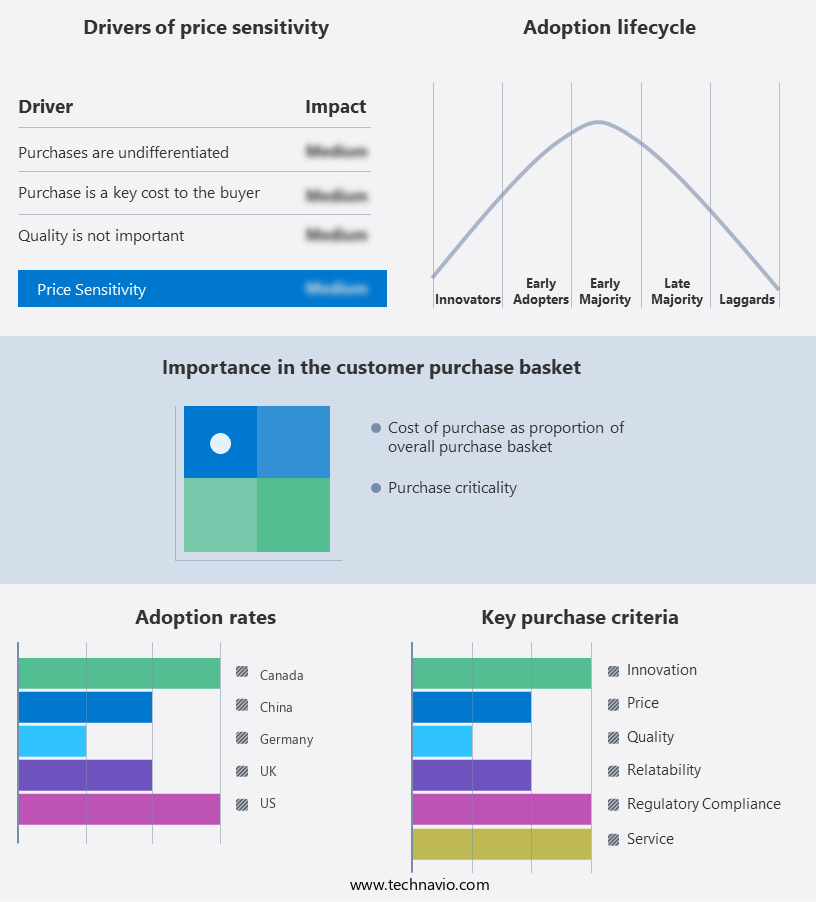
The orthopedic plates and screws market forecasting report includes the adoption lifecycle of the market, covering from the innovator's stage to the laggard's stage. It focuses on adoption rates in different regions based on penetration. Furthermore, the orthopedic plates and screws market report also includes key purchase criteria and drivers of price sensitivity to help companies evaluate and develop their market growth analysis strategies.
Customer Landscape
Key Companies & Market Insights
Companies are implementing various strategies, such as strategic alliances, orthopedic plates and screws market forecast, partnerships, mergers and acquisitions, geographical expansion, and product/service launches, to enhance their presence in the industry.
aap Implantate AG - The company specializes in the production and distribution of advanced orthopedic solutions such as orthopedic plates snd screws.
The industry research and growth report includes detailed analyses of the competitive landscape of the market and information about key companies, including:
- aap Implantate AG
- Advanced Orthopaedic Solutions
- Arthrex Inc.
- B.Braun SE
- Conmed Corp.
- Enovis Corp.
- Flower Orthopedics Corp.
- Globus Medical Inc.
- Integra LifeSciences Holdings Corp.
- Johnson and Johnson
- Medartis Holding AG
- Medtronic Plc
- MicroPort Scientific Corp.
- Orthofix Medical Inc.
- Orthopaedic Implant Co.
- Smith and Nephew plc
- Stryker Corp.
- Zimmer Biomet Holdings Inc.
Qualitative and quantitative analysis of companies has been conducted to help clients understand the wider business environment as well as the strengths and weaknesses of key industry players. Data is qualitatively analyzed to categorize companies as pure play, category-focused, industry-focused, and diversified; it is quantitatively analyzed to categorize companies as dominant, leading, strong, tentative, and weak.
Recent Development and News in Orthopedic Plates And Screws Market
- In February 2024, Stryker Corporation announced the launch of the Resolution Advanced Total Ankle System, a new orthopedic implant designed to provide improved patient outcomes through enhanced durability and mobility. This innovation marks a significant advancement in total ankle replacement technology (Stryker Corporation, 2024).
- In October 2024, Smith & Nephew Plc completed the acquisition of Osiris Therapeutics, a leading regenerative medicine company. This strategic move enables Smith & Nephew to expand its portfolio with advanced tissue regeneration technologies, enhancing its position in the orthopedic market (Smith & Nephew Plc, 2024).
- In March 2025, the US Food and Drug Administration (FDA) granted 510(k) clearance to DePuy Synthes, a Johnson & Johnson company, for its new Synthes Titanium Elite Locking Compression Plate System. This approval allows the company to market its advanced plate system, which offers improved screw design and enhanced stability for fracture fixation (DePuy Synthes, 2025).
Research Analyst Overview
The market continues to evolve, driven by advancements in material science and surgical techniques. Biocompatible materials, such as stainless steel and titanium, remain staples in implantable devices, while smart implants and self-tapping screws enhance bone fixation and facilitate minimally invasive surgery. Cannulated screws and locking plates optimize surgical precision and improve patient outcomes. Additive manufacturing and digital surgery are transforming the industry, enabling personalized medicine and customized implants. Healthcare providers and insurers grapple with the implications of these innovations on the supply chain and regulatory approval processes. Biomaterials science and tissue engineering advancements pave the way for bone healing and regenerative medicine applications. Neurostimulation devices, including neurostimulators, provide relief for individuals with Parkinson's disease and epilepsy.
Spinal surgery, joint replacement, and trauma surgery benefit from these developments, as orthopedic surgeons adopt new surgical techniques and robotic assistance. Government agencies and clinical trials play a crucial role in ensuring safety and efficacy, while the medical devices industry adapts to the dynamic market landscape. Pedicle screws, dynamic compression plates, and laminar hooks are some of the key orthopedic devices undergoing continuous innovation. Bioresorbable materials and stem cells offer promising avenues for future research, as the market unfolds with new applications and evolving patterns. Orthopedic implants, such as those used for knee replacement and hip fractures, are another growing segment of the market. The ongoing integration of technology and science in orthopedics promises to revolutionize patient care and treatment options.
Dive into Technavio's strong research methodology, blending expert interviews, extensive data synthesis, and validated models for unparalleled Orthopedic Plates And Screws Market insights. See full methodology.
|
Market Scope |
|
|
Report Coverage |
Details |
|
Page number |
229 |
|
Base year |
2024 |
|
Historic period |
2019-2023 |
|
Forecast period |
2025-2029 |
|
Growth momentum & CAGR |
Accelerate at a CAGR of 20.7% |
|
Market growth 2025-2029 |
USD 34.45 billion |
|
Market structure |
Fragmented |
|
YoY growth 2024-2025(%) |
16.6 |
|
Key countries |
US, Germany, China, Canada, UK, India, France, Japan, Italy, and Brazil |
|
Competitive landscape |
Leading Companies, Market Positioning of Companies, Competitive Strategies, and Industry Risks |
What are the Key Data Covered in this Orthopedic Plates And Screws Market Research and Growth Report?
- CAGR of the Orthopedic Plates And Screws industry during the forecast period
- Detailed information on factors that will drive the growth and forecasting between 2025 and 2029
- Precise estimation of the size of the market and its contribution of the industry in focus to the parent market
- Accurate predictions about upcoming growth and trends and changes in consumer behaviour
- Growth of the market across North America, Europe, Asia, and Rest of World (ROW)
- Thorough analysis of the market's competitive landscape and detailed information about companies
- Comprehensive analysis of factors that will challenge the orthopedic plates and screws market growth of industry companies
We can help! Our analysts can customize this orthopedic plates and screws market research report to meet your requirements.
 RIA -
RIA - 
