Osteoarthritis Therapeutics Market Analysis North America, Europe, Asia, Rest of World (ROW) - US, UK, Japan, Germany, China - Size and Forecast 2024-2028

Osteoarthritis Therapeutics Market Analysis North America, Europe, Asia, Rest of World (ROW) - US, UK, Japan, Germany, China - Size and Forecast 2024-2028

Published: May 2024 177 Pages SKU: IRTNTR43212

Market Overview at a Glance

$4.57 B
Market Opportunity
9.49%
CAGR
8.45
YoY growth 2023-2024(%)

Osteoarthritis Therapeutics Market Size 2024-2028

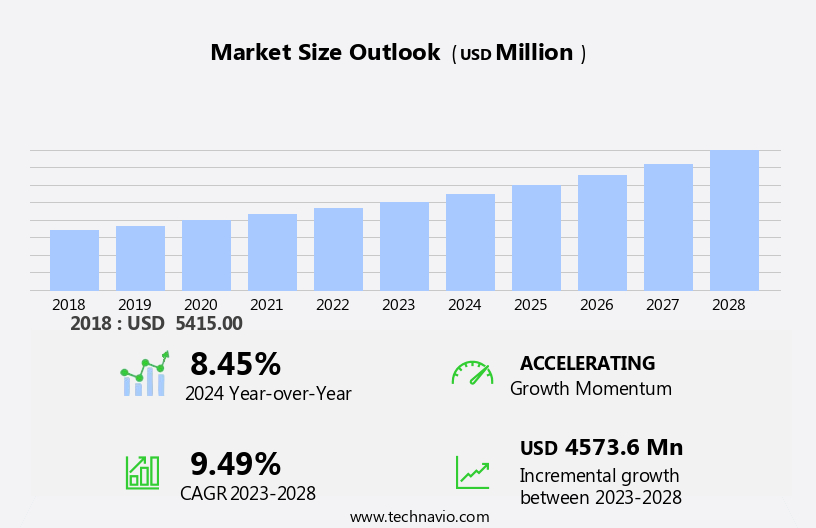
The osteoarthritis therapeutics market size is forecast to increase by USD 4.57 billion at a CAGR of 9.49% between 2023 and 2028.

  • The osteoarthritis treatment market is experiencing significant growth due to the rising prevalence of this chronic disease and the expanding research and development in this field. The high cost of treatment is a significant market driver, as patients often require long-term care and multiple therapies to manage their symptoms. Companies are focusing on developing cost-effective treatments, such as hyaluronic acid products, to address this challenge. Inflation also plays a role in market growth, as the cost of living increases and patients seek affordable treatment options. Overall, the market is expected to continue expanding, driven by the increasing burden of chronic diseases and the ongoing research and development efforts.

What will be the Size of the Osteoarthritis Therapeutics Market During the Forecast Period?

Osteoarthritis Therapeutics Market Size

 Request Free Sample

  • Osteoarthritis (OA), a chronic degenerative joint disease, affects millions of individuals, leading to significant pain and disability. The market is witnessing steady growth due to the increasing prevalence of the disease and the unmet medical need for effective treatments. The current market for OA therapeutics comprises various classes of drugs, including pain relievers, topical agents, intra-articular agents, and nutraceuticals. Pain medications, such as nonsteroidal anti-inflammatory drugs (NSAIDs) and opioids, are commonly used for symptomatic relief. However, these medications come with potential side effects, including gastrointestinal issues and an increased risk of cardiovascular events.
  • The demand for noninvasive approaches is on the rise, as patients seek alternatives to surgery and long-term use of pain medications. Topical agents, such as capsaicin and menthol, offer localized pain relief with minimal systemic side effects. Intra-articular agents, including hyaluronic acid products, provide direct delivery of therapeutics to the affected joint. Novel therapeutics, such as fibroblast growth factor-18 (FGF-18) and Sprifermin, are under investigation for their potential to slow down the progression of OA. These biological agents target the underlying causes of OA, including cartilage degradation and joint inflammation. Pharmacological methods are not the only approach to managing OA.

How is this Osteoarthritis Therapeutics Industry segmented and which is the largest segment?

The industry research report provides comprehensive data (region-wise segment analysis), with forecasts and estimates in "USD billion" for the period 2024-2028, as well as historical data from 2018-2022 for the following segments.
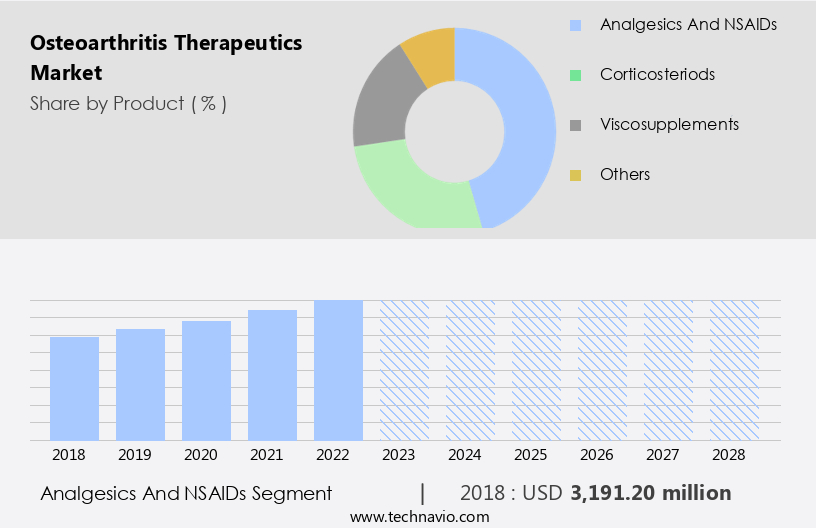
  • Product
    • Analgesics and NSAIDs
    • Corticosteriods
    • Viscosupplements
    • Others
  • Type
    • Ankle osteoarthritis
    • Hip osteoarthritis
    • Knee osteoarthritis
    • Others
  • Geography
    • North America
      • US
    • Europe
      • Germany
      • UK
    • Asia
      • China
      • Japan
    • Rest of World (ROW)

By Product Insights

  • The analgesics and NSAIDs segment is estimated to witness significant growth during the forecast period.

Osteoarthritis, characterized by joint pain and anatomy damage due to wear and tear, requires effective therapeutic interventions. The analgesic and Over-the-Counter non-specific anti-inflammatory Drugs (OTC NSAIDs) segment is experiencing significant growth as they provide relief from the primary symptom, pain. Acetaminophen and NSAIDs like Ibuprofen and Naproxen are commonly used for managing pain in patients with knee osteoarthritis. NSAIDs offer additional benefits with their anti-inflammatory properties, making them increasingly popular. However, traditional non-selective NSAIDs have side effects such as gastric ulcers and kidney issues. Personalized medicine and biomarkers are emerging trends in osteoarthritis therapeutics. Corticosteroids and Duloxetine are other therapeutic options for treating osteoarthritis, with corticosteroids providing quick pain relief and Duloxetine offering long-term pain management through its dual mechanism of action on both pain and mood.

The market is anticipated to expand due to the increasing prevalence of the disease, especially among the aging population. This growth is driven by the rising awareness of the disease, technological advancements, and the development of new therapeutic options. 

Osteoarthritis Therapeutics Market Size

Get a glance at the market report of share of various segments Request Free Sample

The Analgesics and NSAIDs segment was valued at USD 3.19 billion in 2018 and showed a gradual increase during the forecast period.

Regional Analysis

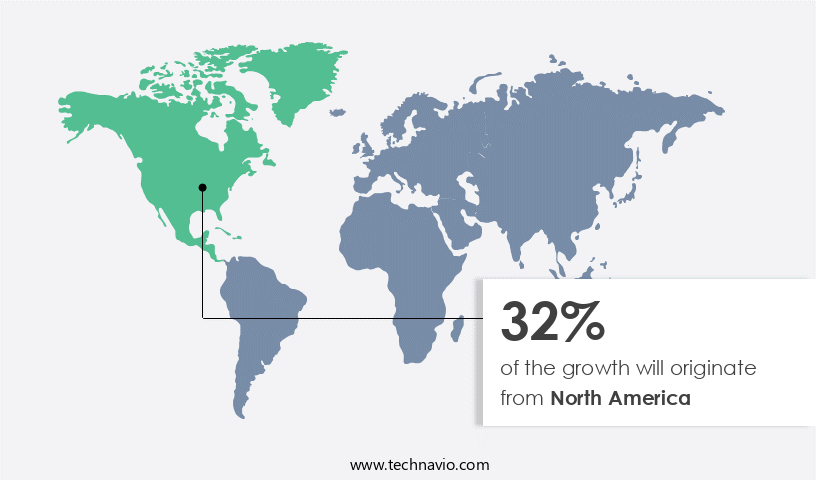
  • North America is estimated to contribute 32% to the growth of the global market during the forecast period.

Technavio's analysts have elaborately explained the regional trends and drivers that shape the market during the forecast period.

Osteoarthritis Therapeutics Market Share by Geography

For more insights on the market size of various regions, Request Free Sample

Osteoarthritis (OA), a common form of arthritis, affects millions of adults In the United States. Osteoarthritis is characterized by joint pain, stiffness, and loss of function. The high prevalence of this condition In the US presents a significant opportunity for the market. Clinical trials and preclinical research are ongoing to develop personalized medicines for OA. For instance, Anti-NGF therapy, which targets nerve growth factors, is being explored for its potential to alleviate pain.

Regulatory scenarios are being evaluated to ensure the safety and efficacy of these new therapies. Strategic alliances between industry players and research institutions are driving innovation in OA therapeutics. Pain management remains a priority, with a focus on developing effective treatments for knee osteoarthritis. As the market evolves, it is crucial to stay informed about the latest developments and regulatory scenarios. 

Market Dynamics

Our researchers analyzed the data with 2023 as the base year, along with the key drivers, trends, and challenges. A holistic analysis of drivers will help companies refine their marketing strategies to gain a competitive advantage.

What are the key market drivers leading to the rise In the adoption of Osteoarthritis Therapeutics Industry?

The increasing incidence of osteoarthritis is the key driver of the market.

  • The condition, characterized by the degeneration of cartilage In the joints, is influenced by various factors, including aging and obesity. As the population ages, the imbalance between catabolic and anabolic activities In the joints increases, leading to cartilage degeneration. Additionally, aging results in a decrease in muscle mass and an increase in fat mass, contributing to joint loading and the progression of osteoarthritis. The disease can affect various joints, including those In the hip, shoulder, hand, and small joints.
  • The market for osteoarthritis encompasses several drug classifications and administration routes, such as oral and topical. Qualitative factors, including patient preferences and physician recommendations, and quantitative factors, such as efficacy and safety, play a significant role In the market's growth. 

What are the market trends shaping the Osteoarthritis Therapeutics Industry?

Expanding research and development is the upcoming market trend.

  • Osteoarthritis, a degenerative joint disease, is a significant health concern worldwide. The advancement of scientific research has led to a better comprehension of the molecular mechanisms underlying this condition. Consequently, potential drug targets have been identified to address the disease at its root cause. Two primary pro-inflammatory cytokines, interleukin-1 beta (IL-1?) and tumor necrosis factor-alpha (TNF-?), are under investigation for their role in cartilage degradation.
  • TNF-? instigates inflammation In the synovial membrane, contributing to cartilage matrix deterioration. Moreover, various growth factors, including insulin growth factor 1, basic fibroblast growth factor, platelet-derived growth factor, bone morphogenetic proteins, and transforming growth factor beta 1, are essential for cartilage repair.

What challenges does the Osteoarthritis Therapeutics Industry face during its growth?

The high cost of treatment is a key challenge affecting the industry growth.

  • Osteoarthritis, a chronic joint disease characterized by pain and impaired joint function, incurred significant financial statistics in US healthcare in 2013, ranking as the second most expensive condition treated in hospitals. Current treatments primarily provide symptomatic relief, necessitating ongoing medication use.
  • The high cost of treatment persists despite the availability of affordable generic alternatives In the market. The scarcity of curative methods, such as stem cell and gene therapies, further complicates the situation. According to the Centers for Disease Control and Prevention (CDC), osteoarthritis treatment expenses have been a substantial challenge for the healthcare sector. 

Exclusive Customer Landscape

The market forecasting report includes the adoption lifecycle of the market, covering from the innovator's stage to the laggard's stage. It focuses on adoption rates in different regions based on penetration. Furthermore, the market report also includes key purchase criteria and drivers of price sensitivity to help companies evaluate and develop their market growth analysis strategies.
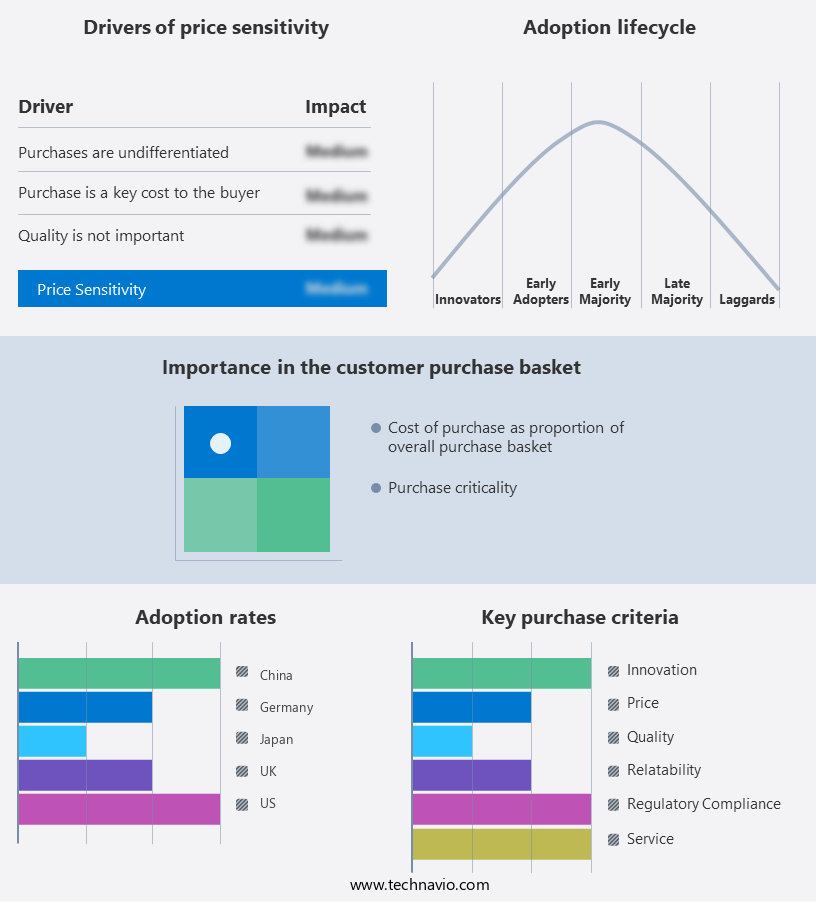
Osteoarthritis Therapeutics Market Share by Geography

 Customer Landscape

Key Companies & Market Insights

Companies are implementing various strategies, such as strategic alliances, market forecast, partnerships, mergers and acquisitions, geographical expansion, and product/service launches, to enhance their presence In the industry.

The industry research and growth report includes detailed analyses of the competitive landscape of the market and information about key companies, including:

  • Abbott Laboratories
  • Alvogen Iceland ehf
  • Anika Therapeutics Inc.
  • Avanos Medical Inc.
  • Bayer AG
  • Bioventus LLC
  • Boehringer Ingelheim International GmbH
  • F. Hoffmann La Roche Ltd.
  • Ferring BV
  • Fidia Farmaceutici Spa
  • GlaxoSmithKline Plc
  • Hanmi Pharm Co. Ltd.
  • Horizon Therapeutics Plc
  • Johnson and Johnson Services Inc.
  • Novartis AG
  • Pacira BioSciences Inc.
  • Pharmed Ltd.
  • Sanofi SA
  • Viatris Inc.
  • Zimmer Biomet Holdings Inc.

Qualitative and quantitative analysis of companies has been conducted to help clients understand the wider business environment as well as the strengths and weaknesses of key industry players. Data is qualitatively analyzed to categorize companies as pure play, category-focused, industry-focused, and diversified; it is quantitatively analyzed to categorize companies as dominant, leading, strong, tentative, and weak.

Research Analyst Overview

Osteoarthritis (OA) is a degenerative joint disease characterized by the breakdown of cartilage and underlying bone, leading to chronic pain and inflammation. The therapeutic market for OA focuses on providing relief from symptoms through various approaches, including pain medications, orthopedic braces, and nutraceuticals. Pain relievers remain a popular choice for managing OA symptoms. These include oral analgesics such as acetaminophen, nonsteroidal anti-inflammatory drugs (NSAIDs) like naproxen and ibuprofen, and prescription drugs like duloxetine. Topical agents and intra-articular agents are also used for localized pain relief. The market is witnessing a shift towards personalized medicine, with the identification of biomarkers playing a crucial role in the development of novel therapeutics, including orthobiologics and gene therapy, which offer targeted and innovative treatment options.

Furthermore, this includes anti-NGF therapy, which targets nerve growth factors to reduce pain. Pharmacological methods continue to dominate the OA therapeutics market, with ongoing clinical trials and preclinical research exploring new regulatory scenarios. The market is segmented based on the route of administration, including oral and topical, and distribution channels, including hospital pharmacies, online pharmacies, and retail pharmacies. Factors influencing the purchasing pattern include financial statistics, inflation, and the prevalence of chronic diseases such as OA In the aging population. The market for OA therapeutics is expected to grow significantly due to the increasing incidence of OA In the knee, hip, shoulder, hand, and small joints.

Market Scope

Report Coverage

Details

Page number

177

Base year

2023

Historic period

2018-2022

Forecast period

2024-2028

Growth momentum & CAGR

Accelerate at a CAGR of 9.49%

Market Growth 2024-2028

USD 4.57 billion

Market structure

Fragmented

YoY growth 2023-2024(%)

8.45

Key countries

US, UK, Japan, Germany, and China

Competitive landscape

Leading Companies, Market Positioning of Companies, Competitive Strategies, and Industry Risks

Request Free Sample

What are the Key Data Covered in this Osteoarthritis Therapeutics Market Research and Growth Report?

  • CAGR of the Osteoarthritis Therapeutics industry during the forecast period
  • Detailed information on factors that will drive the market growth and forecasting between 2024 and 2028
  • Precise estimation of the size of the market and its contribution of the industry in focus to the parent market
  • Accurate predictions about upcoming growth and trends and changes in consumer behaviour
  • Growth of the market across North America, Europe, Asia, and Rest of World (ROW)
  • Thorough analysis of the market's competitive landscape and detailed information about companies
  • Comprehensive analysis of factors that will challenge the osteoarthritis therapeutics market growth of industry companies

We can help! Our analysts can customize this osteoarthritis therapeutics market research report to meet your requirements.

Get in touch

1 Executive Summary

  • 1.1 Market overview
    • Executive Summary - Chart on Market Overview
    • Executive Summary - Data Table on Market Overview
    • Executive Summary - Chart on Global Market Characteristics
    • Executive Summary - Chart on Market by Geography
    • Executive Summary - Chart on Market Segmentation by Product
    • Executive Summary - Chart on Market Segmentation by Type
    • Executive Summary - Chart on Incremental Growth
    • Executive Summary - Data Table on Incremental Growth
    • Executive Summary - Chart on Company Market Positioning

2 Market Landscape

  • 2.1 Market ecosystem
    • Parent Market
    • Data Table on - Parent Market
  • 2.2 Market characteristics
    • Market characteristics analysis
  • 2.3 Value chain analysis
    • Value Chain Analysis

3 Market Sizing

  • 3.1 Market definition
    • Offerings of companies included in the market definition
  • 3.2 Market segment analysis
    • Market segments
  • 3.3 Market size 2023
    • 3.4 Market outlook: Forecast for 2023-2028
      • Chart on Global - Market size and forecast 2023-2028 ($ million)
      • Data Table on Global - Market size and forecast 2023-2028 ($ million)
      • Chart on Global Market: Year-over-year growth 2023-2028 (%)
      • Data Table on Global Market: Year-over-year growth 2023-2028 (%)

    4 Historic Market Size

    • 4.1 Global Osteoarthritis Therapeutics Market 2018 - 2022
      • Historic Market Size - Data Table on Global Osteoarthritis Therapeutics Market 2018 - 2022 ($ million)
    • 4.2 Product segment analysis 2018 - 2022
      • Historic Market Size - Product Segment 2018 - 2022 ($ million)
    • 4.3 Type segment analysis 2018 - 2022
      • Historic Market Size - Type Segment 2018 - 2022 ($ million)
    • 4.4 Geography segment analysis 2018 - 2022
      • Historic Market Size - Geography Segment 2018 - 2022 ($ million)
    • 4.5 Country segment analysis 2018 - 2022
      • Historic Market Size - Country Segment 2018 - 2022 ($ million)

    5 Five Forces Analysis

    • 5.1 Five forces summary
      • Five forces analysis - Comparison between 2023 and 2028
    • 5.2 Bargaining power of buyers
      • Bargaining power of buyers - Impact of key factors 2023 and 2028
    • 5.3 Bargaining power of suppliers
      • Bargaining power of suppliers - Impact of key factors in 2023 and 2028
    • 5.4 Threat of new entrants
      • Threat of new entrants - Impact of key factors in 2023 and 2028
    • 5.5 Threat of substitutes
      • Threat of substitutes - Impact of key factors in 2023 and 2028
    • 5.6 Threat of rivalry
      • Threat of rivalry - Impact of key factors in 2023 and 2028
    • 5.7 Market condition
      • Chart on Market condition - Five forces 2023 and 2028

    6 Market Segmentation by Product

    • 6.1 Market segments
      • Chart on Product - Market share 2023-2028 (%)
      • Data Table on Product - Market share 2023-2028 (%)
    • 6.2 Comparison by Product
      • Chart on Comparison by Product
      • Data Table on Comparison by Product
    • 6.3 Analgesics and NSAIDs - Market size and forecast 2023-2028
      • Chart on Analgesics and NSAIDs - Market size and forecast 2023-2028 ($ million)
      • Data Table on Analgesics and NSAIDs - Market size and forecast 2023-2028 ($ million)
      • Chart on Analgesics and NSAIDs - Year-over-year growth 2023-2028 (%)
      • Data Table on Analgesics and NSAIDs - Year-over-year growth 2023-2028 (%)
    • 6.4 Corticosteriods - Market size and forecast 2023-2028
      • Chart on Corticosteriods - Market size and forecast 2023-2028 ($ million)
      • Data Table on Corticosteriods - Market size and forecast 2023-2028 ($ million)
      • Chart on Corticosteriods - Year-over-year growth 2023-2028 (%)
      • Data Table on Corticosteriods - Year-over-year growth 2023-2028 (%)
    • 6.5 Viscosupplements - Market size and forecast 2023-2028
      • Chart on Viscosupplements - Market size and forecast 2023-2028 ($ million)
      • Data Table on Viscosupplements - Market size and forecast 2023-2028 ($ million)
      • Chart on Viscosupplements - Year-over-year growth 2023-2028 (%)
      • Data Table on Viscosupplements - Year-over-year growth 2023-2028 (%)
    • 6.6 Others - Market size and forecast 2023-2028
      • Chart on Others - Market size and forecast 2023-2028 ($ million)
      • Data Table on Others - Market size and forecast 2023-2028 ($ million)
      • Chart on Others - Year-over-year growth 2023-2028 (%)
      • Data Table on Others - Year-over-year growth 2023-2028 (%)
    • 6.7 Market opportunity by Product
      • Market opportunity by Product ($ million)
      • Data Table on Market opportunity by Product ($ million)

    7 Market Segmentation by Type

    • 7.1 Market segments
      • Chart on Type - Market share 2023-2028 (%)
      • Data Table on Type - Market share 2023-2028 (%)
    • 7.2 Comparison by Type
      • Chart on Comparison by Type
      • Data Table on Comparison by Type
    • 7.3 Ankle osteoarthritis - Market size and forecast 2023-2028
      • Chart on Ankle osteoarthritis - Market size and forecast 2023-2028 ($ million)
      • Data Table on Ankle osteoarthritis - Market size and forecast 2023-2028 ($ million)
      • Chart on Ankle osteoarthritis - Year-over-year growth 2023-2028 (%)
      • Data Table on Ankle osteoarthritis - Year-over-year growth 2023-2028 (%)
    • 7.4 Hip osteoarthritis - Market size and forecast 2023-2028
      • Chart on Hip osteoarthritis - Market size and forecast 2023-2028 ($ million)
      • Data Table on Hip osteoarthritis - Market size and forecast 2023-2028 ($ million)
      • Chart on Hip osteoarthritis - Year-over-year growth 2023-2028 (%)
      • Data Table on Hip osteoarthritis - Year-over-year growth 2023-2028 (%)
    • 7.5 Knee osteoarthritis - Market size and forecast 2023-2028
      • Chart on Knee osteoarthritis - Market size and forecast 2023-2028 ($ million)
      • Data Table on Knee osteoarthritis - Market size and forecast 2023-2028 ($ million)
      • Chart on Knee osteoarthritis - Year-over-year growth 2023-2028 (%)
      • Data Table on Knee osteoarthritis - Year-over-year growth 2023-2028 (%)
    • 7.6 Others - Market size and forecast 2023-2028
      • Chart on Others - Market size and forecast 2023-2028 ($ million)
      • Data Table on Others - Market size and forecast 2023-2028 ($ million)
      • Chart on Others - Year-over-year growth 2023-2028 (%)
      • Data Table on Others - Year-over-year growth 2023-2028 (%)
    • 7.7 Market opportunity by Type
      • Market opportunity by Type ($ million)
      • Data Table on Market opportunity by Type ($ million)

    8 Customer Landscape

    • 8.1 Customer landscape overview
      • Analysis of price sensitivity, lifecycle, customer purchase basket, adoption rates, and purchase criteria

    9 Geographic Landscape

    • 9.1 Geographic segmentation
      • Chart on Market share by geography 2023-2028 (%)
      • Data Table on Market share by geography 2023-2028 (%)
    • 9.2 Geographic comparison
      • Chart on Geographic comparison
      • Data Table on Geographic comparison
    • 9.3 North America - Market size and forecast 2023-2028
      • Chart on North America - Market size and forecast 2023-2028 ($ million)
      • Data Table on North America - Market size and forecast 2023-2028 ($ million)
      • Chart on North America - Year-over-year growth 2023-2028 (%)
      • Data Table on North America - Year-over-year growth 2023-2028 (%)
    • 9.4 Europe - Market size and forecast 2023-2028
      • Chart on Europe - Market size and forecast 2023-2028 ($ million)
      • Data Table on Europe - Market size and forecast 2023-2028 ($ million)
      • Chart on Europe - Year-over-year growth 2023-2028 (%)
      • Data Table on Europe - Year-over-year growth 2023-2028 (%)
    • 9.5 Asia - Market size and forecast 2023-2028
      • Chart on Asia - Market size and forecast 2023-2028 ($ million)
      • Data Table on Asia - Market size and forecast 2023-2028 ($ million)
      • Chart on Asia - Year-over-year growth 2023-2028 (%)
      • Data Table on Asia - Year-over-year growth 2023-2028 (%)
    • 9.6 Rest of World (ROW) - Market size and forecast 2023-2028
      • Chart on Rest of World (ROW) - Market size and forecast 2023-2028 ($ million)
      • Data Table on Rest of World (ROW) - Market size and forecast 2023-2028 ($ million)
      • Chart on Rest of World (ROW) - Year-over-year growth 2023-2028 (%)
      • Data Table on Rest of World (ROW) - Year-over-year growth 2023-2028 (%)
    • 9.7 US - Market size and forecast 2023-2028
      • Chart on US - Market size and forecast 2023-2028 ($ million)
      • Data Table on US - Market size and forecast 2023-2028 ($ million)
      • Chart on US - Year-over-year growth 2023-2028 (%)
      • Data Table on US - Year-over-year growth 2023-2028 (%)
    • 9.8 UK - Market size and forecast 2023-2028
      • Chart on UK - Market size and forecast 2023-2028 ($ million)
      • Data Table on UK - Market size and forecast 2023-2028 ($ million)
      • Chart on UK - Year-over-year growth 2023-2028 (%)
      • Data Table on UK - Year-over-year growth 2023-2028 (%)
    • 9.9 Japan - Market size and forecast 2023-2028
      • Chart on Japan - Market size and forecast 2023-2028 ($ million)
      • Data Table on Japan - Market size and forecast 2023-2028 ($ million)
      • Chart on Japan - Year-over-year growth 2023-2028 (%)
      • Data Table on Japan - Year-over-year growth 2023-2028 (%)
    • 9.10 Germany - Market size and forecast 2023-2028
      • Chart on Germany - Market size and forecast 2023-2028 ($ million)
      • Data Table on Germany - Market size and forecast 2023-2028 ($ million)
      • Chart on Germany - Year-over-year growth 2023-2028 (%)
      • Data Table on Germany - Year-over-year growth 2023-2028 (%)
    • 9.11 China - Market size and forecast 2023-2028
      • Chart on China - Market size and forecast 2023-2028 ($ million)
      • Data Table on China - Market size and forecast 2023-2028 ($ million)
      • Chart on China - Year-over-year growth 2023-2028 (%)
      • Data Table on China - Year-over-year growth 2023-2028 (%)
    • 9.12 Market opportunity by geography
      • Market opportunity by geography ($ million)
      • Data Tables on Market opportunity by geography ($ million)

    10 Drivers, Challenges, and Opportunity/Restraints

    • 10.1 Market drivers
      • 10.2 Market challenges
        • 10.3 Impact of drivers and challenges
          • Impact of drivers and challenges in 2023 and 2028
        • 10.4 Market opportunities/restraints

          11 Competitive Landscape

          • 11.1 Overview
            • 11.2 Competitive Landscape
              • Overview on criticality of inputs and factors of differentiation
            • 11.3 Landscape disruption
              • Overview on factors of disruption
            • 11.4 Industry risks
              • Impact of key risks on business

            12 Competitive Analysis

            • 12.1 Companies profiled
              • Companies covered
            • 12.2 Market positioning of companies
              • Matrix on companies position and classification
            • 12.3 Abbott Laboratories
              • Abbott Laboratories - Overview
              • Abbott Laboratories - Business segments
              • Abbott Laboratories - Key news
              • Abbott Laboratories - Key offerings
              • Abbott Laboratories - Segment focus
            • 12.4 Anika Therapeutics Inc.
              • Anika Therapeutics Inc. - Overview
              • Anika Therapeutics Inc. - Product / Service
              • Anika Therapeutics Inc. - Key offerings
            • 12.5 Bayer AG
              • Bayer AG - Overview
              • Bayer AG - Business segments
              • Bayer AG - Key news
              • Bayer AG - Key offerings
              • Bayer AG - Segment focus
            • 12.6 Bioventus LLC
              • Bioventus LLC - Overview
              • Bioventus LLC - Business segments
              • Bioventus LLC - Key offerings
              • Bioventus LLC - Segment focus
            • 12.7 Boehringer Ingelheim International GmbH
              • Boehringer Ingelheim International GmbH - Overview
              • Boehringer Ingelheim International GmbH - Product / Service
              • Boehringer Ingelheim International GmbH - Key offerings
            • 12.8 F. Hoffmann La Roche Ltd.
              • F. Hoffmann La Roche Ltd. - Overview
              • F. Hoffmann La Roche Ltd. - Business segments
              • F. Hoffmann La Roche Ltd. - Key news
              • F. Hoffmann La Roche Ltd. - Key offerings
              • F. Hoffmann La Roche Ltd. - Segment focus
            • 12.9 Ferring BV
              • Ferring BV - Overview
              • Ferring BV - Product / Service
              • Ferring BV - Key offerings
            • 12.10 Fidia Farmaceutici Spa
              • Fidia Farmaceutici Spa - Overview
              • Fidia Farmaceutici Spa - Product / Service
              • Fidia Farmaceutici Spa - Key offerings
            • 12.11 GlaxoSmithKline Plc
              • GlaxoSmithKline Plc - Overview
              • GlaxoSmithKline Plc - Business segments
              • GlaxoSmithKline Plc - Key news
              • GlaxoSmithKline Plc - Key offerings
              • GlaxoSmithKline Plc - Segment focus
            • 12.12 Horizon Therapeutics Plc
              • Horizon Therapeutics Plc - Overview
              • Horizon Therapeutics Plc - Product / Service
              • Horizon Therapeutics Plc - Key offerings
            • 12.13 Johnson and Johnson Services Inc.
              • Johnson and Johnson Services Inc. - Overview
              • Johnson and Johnson Services Inc. - Business segments
              • Johnson and Johnson Services Inc. - Key news
              • Johnson and Johnson Services Inc. - Key offerings
              • Johnson and Johnson Services Inc. - Segment focus
            • 12.14 Novartis AG
              • Novartis AG - Overview
              • Novartis AG - Business segments
              • Novartis AG - Key news
              • Novartis AG - Key offerings
              • Novartis AG - Segment focus
            • 12.15 Sanofi SA
              • Sanofi SA - Overview
              • Sanofi SA - Business segments
              • Sanofi SA - Key news
              • Sanofi SA - Key offerings
              • Sanofi SA - Segment focus
            • 12.16 Viatris Inc.
              • Viatris Inc. - Overview
              • Viatris Inc. - Business segments
              • Viatris Inc. - Key news
              • Viatris Inc. - Key offerings
              • Viatris Inc. - Segment focus
            • 12.17 Zimmer Biomet Holdings Inc.
              • Zimmer Biomet Holdings Inc. - Overview
              • Zimmer Biomet Holdings Inc. - Business segments
              • Zimmer Biomet Holdings Inc. - Key news
              • Zimmer Biomet Holdings Inc. - Key offerings
              • Zimmer Biomet Holdings Inc. - Segment focus

            13 Appendix

            • 13.1 Scope of the report
              • 13.2 Inclusions and exclusions checklist
                • Inclusions checklist
                • Exclusions checklist
              • 13.3 Currency conversion rates for US$
                • Currency conversion rates for US$
              • 13.4 Research methodology
                • Research methodology
              • 13.5 Data procurement
                • Information sources
              • 13.6 Data validation
                • Data validation
              • 13.7 Validation techniques employed for market sizing
                • Validation techniques employed for market sizing
              • 13.8 Data synthesis
                • Data synthesis
              • 13.9 market analysis
                • market analysis
              • 13.10 List of abbreviations
                • List of abbreviations

              Research Methodology

              Technavio presents a detailed picture of the market by way of study, synthesis, and summation of data from multiple sources. The analysts have presented the various facets of the market with a particular focus on identifying the key industry influencers. The data thus presented is comprehensive, reliable, and the result of extensive research, both primary and secondary.

              INFORMATION SOURCES

              Primary sources

              • Manufacturers and suppliers
              • Channel partners
              • Industry experts
              • Strategic decision makers

              Secondary sources

              • Industry journals and periodicals
              • Government data
              • Financial reports of key industry players
              • Historical data
              • Press releases

              DATA ANALYSIS

              Data Synthesis

              • Collation of data
              • Estimation of key figures
              • Analysis of derived insights

              Data Validation

              • Triangulation with data models
              • Reference against proprietary databases
              • Corroboration with industry experts

              REPORT WRITING

              Qualitative

              • Market drivers
              • Market challenges
              • Market trends
              • Five forces analysis

              Quantitative

              • Market size and forecast
              • Market segmentation
              • Geographical insights
              • Competitive landscape

              Interested in this report?

              Get your sample now to see our research methodology and insights!

              Download Now

              Frequently Asked Questions

              Osteoarthritis Therapeutics market growth will increase by $ 4573.6 mn during 2024-2028.

              The Osteoarthritis Therapeutics market is expected to grow at a CAGR of 9.49% during 2024-2028.

              Osteoarthritis Therapeutics market is segmented by Product( Analgesics and NSAIDs, Corticosteriods, Viscosupplements, Others) Type( Ankle osteoarthritis, Hip osteoarthritis, Knee osteoarthritis, Others)

              Abbott Laboratories, Alvogen Iceland ehf, Anika Therapeutics Inc., Avanos Medical Inc., Bayer AG, Bioventus LLC, Boehringer Ingelheim International GmbH, F. Hoffmann La Roche Ltd., Ferring BV, Fidia Farmaceutici Spa, GlaxoSmithKline Plc, Hanmi Pharm Co. Ltd., Horizon Therapeutics Plc, Johnson and Johnson Services Inc., Novartis AG, Pacira BioSciences Inc., Pharmed Ltd., Sanofi SA, Viatris Inc., Zimmer Biomet Holdings Inc. are a few of the key vendors in the Osteoarthritis Therapeutics market.

              North America will register the highest growth rate of 32% among the other regions. Therefore, the Osteoarthritis Therapeutics market in North America is expected to garner significant business opportunities for the vendors during the forecast period.

              US, UK, Japan, Germany, China

              • Increasing incidence of osteoarthritisOsteoarthritis is a common joint disorder is the driving factor this market.
              • and more than 10% of the world population is diagnosed with this degenerative disease of the joints. As per CDC is the driving factor this market.
              • in the US alone is the driving factor this market.
              • more than 30 million adults have osteoarthritis. The rising incidence of risk factors such as aging and obesity is directly contributing to the increasing prevalence of osteoarthritis in both developed as well as developing regions. Aging leads to an imbalance between the catabolic as well as anabolic activity in the joint is the driving factor this market.
              • which may result in the degeneration of cartilage lining the joints. In addition is the driving factor this market.
              • aging leads to a decrease in muscle mass and an increase in fat mass is the driving factor this market.
              • thereby leading to joint loading is the driving factor this market.
              • which can result in the progression of osteoarthritis. As per the CDC is the driving factor this market.
              • in the US is the driving factor this market.
              • the population group aged 60 years and above is expected to be doubled by 2050. Therefore is the driving factor this market.
              • the prevalence of osteoarthritis is expected to increase steadily during the forecast period. Similarly is the driving factor this market.
              • the rise in the worldwide prevalence of obesity is also a major factor leading to an increase in the incidence of osteoarthritis. As per the centers for disease control and prevention (CDC) is the driving factor this market.
              • in the US is the driving factor this market.
              • about 93.3 million people were obese during 2015-2016. Obese people are associated with excessive joint loading because of high body weight is the driving factor this market.
              • which may lead to osteoarthritis. The inflammation of adipose tissue and dyslipidemia associated with obesity also contribute to obesity-induced osteoarthritis. Such factors are expected to drive the growth of the global OA therapeutics market during the forecast period. is the driving factor this market.

              The Osteoarthritis Therapeutics market vendors should focus on grabbing business opportunities from the Analgesics and NSAIDs segment as it accounted for the largest market share in the base year.
              RIA - Research AI Assistant
              Ask RIA