Packaged Substation Market Analysis, Size, and Forecast 2026-2030: APAC (China, India, and Japan), North America (US, Canada, and Mexico), Europe (Germany, UK, and France), Middle East and Africa (Saudi Arabia, UAE, and South Africa), South America (Brazil and Argentina), and Rest of World (ROW)

Packaged Substation Market Analysis, Size, and Forecast 2026-2030:
APAC (China, India, and Japan), North America (US, Canada, and Mexico), Europe (Germany, UK, and France), Middle East and Africa (Saudi Arabia, UAE, and South Africa), South America (Brazil and Argentina), and Rest of World (ROW)

Published: Apr 2026 294 Pages SKU: IRTNTR71376

Market Overview at a Glance

$4.86 B
Market Opportunity
7.2%
CAGR 2025 - 2030
55.4%
APAC Growth
$5.55 B
Industrial segment 2024

Packaged Substation Market Size 2026-2030

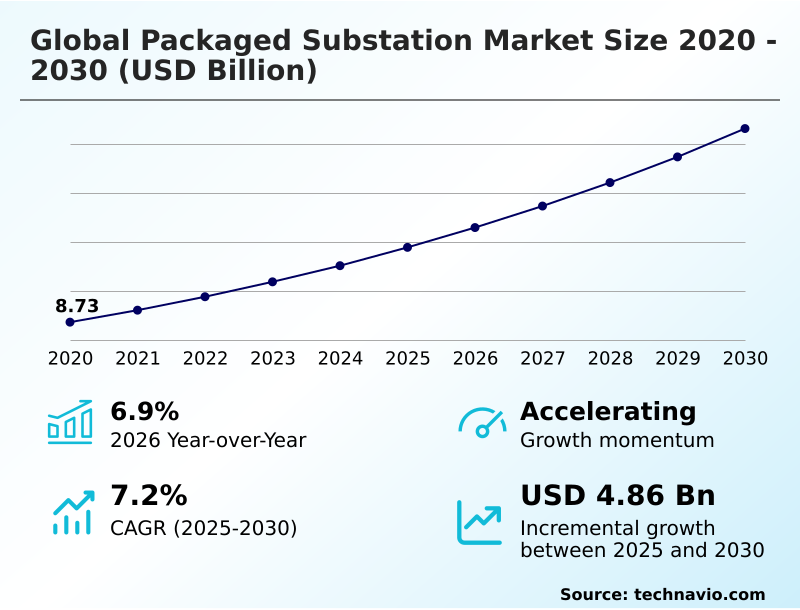
The packaged substation market size is valued to increase by USD 4.86 billion, at a CAGR of 7.2% from 2025 to 2030. Rapid urbanization and industrialization will drive the packaged substation market.

Major Market Trends & Insights

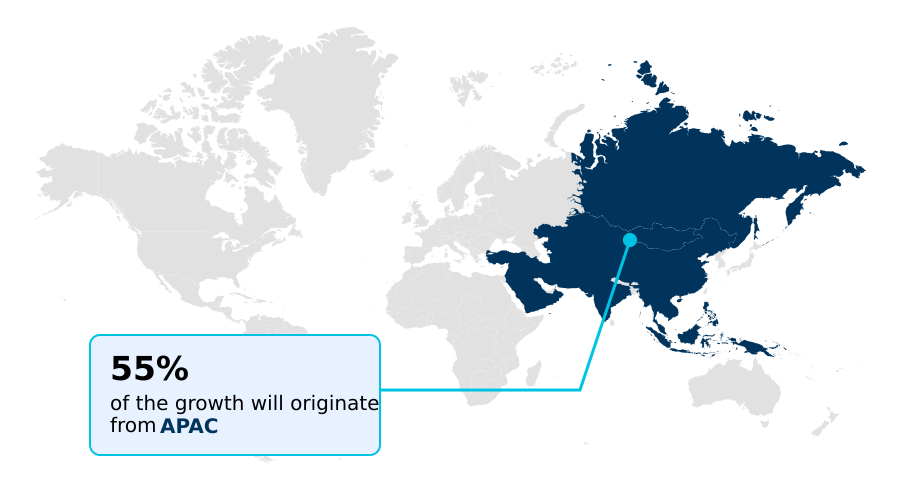
  • APAC dominated the market and accounted for a 55.4% growth during the forecast period.
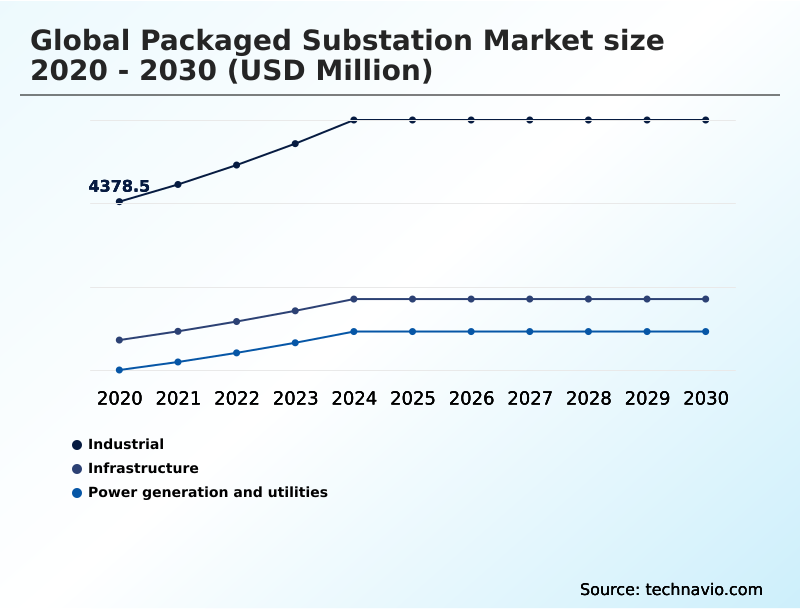
  • By Application - Industrial segment was valued at USD 5.55 billion in 2024
  • By Power Rating - Medium segment accounted for the largest market revenue share in 2024

Market Size & Forecast

  • Market Opportunities: USD 7.92 billion
  • Market Future Opportunities: USD 4.86 billion
  • CAGR from 2025 to 2030 : 7.2%

Market Summary

  • The packaged substation market is undergoing significant transformation, driven by global shifts toward decentralized energy and grid modernization. The increasing need for electrical infrastructure that is both compact and rapidly deployable is a primary catalyst, particularly in urban and industrial expansion projects.
  • The integration of renewable energy sources demands advanced voltage transformation and grid stability solutions, where systems like compact secondary substations and gas-insulated packaged substations are essential. A key trend is the adoption of smart grid applications, which leverage intelligent electronic devices for remote monitoring and control.
  • For instance, a utility can deploy a digital twin of a prefabricated e-house substation to simulate load balancing and plan predictive maintenance, significantly improving operational efficiency and reducing downtime. This proactive approach to asset management, using power conversion and grid solutions, helps overcome the operational complexities of modern power distribution networks.
  • However, the high capital costs of such sophisticated power generation systems and turnkey packaged substations remain a considerable challenge, moderating the pace of adoption despite clear long-term benefits in reliability and performance.

What will be the Size of the Packaged Substation Market during the forecast period?

Get Key Insights on Market Forecast (PDF) Request Free Sample

How is the Packaged Substation Market Segmented?

The packaged substation industry research report provides comprehensive data (region-wise segment analysis), with forecasts and estimates in "USD million" for the period 2026-2030, as well as historical data from 2020-2024 for the following segments.

  • Application
    • Industrial
    • Infrastructure
    • Power generation and utilities
  • Power rating
    • Medium
    • Low
    • High
  • Type
    • Outdoor packaged substation
    • Indoor packaged substation
    • Underground packaged substation
  • Geography
    • APAC
      • China
      • India
      • Japan
    • North America
      • US
      • Canada
      • Mexico
    • Europe
      • Germany
      • UK
      • France
    • Middle East and Africa
      • Saudi Arabia
      • UAE
      • South Africa
    • South America
      • Brazil
      • Argentina
    • Rest of World (ROW)

By Application Insights

The industrial segment is estimated to witness significant growth during the forecast period.

The industrial segment is driven by the need for dependable and scalable electrical infrastructure in settings from manufacturing plants to data centers. These environments demand uninterrupted power to ensure operational continuity and protect sensitive assets.

Solutions like unitized substations and compact power centers are critical, offering tailored power management for specific industrial loads. These systems, including rugged outdoor packaged substations, provide essential voltage transformation and incorporate advanced high-voltage power electronics.

The use of high-quality electrical components ensures reliability in harsh conditions.

Modern industrial power distribution strategies leverage fast deployment substations, reducing installation time by over 40% compared to traditional builds, supported by specialized substation engineering services and customized substation manufacturing for optimized electrical power management.

Request Free Sample

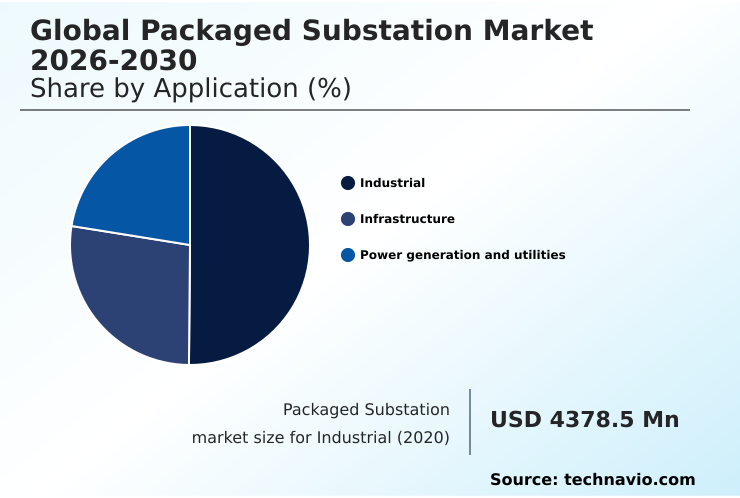
The Industrial segment was valued at USD 5.55 billion in 2024 and showed a gradual increase during the forecast period.

Request Free Sample

Regional Analysis

APAC is estimated to contribute 55.4% to the growth of the global market during the forecast period.Technavio’s analysts have elaborately explained the regional trends and drivers that shape the market during the forecast period.

See How Packaged Substation Market Demand is Rising in APAC Request Free Sample

The geographic landscape is dominated by APAC, which accounts for over 55% of the market's incremental growth, driven by massive industrialization and urbanization projects requiring prefabricated substation solutions.

This region's demand for new power generation systems and grid solutions is unparalleled. North America follows, contributing nearly 24% of growth, with a focus on upgrading aging infrastructure with modular substation systems and compact substation design to enhance grid stability.

The European market is advancing the adoption of underground packaged substation technology to preserve urban aesthetics.

Across these regions, the emphasis is on comprehensive electrical system integration, with solutions like compact secondary substations and modular prefabricated substation designs enabling efficient power conversion and distribution, while skid-mounted power solutions cater to specialized industrial needs.

Market Dynamics

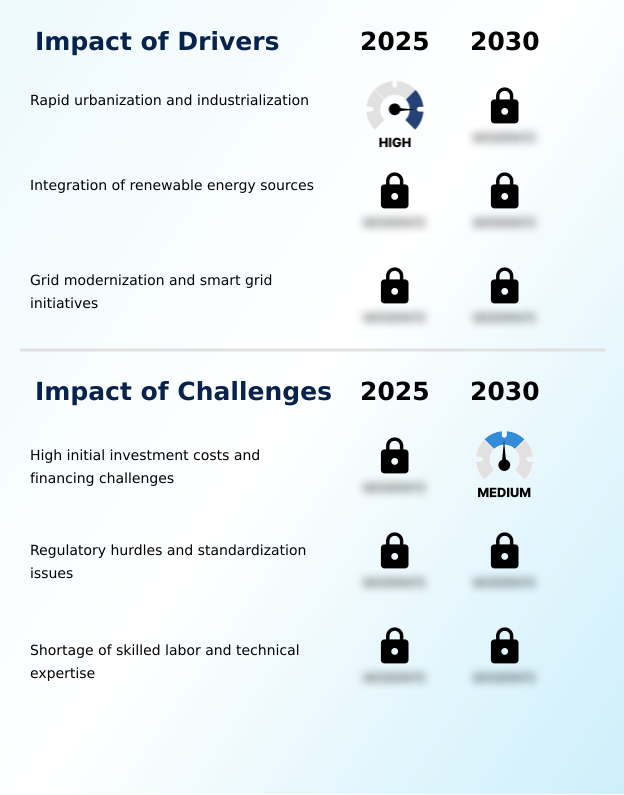
Our researchers analyzed the data with 2025 as the base year, along with the key drivers, trends, and challenges. A holistic analysis of drivers will help companies refine their marketing strategies to gain a competitive advantage.

  • The strategic deployment of specialized substations is becoming a critical differentiator for modern power projects. A compact substation for industrial use offers a minimal footprint and enhanced safety, crucial for manufacturing environments. Similarly, a packaged substation for renewable energy is indispensable for connecting solar or wind assets to the grid, providing the necessary interface for stable power evacuation.
  • The benefits of modular substation rapid deployment are increasingly evident; projects utilizing this methodology often report completion schedules that are more than twice as fast as those using traditional on-site construction. The growing interest in underground packaged substation benefits reflects a focus on urban aesthetics and space optimization in dense metropolitan areas.
  • For critical or remote applications, e-house solutions for remote sites and a mobile substation for emergency power provide essential resilience. A detailed cost comparison of packaged vs conventional substations often reveals long-term operational savings that offset higher initial capital.
  • The use of a digital twin for substation management and understanding the role of iecs in substation automation are becoming standard for optimizing performance. As a result, packaged substation maintenance best practices and turnkey substation provider selection criteria are now key considerations for any utility or industrial enterprise aiming to enhance grid reliability and efficiency.

What are the key market drivers leading to the rise in the adoption of Packaged Substation Industry?

  • Rapid urbanization and industrialization are primary drivers for the market, creating sustained and substantial demand for efficient, compact, and scalable power distribution infrastructure.

  • Market momentum is fueled by large-scale grid modernization and the imperative for renewable energy integration. The expansion of urban power infrastructure creates a consistent need for solutions that improve power distribution efficiency.
  • As grids evolve toward decentralized power distribution, the demand for flexible assets like skid-mounted substations and mobile substations for grid-tied renewable substations surges. These systems are crucial for managing variable energy inputs and enhancing power grid resilience.
  • Investment in energy infrastructure projects has increased by 20%, driving demand for advanced power transmission solutions. Effective smart grid applications support robust power distribution networks, ensuring stable and reliable energy delivery across diverse geographies.

What are the market trends shaping the Packaged Substation Industry?

  • Digitalization and smart integration represent a key market trend, transforming packaged substations with advanced capabilities for real-time monitoring, remote control, and predictive maintenance.

  • Key market trends are centered on smart substation technology and digitalization, enhancing operational efficiency through automated power distribution. The adoption of intelligent electronic devices and advanced substation automation systems enables comprehensive remote monitoring and control and facilitates predictive maintenance. This shift improves substation asset management, with some operators reporting a 30% reduction in unplanned outages.
  • Innovations in gas-insulated packaged substations and e-house modular substations are also pivotal, with eco-friendly substation designs reducing environmental impact. The deployment of a digital electricity substation equipped with eco-efficient compact substations has demonstrated the potential to lower operational energy consumption by up to 15%, marking a significant step toward more sustainable power grids.

What challenges does the Packaged Substation Industry face during its growth?

  • The high initial investment costs and associated financing challenges for packaged substation projects present a significant restraint on market growth and technology adoption.

  • A primary market challenge is the significant capital outlay required for turnkey packaged substations, especially those with high power rating substations. These complex systems, integrating core components like power transformers, medium voltage switchgear, and low voltage switchgear, represent a substantial upfront investment. Financing turnkey substation projects can be difficult, with project approval cycles sometimes extending by over 50%.
  • The logistics of deploying a packaged electrical house (e-house) or transportable substation units to remote sites add complexity and cost. For specialized applications like a substation for data centers, which require robust circuit protection and redundant systems, the cost is even higher.
  • Solutions like containerized substations and prefabricated e-house substations offer some cost benefits, but the initial financial barrier remains, slowing adoption in capital-constrained markets.

Exclusive Technavio Analysis on Customer Landscape

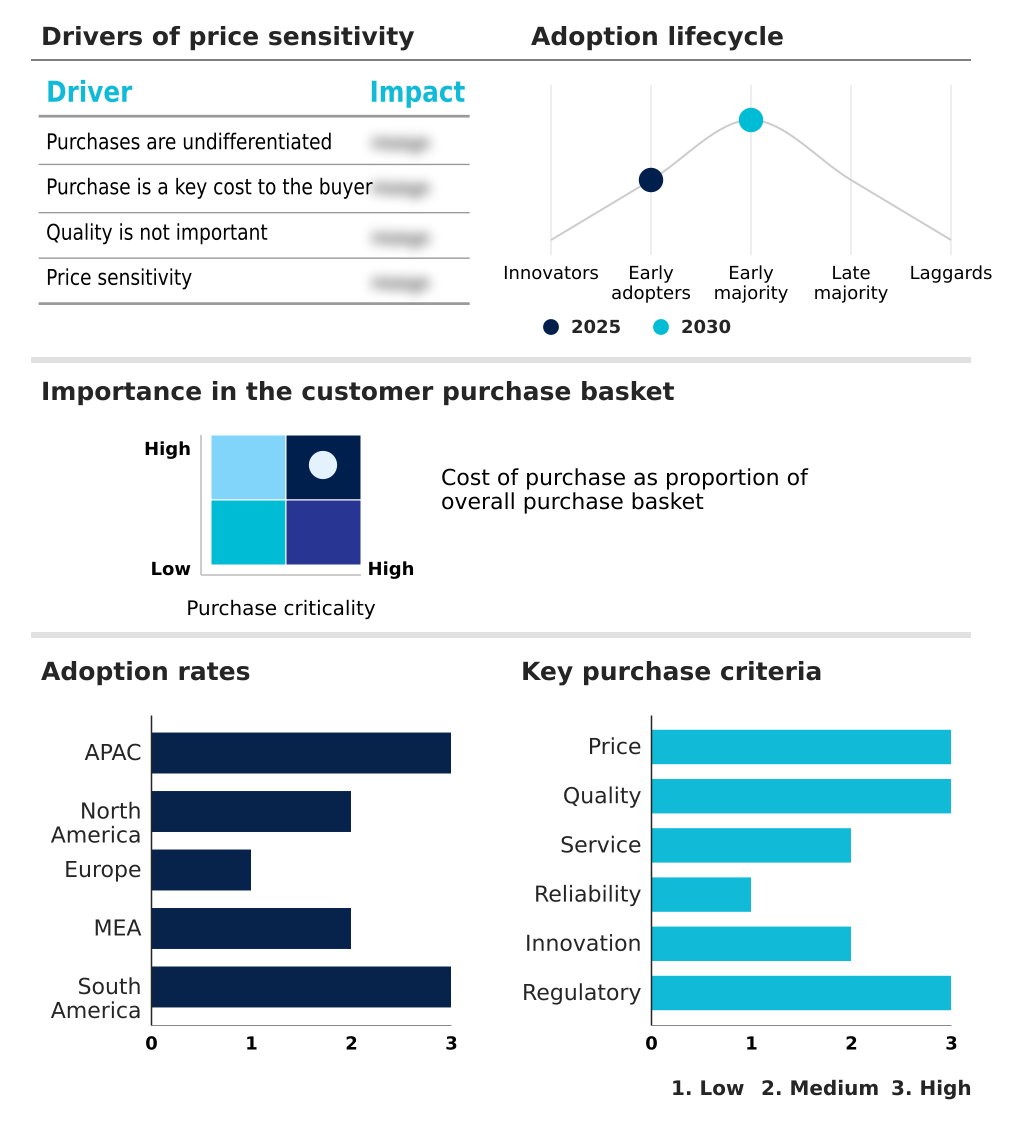
The packaged substation market forecasting report includes the adoption lifecycle of the market, covering from the innovator’s stage to the laggard’s stage. It focuses on adoption rates in different regions based on penetration. Furthermore, the packaged substation market report also includes key purchase criteria and drivers of price sensitivity to help companies evaluate and develop their market growth analysis strategies.

Customer Landscape of Packaged Substation Industry

Competitive Landscape

Companies are implementing various strategies, such as strategic alliances, packaged substation market forecast, partnerships, mergers and acquisitions, geographical expansion, and product/service launches, to enhance their presence in the industry.

ABB Ltd. - Delivers advanced compact and modular substations engineered for smart grid applications, ensuring high-reliability power distribution and optimized operational performance across diverse electrical networks.

The industry research and growth report includes detailed analyses of the competitive landscape of the market and information about key companies, including:

  • ABB Ltd.
  • alfanar Group
  • Ames Impex Electricals Pvt Ltd
  • C and S Electric Ltd.
  • CG Power and Industrial Ltd.
  • Eaton Corp. Plc
  • EL Sewedy Electric Co.
  • GE Vernova Inc.
  • Hartek Power Pvt. Ltd.
  • Hitachi Energy Ltd.
  • Hyosung Heavy Industries Corp.
  • Kirloskar Electric Co. Ltd.
  • Larsen and Toubro Ltd.
  • Lucy Electric UK Ltd.
  • Meidensha Corp.
  • Mitsubishi Electric
  • Raychem RPG Pvt. Ltd.
  • Schneider Electric SE
  • Siemens Energy AG
  • Toshiba Corp.

Qualitative and quantitative analysis of companies has been conducted to help clients understand the wider business environment as well as the strengths and weaknesses of key industry players. Data is qualitatively analyzed to categorize companies as pure play, category-focused, industry-focused, and diversified; it is quantitatively analyzed to categorize companies as dominant, leading, strong, tentative, and weak.

Recent Development and News in Packaged substation market

  • In January 2025, CHINT Group Company, Limited introduced a new modular prefabricated substation designed for rapid deployment and high reliability in various operational environments.
  • In April 2025, the Asian Development Bank (ADB) announced a $400 million loan to strengthen and modernize India’s power distribution system, indirectly supporting the deployment of modern substations.
  • In May 2025, Hitachi Energy announced its plan to deliver the world's first sulfur hexafluoride (SF6)-free 550 kilovolt (kV) gas-insulated switchgear (GIS) to the State Grid Corporation of China (SGCC), advancing eco-efficient substation technology.
  • In October 2025, Schneider Electric initiated measures to localize the production of modular substations in Asia, aiming to enhance supply chain reliability and reduce customer lead times in the region.

Dive into Technavio’s robust research methodology, blending expert interviews, extensive data synthesis, and validated models for unparalleled Packaged Substation Market insights. See full methodology.

Market Scope
Page number 294
Base year 2025
Historic period 2020-2024
Forecast period 2026-2030
Growth momentum & CAGR Accelerate at a CAGR of 7.2%
Market growth 2026-2030 USD 4862.3 million
Market structure Fragmented
YoY growth 2025-2026(%) 6.9%
Key countries China, India, Japan, South Korea, Indonesia, Australia, US, Canada, Mexico, Germany, UK, France, Italy, Russia, Spain, Saudi Arabia, UAE, South Africa, Turkey, Qatar, Brazil, Argentina and Chile
Competitive landscape Leading Companies, Market Positioning of Companies, Competitive Strategies, and Industry Risks

Request Free Sample

Research Analyst Overview

  • The packaged substation market is evolving from a component-based model to an integrated systems approach, driven by demands for greater operational efficiency and power distribution efficiency. The emphasis on grid modernization and renewable energy integration necessitates advanced electrical infrastructure. Systems such as compact secondary substations, e-house modular substations, and gas-insulated packaged substations are becoming standard.
  • A key trend impacting boardroom decisions is digitalization; investing in intelligent electronic devices and smart grid applications for remote monitoring and control is no longer optional. This shift requires significant capital for power transformers and medium voltage switchgear, but the returns are substantial.
  • For example, integrating smart sensors has been shown to improve fault detection accuracy by over 30%, directly impacting grid stability. This evolution toward smarter, more compact solutions like skid-mounted substations and prefabricated e-house substations is fundamentally reshaping how power distribution networks are designed and managed, focusing on reliability and proactive predictive maintenance.

What are the Key Data Covered in this Packaged Substation Market Research and Growth Report?

  • What is the expected growth of the Packaged Substation Market between 2026 and 2030?

    • USD 4.86 billion, at a CAGR of 7.2%

  • What segmentation does the market report cover?

    • The report is segmented by Application (Industrial, Infrastructure, and Power generation and utilities), Power Rating (Medium, Low, and High), Type (Outdoor packaged substation, Indoor packaged substation, and Underground packaged substation) and Geography (APAC, North America, Europe, Middle East and Africa, South America)

  • Which regions are analyzed in the report?

    • APAC, North America, Europe, Middle East and Africa and South America

  • What are the key growth drivers and market challenges?

    • Rapid urbanization and industrialization, High initial investment costs and financing challenges

  • Who are the major players in the Packaged Substation Market?

    • ABB Ltd., alfanar Group, Ames Impex Electricals Pvt Ltd, C and S Electric Ltd., CG Power and Industrial Ltd., Eaton Corp. Plc, EL Sewedy Electric Co., GE Vernova Inc., Hartek Power Pvt. Ltd., Hitachi Energy Ltd., Hyosung Heavy Industries Corp., Kirloskar Electric Co. Ltd., Larsen and Toubro Ltd., Lucy Electric UK Ltd., Meidensha Corp., Mitsubishi Electric, Raychem RPG Pvt. Ltd., Schneider Electric SE, Siemens Energy AG and Toshiba Corp.

Market Research Insights

  • The market is defined by a shift toward agile prefabricated substation solutions and smart substation technology. This evolution addresses the demand for fast deployment substations in critical energy infrastructure projects. The adoption of digital electricity substation models has led to a 25% reduction in unplanned downtime for some operators.
  • Furthermore, modular containerized electrical room designs and skid-mounted power solutions are enhancing power grid resilience, particularly for industrial power distribution and utility-scale power solutions. These customized substation manufacturing approaches shorten project deployment timelines by up to 50% compared to conventional on-site construction, offering significant cost and operational advantages.
  • This focus on efficiency and adaptability is reshaping substation engineering services and infrastructure development.

We can help! Our analysts can customize this packaged substation market research report to meet your requirements.

Get in touch

1. Executive Summary

1.1 Market overview

Executive Summary - Chart on Market Overview
Executive Summary - Data Table on Market Overview
Executive Summary - Chart on Global Market Characteristics
Executive Summary - Chart on Market by Geography
Executive Summary - Chart on Market Segmentation by Application
Executive Summary - Chart on Market Segmentation by Power Rating
Executive Summary - Chart on Market Segmentation by Type
Executive Summary - Chart on Incremental Growth
Executive Summary - Data Table on Incremental Growth
Executive Summary - Chart on Company Market Positioning

2. Technavio Analysis

2.1 Analysis of price sensitivity, lifecycle, customer purchase basket, adoption rates, and purchase criteria

2.2 Criticality of inputs and Factors of differentiation

Chart on Overview on criticality of inputs and factors of differentiation

2.3 Factors of disruption

Chart on Overview on factors of disruption

2.4 Impact of drivers and challenges

Chart on Impact of drivers and challenges in 2025 and 2030

3. Market Landscape

3.1 Market ecosystem

Chart on Parent Market
Data Table on - Parent Market

3.2 Market characteristics

Chart on Market characteristics analysis

3.3 Value chain analysis

Chart on Value chain analysis

4. Market Sizing

4.1 Market definition

Data Table on Offerings of companies included in the market definition

4.2 Market segment analysis

Market segments

4.3 Market size 2025

4.4 Market outlook: Forecast for 2025-2030

Chart on Global - Market size and forecast 2025-2030 ($ million)
Data Table on Global - Market size and forecast 2025-2030 ($ million)
Chart on Global Market: Year-over-year growth 2025-2030 (%)
Data Table on Global Market: Year-over-year growth 2025-2030 (%)

5. Historic Market Size

5.1 Global Packaged Substation Market 2020 - 2024

Historic Market Size - Data Table on Global Packaged Substation Market 2020 - 2024 ($ million)

5.2 Application segment analysis 2020 - 2024

Historic Market Size - Application Segment 2020 - 2024 ($ million)

5.3 Power Rating segment analysis 2020 - 2024

Historic Market Size - Power Rating Segment 2020 - 2024 ($ million)

5.4 Type segment analysis 2020 - 2024

Historic Market Size - Type Segment 2020 - 2024 ($ million)

5.5 Geography segment analysis 2020 - 2024

Historic Market Size - Geography Segment 2020 - 2024 ($ million)

5.6 Country segment analysis 2020 - 2024

Historic Market Size - Country Segment 2020 - 2024 ($ million)

6. Qualitative Analysis

6.1 Impact of AI on Global Packaged Substation Market

6.2 Impact of Geopolitical Conflict on Global Packaged Substation Market

7. Five Forces Analysis

7.1 Five forces summary

Five forces analysis - Comparison between 2025 and 2030

7.2 Bargaining power of buyers

Bargaining power of buyers - Impact of key factors 2025 and 2030

7.3 Bargaining power of suppliers

Bargaining power of suppliers - Impact of key factors in 2025 and 2030

7.4 Threat of new entrants

Threat of new entrants - Impact of key factors in 2025 and 2030

7.5 Threat of substitutes

Threat of substitutes - Impact of key factors in 2025 and 2030

7.6 Threat of rivalry

Threat of rivalry - Impact of key factors in 2025 and 2030

7.7 Market condition

Chart on Market condition - Five forces 2025 and 2030

8. Market Segmentation by Application

8.1 Market segments

Chart on Application - Market share 2025-2030 (%)
Data Table on Application - Market share 2025-2030 (%)

8.2 Comparison by Application

Chart on Comparison by Application
Data Table on Comparison by Application

8.3 Industrial - Market size and forecast 2025-2030

Chart on Industrial - Market size and forecast 2025-2030 ($ million)
Data Table on Industrial - Market size and forecast 2025-2030 ($ million)
Chart on Industrial - Year-over-year growth 2025-2030 (%)
Data Table on Industrial - Year-over-year growth 2025-2030 (%)

8.4 Infrastructure - Market size and forecast 2025-2030

Chart on Infrastructure - Market size and forecast 2025-2030 ($ million)
Data Table on Infrastructure - Market size and forecast 2025-2030 ($ million)
Chart on Infrastructure - Year-over-year growth 2025-2030 (%)
Data Table on Infrastructure - Year-over-year growth 2025-2030 (%)

8.5 Power generation and utilities - Market size and forecast 2025-2030

Chart on Power generation and utilities - Market size and forecast 2025-2030 ($ million)
Data Table on Power generation and utilities - Market size and forecast 2025-2030 ($ million)
Chart on Power generation and utilities - Year-over-year growth 2025-2030 (%)
Data Table on Power generation and utilities - Year-over-year growth 2025-2030 (%)

8.6 Market opportunity by Application

Market opportunity by Application ($ million)
Data Table on Market opportunity by Application ($ million)

9. Market Segmentation by Power Rating

9.1 Market segments

Chart on Power Rating - Market share 2025-2030 (%)
Data Table on Power Rating - Market share 2025-2030 (%)

9.2 Comparison by Power Rating

Chart on Comparison by Power Rating
Data Table on Comparison by Power Rating

9.3 Medium - Market size and forecast 2025-2030

Chart on Medium - Market size and forecast 2025-2030 ($ million)
Data Table on Medium - Market size and forecast 2025-2030 ($ million)
Chart on Medium - Year-over-year growth 2025-2030 (%)
Data Table on Medium - Year-over-year growth 2025-2030 (%)

9.4 Low - Market size and forecast 2025-2030

Chart on Low - Market size and forecast 2025-2030 ($ million)
Data Table on Low - Market size and forecast 2025-2030 ($ million)
Chart on Low - Year-over-year growth 2025-2030 (%)
Data Table on Low - Year-over-year growth 2025-2030 (%)

9.5 High - Market size and forecast 2025-2030

Chart on High - Market size and forecast 2025-2030 ($ million)
Data Table on High - Market size and forecast 2025-2030 ($ million)
Chart on High - Year-over-year growth 2025-2030 (%)
Data Table on High - Year-over-year growth 2025-2030 (%)

9.6 Market opportunity by Power Rating

Market opportunity by Power Rating ($ million)
Data Table on Market opportunity by Power Rating ($ million)

10. Market Segmentation by Type

10.1 Market segments

Chart on Type - Market share 2025-2030 (%)
Data Table on Type - Market share 2025-2030 (%)

10.2 Comparison by Type

Chart on Comparison by Type
Data Table on Comparison by Type

10.3 Outdoor packaged substation - Market size and forecast 2025-2030

Chart on Outdoor packaged substation - Market size and forecast 2025-2030 ($ million)
Data Table on Outdoor packaged substation - Market size and forecast 2025-2030 ($ million)
Chart on Outdoor packaged substation - Year-over-year growth 2025-2030 (%)
Data Table on Outdoor packaged substation - Year-over-year growth 2025-2030 (%)

10.4 Indoor packaged substation - Market size and forecast 2025-2030

Chart on Indoor packaged substation - Market size and forecast 2025-2030 ($ million)
Data Table on Indoor packaged substation - Market size and forecast 2025-2030 ($ million)
Chart on Indoor packaged substation - Year-over-year growth 2025-2030 (%)
Data Table on Indoor packaged substation - Year-over-year growth 2025-2030 (%)

10.5 Underground packaged substation - Market size and forecast 2025-2030

Chart on Underground packaged substation - Market size and forecast 2025-2030 ($ million)
Data Table on Underground packaged substation - Market size and forecast 2025-2030 ($ million)
Chart on Underground packaged substation - Year-over-year growth 2025-2030 (%)
Data Table on Underground packaged substation - Year-over-year growth 2025-2030 (%)

10.6 Market opportunity by Type

Market opportunity by Type ($ million)
Data Table on Market opportunity by Type ($ million)

11. Customer Landscape

11.1 Customer landscape overview

Analysis of price sensitivity, lifecycle, customer purchase basket, adoption rates, and purchase criteria

12. Geographic Landscape

12.1 Geographic segmentation

Chart on Market share by geography 2025-2030 (%)
Data Table on Market share by geography 2025-2030 (%)

12.2 Geographic comparison

Chart on Geographic comparison
Data Table on Geographic comparison

12.3 APAC - Market size and forecast 2025-2030

Chart on APAC - Market size and forecast 2025-2030 ($ million)
Data Table on APAC - Market size and forecast 2025-2030 ($ million)
Chart on APAC - Year-over-year growth 2025-2030 (%)
Data Table on APAC - Year-over-year growth 2025-2030 (%)
Chart on Regional Comparison - APAC
Data Table on Regional Comparison - APAC

12.3.1 China - Market size and forecast 2025-2030

Chart on China - Market size and forecast 2025-2030 ($ million)
Data Table on China - Market size and forecast 2025-2030 ($ million)
Chart on China - Year-over-year growth 2025-2030 (%)
Data Table on China - Year-over-year growth 2025-2030 (%)

12.3.2 India - Market size and forecast 2025-2030

Chart on India - Market size and forecast 2025-2030 ($ million)
Data Table on India - Market size and forecast 2025-2030 ($ million)
Chart on India - Year-over-year growth 2025-2030 (%)
Data Table on India - Year-over-year growth 2025-2030 (%)

12.3.3 Japan - Market size and forecast 2025-2030

Chart on Japan - Market size and forecast 2025-2030 ($ million)
Data Table on Japan - Market size and forecast 2025-2030 ($ million)
Chart on Japan - Year-over-year growth 2025-2030 (%)
Data Table on Japan - Year-over-year growth 2025-2030 (%)

12.3.4 South Korea - Market size and forecast 2025-2030

Chart on South Korea - Market size and forecast 2025-2030 ($ million)
Data Table on South Korea - Market size and forecast 2025-2030 ($ million)
Chart on South Korea - Year-over-year growth 2025-2030 (%)
Data Table on South Korea - Year-over-year growth 2025-2030 (%)

12.3.5 Indonesia - Market size and forecast 2025-2030

Chart on Indonesia - Market size and forecast 2025-2030 ($ million)
Data Table on Indonesia - Market size and forecast 2025-2030 ($ million)
Chart on Indonesia - Year-over-year growth 2025-2030 (%)
Data Table on Indonesia - Year-over-year growth 2025-2030 (%)

12.3.6 Australia - Market size and forecast 2025-2030

Chart on Australia - Market size and forecast 2025-2030 ($ million)
Data Table on Australia - Market size and forecast 2025-2030 ($ million)
Chart on Australia - Year-over-year growth 2025-2030 (%)
Data Table on Australia - Year-over-year growth 2025-2030 (%)

12.4 North America - Market size and forecast 2025-2030

Chart on North America - Market size and forecast 2025-2030 ($ million)
Data Table on North America - Market size and forecast 2025-2030 ($ million)
Chart on North America - Year-over-year growth 2025-2030 (%)
Data Table on North America - Year-over-year growth 2025-2030 (%)
Chart on Regional Comparison - North America
Data Table on Regional Comparison - North America

12.4.1 US - Market size and forecast 2025-2030

Chart on US - Market size and forecast 2025-2030 ($ million)
Data Table on US - Market size and forecast 2025-2030 ($ million)
Chart on US - Year-over-year growth 2025-2030 (%)
Data Table on US - Year-over-year growth 2025-2030 (%)

12.4.2 Canada - Market size and forecast 2025-2030

Chart on Canada - Market size and forecast 2025-2030 ($ million)
Data Table on Canada - Market size and forecast 2025-2030 ($ million)
Chart on Canada - Year-over-year growth 2025-2030 (%)
Data Table on Canada - Year-over-year growth 2025-2030 (%)

12.4.3 Mexico - Market size and forecast 2025-2030

Chart on Mexico - Market size and forecast 2025-2030 ($ million)
Data Table on Mexico - Market size and forecast 2025-2030 ($ million)
Chart on Mexico - Year-over-year growth 2025-2030 (%)
Data Table on Mexico - Year-over-year growth 2025-2030 (%)

12.5 Europe - Market size and forecast 2025-2030

Chart on Europe - Market size and forecast 2025-2030 ($ million)
Data Table on Europe - Market size and forecast 2025-2030 ($ million)
Chart on Europe - Year-over-year growth 2025-2030 (%)
Data Table on Europe - Year-over-year growth 2025-2030 (%)
Chart on Regional Comparison - Europe
Data Table on Regional Comparison - Europe

12.5.1 Germany - Market size and forecast 2025-2030

Chart on Germany - Market size and forecast 2025-2030 ($ million)
Data Table on Germany - Market size and forecast 2025-2030 ($ million)
Chart on Germany - Year-over-year growth 2025-2030 (%)
Data Table on Germany - Year-over-year growth 2025-2030 (%)

12.5.2 UK - Market size and forecast 2025-2030

Chart on UK - Market size and forecast 2025-2030 ($ million)
Data Table on UK - Market size and forecast 2025-2030 ($ million)
Chart on UK - Year-over-year growth 2025-2030 (%)
Data Table on UK - Year-over-year growth 2025-2030 (%)

12.5.3 France - Market size and forecast 2025-2030

Chart on France - Market size and forecast 2025-2030 ($ million)
Data Table on France - Market size and forecast 2025-2030 ($ million)
Chart on France - Year-over-year growth 2025-2030 (%)
Data Table on France - Year-over-year growth 2025-2030 (%)

12.5.4 Italy - Market size and forecast 2025-2030

Chart on Italy - Market size and forecast 2025-2030 ($ million)
Data Table on Italy - Market size and forecast 2025-2030 ($ million)
Chart on Italy - Year-over-year growth 2025-2030 (%)
Data Table on Italy - Year-over-year growth 2025-2030 (%)

12.5.5 Russia - Market size and forecast 2025-2030

Chart on Russia - Market size and forecast 2025-2030 ($ million)
Data Table on Russia - Market size and forecast 2025-2030 ($ million)
Chart on Russia - Year-over-year growth 2025-2030 (%)
Data Table on Russia - Year-over-year growth 2025-2030 (%)

12.5.6 Spain - Market size and forecast 2025-2030

Chart on Spain - Market size and forecast 2025-2030 ($ million)
Data Table on Spain - Market size and forecast 2025-2030 ($ million)
Chart on Spain - Year-over-year growth 2025-2030 (%)
Data Table on Spain - Year-over-year growth 2025-2030 (%)

12.6 Middle East and Africa - Market size and forecast 2025-2030

Chart on Middle East and Africa - Market size and forecast 2025-2030 ($ million)
Data Table on Middle East and Africa - Market size and forecast 2025-2030 ($ million)
Chart on Middle East and Africa - Year-over-year growth 2025-2030 (%)
Data Table on Middle East and Africa - Year-over-year growth 2025-2030 (%)
Chart on Regional Comparison - Middle East and Africa
Data Table on Regional Comparison - Middle East and Africa

12.6.1 Saudi Arabia - Market size and forecast 2025-2030

Chart on Saudi Arabia - Market size and forecast 2025-2030 ($ million)
Data Table on Saudi Arabia - Market size and forecast 2025-2030 ($ million)
Chart on Saudi Arabia - Year-over-year growth 2025-2030 (%)
Data Table on Saudi Arabia - Year-over-year growth 2025-2030 (%)

12.6.2 UAE - Market size and forecast 2025-2030

Chart on UAE - Market size and forecast 2025-2030 ($ million)
Data Table on UAE - Market size and forecast 2025-2030 ($ million)
Chart on UAE - Year-over-year growth 2025-2030 (%)
Data Table on UAE - Year-over-year growth 2025-2030 (%)

12.6.3 South Africa - Market size and forecast 2025-2030

Chart on South Africa - Market size and forecast 2025-2030 ($ million)
Data Table on South Africa - Market size and forecast 2025-2030 ($ million)
Chart on South Africa - Year-over-year growth 2025-2030 (%)
Data Table on South Africa - Year-over-year growth 2025-2030 (%)

12.6.4 Turkey - Market size and forecast 2025-2030

Chart on Turkey - Market size and forecast 2025-2030 ($ million)
Data Table on Turkey - Market size and forecast 2025-2030 ($ million)
Chart on Turkey - Year-over-year growth 2025-2030 (%)
Data Table on Turkey - Year-over-year growth 2025-2030 (%)

12.6.5 Qatar - Market size and forecast 2025-2030

Chart on Qatar - Market size and forecast 2025-2030 ($ million)
Data Table on Qatar - Market size and forecast 2025-2030 ($ million)
Chart on Qatar - Year-over-year growth 2025-2030 (%)
Data Table on Qatar - Year-over-year growth 2025-2030 (%)

12.7 South America - Market size and forecast 2025-2030

Chart on South America - Market size and forecast 2025-2030 ($ million)
Data Table on South America - Market size and forecast 2025-2030 ($ million)
Chart on South America - Year-over-year growth 2025-2030 (%)
Data Table on South America - Year-over-year growth 2025-2030 (%)
Chart on Regional Comparison - South America
Data Table on Regional Comparison - South America

12.7.1 Brazil - Market size and forecast 2025-2030

Chart on Brazil - Market size and forecast 2025-2030 ($ million)
Data Table on Brazil - Market size and forecast 2025-2030 ($ million)
Chart on Brazil - Year-over-year growth 2025-2030 (%)
Data Table on Brazil - Year-over-year growth 2025-2030 (%)

12.7.2 Argentina - Market size and forecast 2025-2030

Chart on Argentina - Market size and forecast 2025-2030 ($ million)
Data Table on Argentina - Market size and forecast 2025-2030 ($ million)
Chart on Argentina - Year-over-year growth 2025-2030 (%)
Data Table on Argentina - Year-over-year growth 2025-2030 (%)

12.7.3 Chile - Market size and forecast 2025-2030

Chart on Chile - Market size and forecast 2025-2030 ($ million)
Data Table on Chile - Market size and forecast 2025-2030 ($ million)
Chart on Chile - Year-over-year growth 2025-2030 (%)
Data Table on Chile - Year-over-year growth 2025-2030 (%)

12.8 Market opportunity by geography

Market opportunity by geography ($ million)
Data Tables on Market opportunity by geography ($ million)

13. Drivers, Challenges, and Opportunity

13.1 Market drivers

Rapid urbanization and industrialization
Integration of renewable energy sources
Grid modernization and smart grid initiatives

13.2 Market challenges

High initial investment costs and financing challenges
Regulatory hurdles and standardization issues
Shortage of skilled labor and technical expertise

13.3 Impact of drivers and challenges

Impact of drivers and challenges in 2025 and 2030

13.4 Market opportunities

Digitalization and smart integration
Modularity and prefabrication for rapid deployment
Sustainability and eco-friendly solutions

14. Competitive Landscape

14.1 Overview

14.2

Overview on criticality of inputs and factors of differentiation

14.3 Landscape disruption

Overview on factors of disruption

14.4 Industry risks

Impact of key risks on business

15. Competitive Analysis

15.1 Companies profiled

Companies covered

15.2 Company ranking index

15.3 Market positioning of companies

Matrix on companies position and classification

15.4 ABB Ltd.

ABB Ltd. - Overview
ABB Ltd. - Business segments
ABB Ltd. - Key news
ABB Ltd. - Key offerings
ABB Ltd. - Segment focus
SWOT

15.5 alfanar Group

alfanar Group - Overview
alfanar Group - Product / Service
alfanar Group - Key offerings
SWOT

15.6 Ames Impex Electricals Pvt Ltd

Ames Impex Electricals Pvt Ltd - Overview
Ames Impex Electricals Pvt Ltd - Product / Service
Ames Impex Electricals Pvt Ltd - Key offerings
SWOT

15.7 C and S Electric Ltd.

C and S Electric Ltd. - Overview
C and S Electric Ltd. - Product / Service
C and S Electric Ltd. - Key offerings
SWOT

15.8 CG Power and Industrial Ltd.

CG Power and Industrial Ltd. - Overview
CG Power and Industrial Ltd. - Business segments
CG Power and Industrial Ltd. - Key offerings
CG Power and Industrial Ltd. - Segment focus
SWOT

15.9 Eaton Corp. Plc

Eaton Corp. Plc - Overview
Eaton Corp. Plc - Business segments
Eaton Corp. Plc - Key news
Eaton Corp. Plc - Key offerings
Eaton Corp. Plc - Segment focus
SWOT

15.10 GE Vernova Inc.

GE Vernova Inc. - Overview
GE Vernova Inc. - Business segments
GE Vernova Inc. - Key offerings
GE Vernova Inc. - Segment focus
SWOT

15.11 Hitachi Energy Ltd.

Hitachi Energy Ltd. - Overview
Hitachi Energy Ltd. - Product / Service
Hitachi Energy Ltd. - Key offerings
SWOT

15.12 Hyosung Heavy Industries Corp.

Hyosung Heavy Industries Corp. - Overview
Hyosung Heavy Industries Corp. - Product / Service
Hyosung Heavy Industries Corp. - Key offerings
SWOT

15.13 Larsen and Toubro Ltd.

Larsen and Toubro Ltd. - Overview
Larsen and Toubro Ltd. - Business segments
Larsen and Toubro Ltd. - Key offerings
Larsen and Toubro Ltd. - Segment focus
SWOT

15.14 Meidensha Corp.

Meidensha Corp. - Overview
Meidensha Corp. - Business segments
Meidensha Corp. - Key offerings
Meidensha Corp. - Segment focus
SWOT

15.15 Mitsubishi Electric

Mitsubishi Electric - Overview
Mitsubishi Electric - Product / Service
Mitsubishi Electric - Key offerings
SWOT

15.16 Schneider Electric SE

Schneider Electric SE - Overview
Schneider Electric SE - Business segments
Schneider Electric SE - Key news
Schneider Electric SE - Key offerings
Schneider Electric SE - Segment focus
SWOT

15.17 Siemens Energy AG

Siemens Energy AG - Overview
Siemens Energy AG - Business segments
Siemens Energy AG - Key offerings
Siemens Energy AG - Segment focus
SWOT

15.18 Toshiba Corp.

Toshiba Corp. - Overview
Toshiba Corp. - Product / Service
Toshiba Corp. - Key offerings
SWOT

16. Appendix

16.1 Scope of the report

Market definition
Objectives
Notes and caveats

16.2 Inclusions and exclusions checklist

Inclusions checklist
Exclusions checklist

16.3 Currency conversion rates for US$

16.4 Research methodology

16.5 Data procurement

Information sources

16.6 Data validation

16.7 Validation techniques employed for market sizing

16.8 Data synthesis

16.9 360 degree market analysis

16.10 List of abbreviations

Research Methodology

Technavio presents a detailed picture of the market by way of study, synthesis, and summation of data from multiple sources. The analysts have presented the various facets of the market with a particular focus on identifying the key industry influencers. The data thus presented is comprehensive, reliable, and the result of extensive research, both primary and secondary.

INFORMATION SOURCES

Primary sources

  • Manufacturers and suppliers
  • Channel partners
  • Industry experts
  • Strategic decision makers

Secondary sources

  • Industry journals and periodicals
  • Government data
  • Financial reports of key industry players
  • Historical data
  • Press releases

DATA ANALYSIS

Data Synthesis

  • Collation of data
  • Estimation of key figures
  • Analysis of derived insights

Data Validation

  • Triangulation with data models
  • Reference against proprietary databases
  • Corroboration with industry experts

REPORT WRITING

Qualitative

  • Market drivers
  • Market challenges
  • Market trends
  • Five forces analysis

Quantitative

  • Market size and forecast
  • Market segmentation
  • Geographical insights
  • Competitive landscape

Interested in this report?

Get your sample now to see our research methodology and insights!

Download Now

Frequently Asked Questions

Packaged Substation market growth will increase by USD 4862.3 million during 2026-2030.

The Packaged Substation market is expected to grow at a CAGR of 7.2% during 2026-2030.

Packaged Substation market is segmented by Application (Industrial, Infrastructure, Power generation and utilities) Power rating (Medium, Low, High) Type (Outdoor packaged substation, Indoor packaged substation, Underground packaged substation)

ABB Ltd., alfanar Group, Ames Impex Electricals Pvt Ltd, C and S Electric Ltd., CG Power and Industrial Ltd., Eaton Corp. Plc, EL Sewedy Electric Co., GE Vernova Inc., Hartek Power Pvt. Ltd., Hitachi Energy Ltd., Hyosung Heavy Industries Corp., Kirloskar Electric Co. Ltd., Larsen and Toubro Ltd., Lucy Electric UK Ltd., Meidensha Corp., Mitsubishi Electric, Raychem RPG Pvt. Ltd., Schneider Electric SE, Siemens Energy AG, Toshiba Corp. are a few of the key vendors in the Packaged Substation market.

APAC will register the highest growth rate of 55.4% among the other regions. Therefore, the Packaged Substation market in APAC is expected to garner significant business opportunities for the vendors during the forecast period.

China, India, Japan, South Korea, Indonesia, Australia, US, Canada, Mexico, Germany, UK, France, Italy, Russia, Spain, Saudi Arabia, UAE, South Africa, Turkey, Qatar, Brazil, Argentina, Chile

  • Rapid urbanization and industrialization is the driving factor this market.

The Packaged Substation market vendors should focus on grabbing business opportunities from the Application segment as it accounted for the largest market share in the base year.
RIA - Research AI Assistant
Ask RIA