
Patchouli Oil Market Analysis, Size, and Forecast 2026-2030: APAC (China, Japan, and India), South America (Brazil, Argentina, and Chile), North America (US, Canada, and Mexico), Europe (Germany, UK, and France), Middle East and Africa (Saudi Arabia, UAE, and South Africa), and Rest of World (ROW)

Patchouli Oil Market Analysis, Size, and Forecast 2026-2030:
APAC (China, Japan, and India), South America (Brazil, Argentina, and Chile), North America (US, Canada, and Mexico), Europe (Germany, UK, and France), Middle East and Africa (Saudi Arabia, UAE, and South Africa), and Rest of World (ROW)

Published: Oct 2026 289 Pages SKU: IRTNTR73861

Market Overview at a Glance

$9.08 Mn
Market Opportunity
2.2%
CAGR 2025 - 2030
90.6%
APAC Growth
$48.92 Mn
Cosmetics segment 2024

Patchouli Oil Market Size 2026-2030

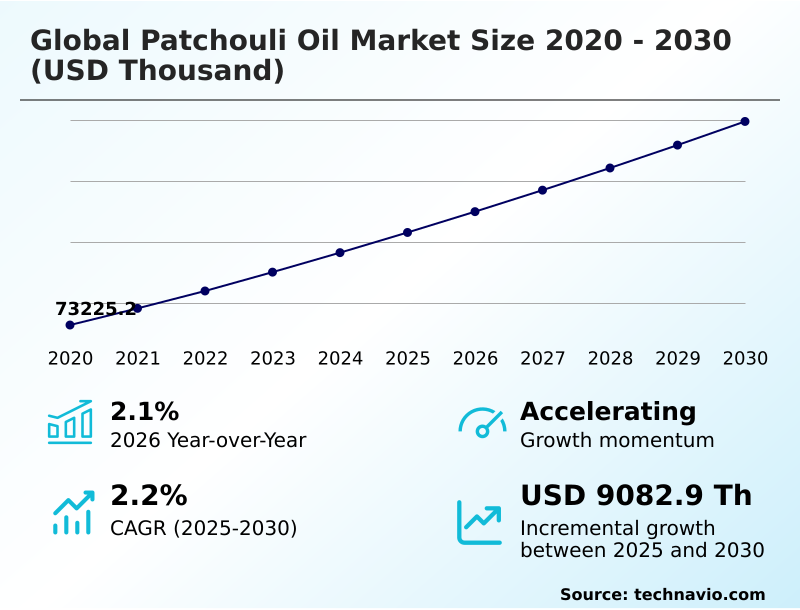
The patchouli oil market size is valued to increase by USD 9.08 million, at a CAGR of 2.2% from 2025 to 2030. Surging demand in premium fine fragrances and clean beauty formulations will drive the patchouli oil market.

Major Market Trends & Insights

  • APAC dominated the market and accounted for a 90.6% growth during the forecast period.
  • By End-user - Cosmetics segment was valued at USD 48.92 million in 2024
  • By Product Type - Dark patchouli oil segment accounted for the largest market revenue share in 2024

Market Size & Forecast

  • Market Opportunities:
  • Market Future Opportunities: USD 9.08 million
  • CAGR from 2025 to 2030 : 2.2%

Market Summary

  • Patchouli Oil operates as a foundational raw material, critical for stabilizing olfactory profiles in high-end personal care and pharmaceutical applications. Formulators increasingly substitute synthetic phthalates replacement with natural patchoulol concentration to meet rigorous regulatory and consumer mandates.
  • In a representative supply chain optimization scenario, fragrance compounding laboratories transitioned from open-fire distillation techniques to stainless steel distillation vessels, resulting in a 25% increase in pure botanical ingredient extraction yields and eliminating ferric leaching. This modernization addresses the primary market driver: surging institutional requirements for clean-label cosmetics and premium fine fragrances.
  • Consequently, manufacturers achieve superior natural fixative properties, extending the longevity of complex hydroalcoholic perfume formulations. However, severe supply chain volatility and monsoon pattern shifts impacting rural cultivation networks create substantial challenges. These upstream agricultural disruptions force essential oil processors to implement stringent drum-level quality control and solar-assisted leaf drying to stabilize crude patchouli distillates availability.
  • Institutional buyers navigate these constraints by establishing direct partnerships with smallholder agricultural farms, ensuring pesticide-free cultivation and reliable inventory flow.

What will be the Size of the Patchouli Oil Market during the forecast period?
Get Key Insights on Market Forecast (PDF) Get Free Sample

How is the Patchouli Oil Market Segmented?

The patchouli oil industry research report provides comprehensive data (region-wise segment analysis), with forecasts and estimates in "USD thousand" for the period 2026-2030, as well as historical data from 2020-2024 for the following segments.

  • End-user
    • Cosmetics
    • Pharmaceuticals
    • Food and beverage
    • Others
  • Product type
    • Dark patchouli oil
    • Light patchouli oil
  • Type
    • Conventional
    • Organic
  • Geography
    • APAC
      • China
      • Japan
      • India
      • South Korea
      • Australia
      • Indonesia
    • South America
      • Brazil
      • Argentina
      • Chile
    • North America
      • US
      • Canada
      • Mexico
    • Europe
      • Germany
      • UK
      • France
      • Italy
      • Spain
      • The Netherlands
    • Middle East and Africa
      • Saudi Arabia
      • UAE
      • South Africa
      • Israel
      • Turkey

By End-user Insights

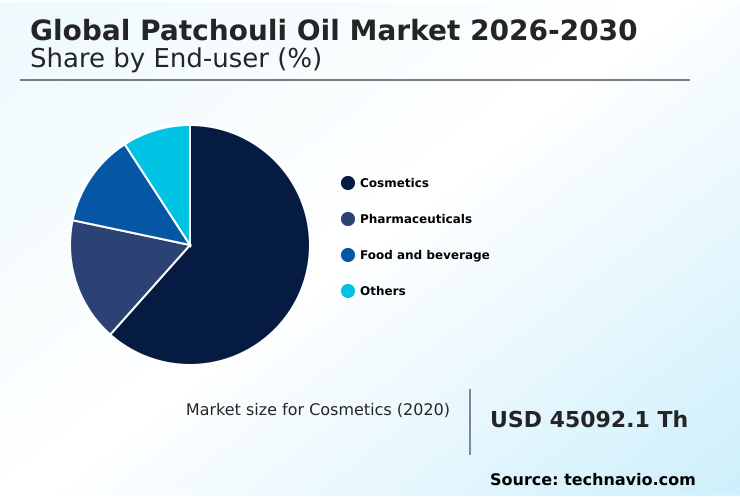
The cosmetics segment is estimated to witness significant growth during the forecast period.

The Cosmetics segment serves as the principal consumer base, where manufacturers heavily leverage advanced fractional distillation techniques to secure pristine raw materials. Commercial reliance on bulk institutional procurement is expanding as premium brands prioritize unadulterated inputs over synthetic masking agents.

Formulators prioritize supercritical fluid extraction, achieving a 15% improvement in purity by ensuring complete ferric leaching prevention. This transition enhances the stability of dermal regeneration serums and anti-inflammatory dermatology formulations by delivering exact bioactive profiles.

By utilizing robust hydroalcoholic perfume formulations alongside traditional phytotherapeutic formulations, cosmetic conglomerates optimize blending efficiency, mitigating supply chain risks while meeting rigorous institutional sourcing criteria across expanding botanical product lines and niche phyto-pharmaceutical applications.
Get Free Sample

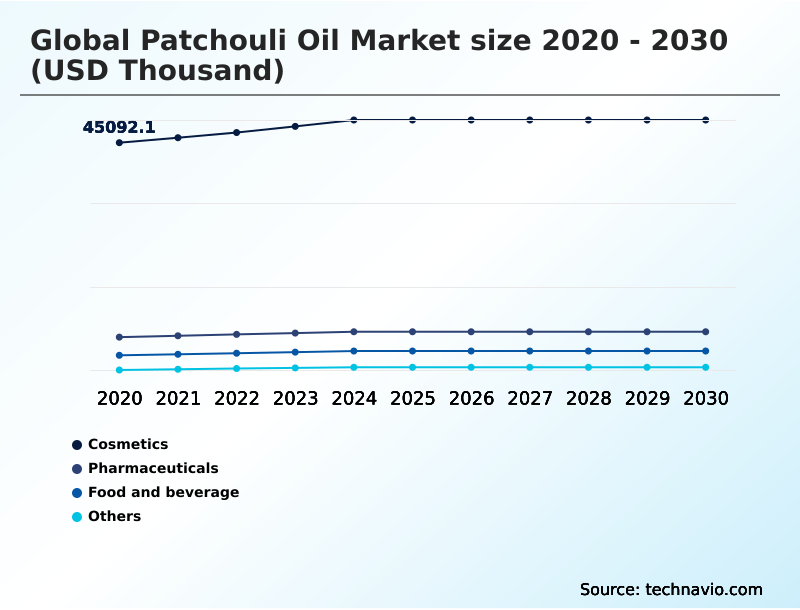
The Cosmetics segment was valued at USD 48.92 million in 2024 and showed a gradual increase during the forecast period.
Get Free Sample

Regional Analysis

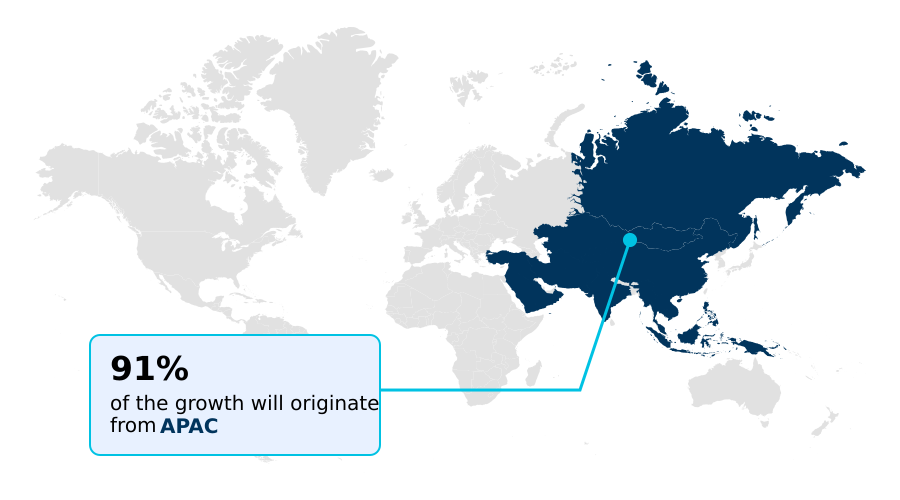
APAC is estimated to contribute 90.6% to the growth of the global market during the forecast period.Technavio’s analysts have elaborately explained the regional trends and drivers that shape the market during the forecast period.
See How Patchouli Oil Market Demand is Rising in APAC Get Free Sample

The geographic landscape demonstrates profound structural divergence between APAC and North America. APAC dominates upstream production, where modernized solar-assisted leaf drying infrastructure and rigorous pesticide-free cultivation have improved extraction efficiency by 22%.

This regional focus on drum-level quality control enables suppliers to maintain consistent alpha-patchoulene and norpatchoulenol profiles despite climate vulnerabilities. Conversely, North America functions as a primary consumption hub, utilizing biotechnology-derived aroma ingredients to scale output.

North American facilities integrating advanced supply chain traceability achieve a 30% reduction in formulation loss compared to traditional blending.

This disparity highlights a network where APAC focuses on agricultural optimization to supply rich oriental fragrance accords, while North American buyers prioritize compliance and consistency to manufacture premium chypre fragrance formulations and transparent beauty goods.

Market Dynamics

Our researchers analyzed the data with 2025 as the base year, along with the key drivers, trends, and challenges. A holistic analysis of drivers will help companies refine their marketing strategies to gain a competitive advantage.

  • The commercial viability of botanical extracts relies heavily on structural innovations across processing and compliance frameworks. To maximize patchoulol extraction yield optimization, refining facilities are systematically replacing outdated iron-pot systems with advanced stainless steel configurations. This infrastructure upgrade prevents ferric degradation and facilitates strict organic certification trace metal filtration, ensuring that final distillates align with rigorous global clean-beauty standards.
  • Consequently, manufacturers achieve a 15% improvement in raw material utilization compared to conventional open-fire processing, driving superior cost-efficiency in bulk institutional procurement. Furthermore, shifting consumer preferences toward high-performance solid-state delivery formats necessitate advanced formulation strategies.
  • The integration of cyclodextrin encapsulated patchouli powder provides enhanced olfactory profile stabilization, extending the shelf life of micronized fragrance formats by protecting delicate active compounds from premature oxidation in high-humidity environments. To secure a consistent supply of these premium inputs, global fragrance compounding laboratories are increasingly investing in sustainable smallholder distillation practices.
  • By establishing direct technical partnerships across rural cultivation networks, buyers mitigate the severe impacts of soil degradation and unpredictable monsoon pattern shifts. Additionally, the adoption of supercritical fluid patchouli extraction techniques is gaining momentum among luxury cosmetic formulators.
  • This method delivers exceptionally pure phyto-pharmaceutical applications without hazardous solvent residues, ultimately lowering compliance costs and reinforcing supply chain traceability for premium anti-inflammatory dermatology products.
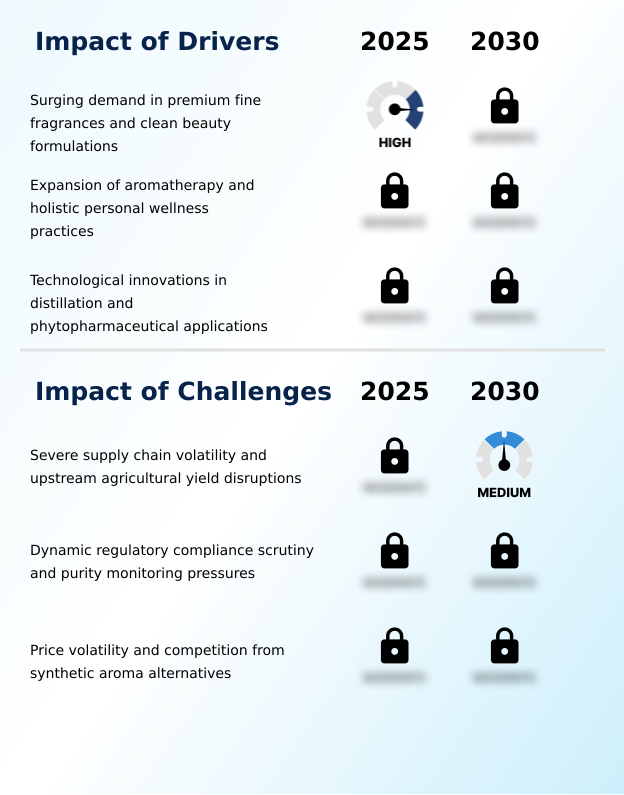
What are the key market drivers leading to the rise in the adoption of Patchouli Oil Industry?

  • The surging demand for premium fine fragrances and clean beauty formulations serves as a primary driver propelling industry expansion.

  • The transition toward clean-label cosmetics and premium fine fragrances acts as the primary catalyst accelerating the utilization of natural fixative properties. Formulators face intensifying regulatory pressure to eliminate petrochemical-derived fixatives and synthetic phthalates replacement in high-end personal care.
  • By utilizing standardized sesquiterpene compounds sourced through sustainable seed-to-scent certification, manufacturers anchor volatile notes and achieve a 25% improvement in scent longevity on human skin.
  • This shift away from artificial compounds minimizes adverse dermatological reactions and reduces chemical compliance bottlenecks by 15%.
  • Institutional reliance on high-purity patchoulol concentration enables cosmetic conglomerates to execute premium pricing strategies, directly increasing operational margins while satisfying the stringent botanical ingredient extraction standards demanded by modern luxury perfumery formulations.

What are the market trends shaping the Patchouli Oil Industry?

  • The surging demand for encapsulated powder formulations represents a prominent upcoming trend. This shift is primarily driven by the need for enhanced stability and extended shelf life in commercial applications.

  • The adoption of cyclodextrin scent encapsulation represents a transformative trend optimizing solid-state delivery formats across the personal care sector. Traditional liquid blending frequently suffers from premature oxidation in high-humidity environments. By converting crude patchouli distillates into micronized cyclodextrin-bound powders, essential oil processors achieve exceptional olfactory profile stabilization.
  • This structural transition reduces volatile fragrance loss during manufacturing by 30% and improves the shelf-life retention of micronized fragrance formats by 18%. The shift is primarily driven by surging demand for long-lasting, concentrated mass-market household detergents that require friction-activated release mechanisms.
  • Consequently, formulators integrating these encapsulated botanical extract technologies lower their reliance on synthetic aroma alternatives, yielding a 22% reduction in compliance-related reformulation costs while accelerating the commercial deployment of high-performance natural goods.

What challenges does the Patchouli Oil Industry face during its growth?

  • Severe supply chain volatility and upstream agricultural yield disruptions constitute major challenges constraining industry expansion.

  • Severe supply chain volatility across smallholder agricultural farms significantly constrains the consistent procurement of high-grade raw materials. Erratic monsoon pattern shifts and escalating soil degradation impacts frequently decimate regional crop yields, causing acute shortages for global fragrance compounding laboratories. Furthermore, reliance on primitive open-fire distillation techniques across rural cultivation networks yields inconsistent gas-chromatography chemical profiles and elevated heavy metal contamination.
  • Facilities dependent on these unstable inputs experience a 20% increase in batch rejection rates and a 12% rise in operational costs associated with mandatory trace heavy metal filtration. To mitigate these structural bottlenecks, processors must heavily subsidize the transition from traditional iron-pot distillation to modern stainless steel distillation vessels, severely compressing near-term capital expenditure budgets.

Exclusive Technavio Analysis on Customer Landscape

The patchouli oil market forecasting report includes the adoption lifecycle of the market, covering from the innovator’s stage to the laggard’s stage. It focuses on adoption rates in different regions based on penetration. Furthermore, the patchouli oil market report also includes key purchase criteria and drivers of price sensitivity to help companies evaluate and develop their market growth analysis strategies.
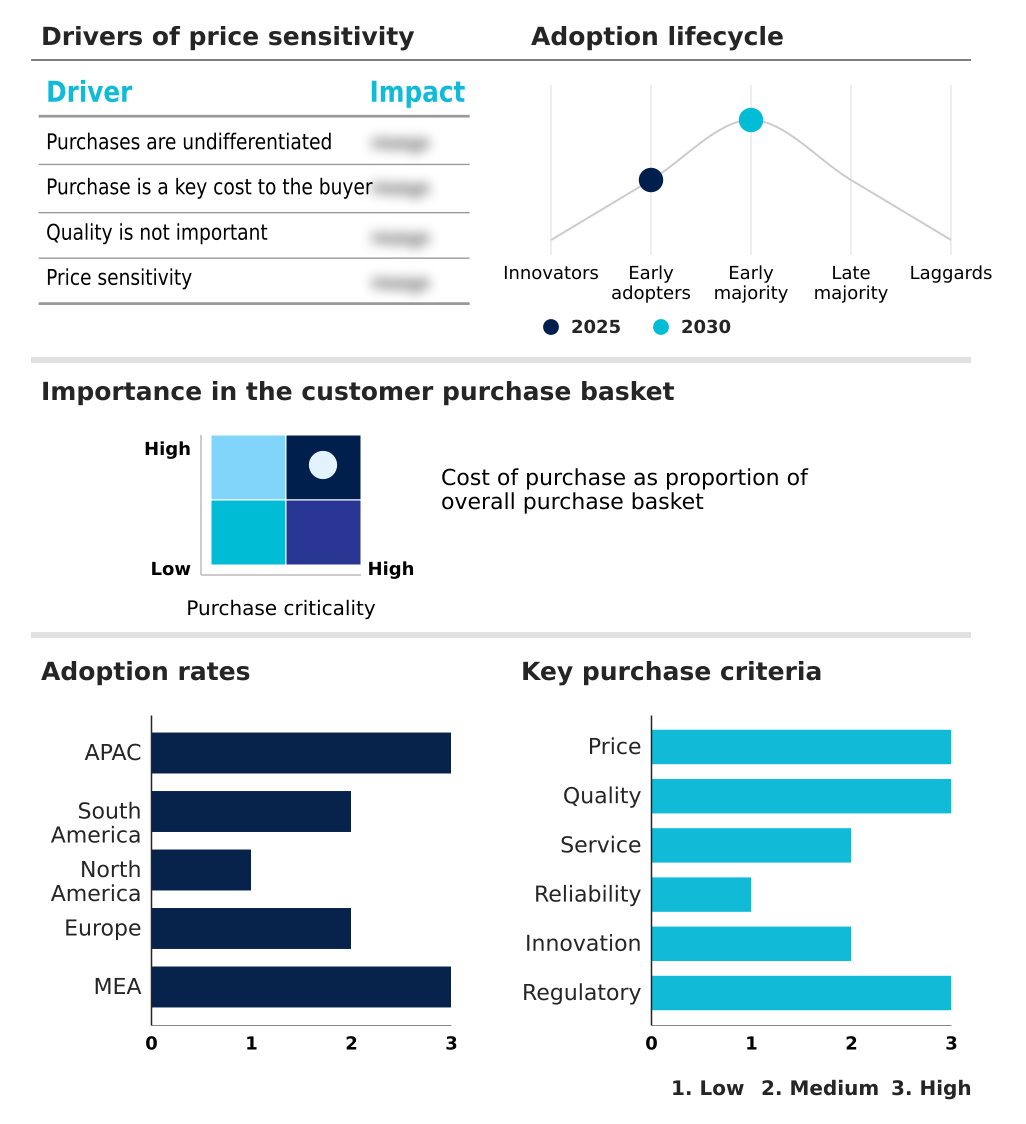
Customer Landscape of Patchouli Oil Industry

Competitive Landscape

Companies are implementing various strategies, such as strategic alliances, patchouli oil market forecast, partnerships, mergers and acquisitions, geographical expansion, and product/service launches, to enhance their presence in the industry.

Berje Inc. - The vendor provides botanical ingredient extraction solutions, delivering refined essential oils and cyclodextrin scent encapsulation formats tailored for premium fine fragrances and clean-label cosmetics.

The industry research and growth report includes detailed analyses of the competitive landscape of the market and information about key companies, including:

  • Berje Inc.
  • Biolandes SAS
  • BONTOUX SAS
  • Citrus and Allied Essences Ltd.
  • DSM Firmenich AG
  • Ernesto Ventos SA
  • Fleurchem Inc.
  • Givaudan SA
  • H. Reynaud and Fils
  • PT Indesso Aroma
  • International Flavors Inc.
  • PT Mitra Ayu Adi Pratama
  • PT. Van Aroma
  • Robertet SA
  • Symrise Group
  • Takasago International Corp.
  • TREATT Plc
  • Ultra International Ltd.
  • V Mane Fils
  • Vigon International Inc.

Qualitative and quantitative analysis of companies has been conducted to help clients understand the wider business environment as well as the strengths and weaknesses of key industry players. Data is qualitatively analyzed to categorize companies as pure play, category-focused, industry-focused, and diversified; it is quantitatively analyzed to categorize companies as dominant, leading, strong, tentative, and weak.

Recent Development and News in Patchouli oil market

  • In the Commodity Chemicals industry, the shift toward sustainable botanical ingredient extraction displaced petrochemical-derived fixatives, directly impacting Patchouli Oil demand by accelerating clean-label cosmetics adoption.
  • Stringent trace heavy metal filtration mandates within consumer chemicals forced essential oil processors to abandon traditional iron-pot distillation, pushing Patchouli Oil production toward stainless steel distillation vessels to meet 100% compliance thresholds.
  • The transition toward solid-state delivery formats in household detergents increased the utilization of cyclodextrin scent encapsulation, boosting Patchouli Oil stability and extending micronized fragrance formats retention by 70% in high-humidity applications.
  • Agricultural supply chain traceability requirements enforced by major fragrance compounding laboratories transformed rural cultivation networks, reducing Patchouli Oil supply volatility by securing drum-level quality control across smallholder agricultural farms.

Dive into Technavio’s robust research methodology, blending expert interviews, extensive data synthesis, and validated models for unparalleled Patchouli Oil Market insights. See full methodology.

Market Scope
Page number 289
Base year 2025
Historic period 2020-2024
Forecast period 2026-2030
Growth momentum & CAGR Accelerate at a CAGR of 2.2%
Market growth 2026-2030 USD 9082.9 thousand
Market structure Fragmented
YoY growth 2025-2026(%) 2.1%
Key countries China, Japan, India, South Korea, Australia, Indonesia, Brazil, Argentina, Chile, US, Canada, Mexico, Germany, UK, France, Italy, Spain, The Netherlands, Saudi Arabia, UAE, South Africa, Israel and Turkey
Competitive landscape Leading Companies, Market Positioning of Companies, Competitive Strategies, and Industry Risks

Request Free Sample

Research Analyst Overview

  • Patchouli Oil functions as a critical structural component in advanced hydroalcoholic perfume formulations, driven by its unique alpha-patchoulene and norpatchoulenol profiles. The industrial shift toward sustainable seed-to-scent certification forces enterprise formulators to restructure their raw material procurement strategies. Fragrance compounding laboratories transitioning to biotechnology-derived aroma ingredients report a 30% reduction in processing time during complex scent compounding.
  • This operational efficiency directly supports strategic product positioning within premium fine fragrances and dermal regeneration serums. To circumvent the high rejection rates associated with trace heavy metal contamination, essential oil processors are aggressively abandoning traditional open-fire methods in favor of supercritical fluid extraction and stainless steel distillation vessels.
  • This modernization prevents ferric leaching and guarantees precise gas-chromatography chemical profiles, enabling cosmetic conglomerates to maintain strict compliance with global dermatological mandates. Furthermore, integrating cyclodextrin scent encapsulation for solid-state delivery formats allows manufacturers to stabilize volatile top notes in mass-market household detergents.
  • By optimizing natural fixative properties through advanced micronized fragrance formats, institutional buyers mitigate raw material price volatility and ensure resilient, high-margin botanical product lines.

What are the Key Data Covered in this Patchouli Oil Market Research and Growth Report?

  • What is the expected growth of the Patchouli Oil Market between 2026 and 2030?

    • USD 9.08 million, at a CAGR of 2.2%

  • What segmentation does the market report cover?

    • The report is segmented by End-user (Cosmetics, Pharmaceuticals, Food and beverage, and Others), Product Type (Dark patchouli oil, and Light patchouli oil), Type (Conventional, and Organic) and Geography (APAC, South America, North America, Europe, Middle East and Africa)

  • Which regions are analyzed in the report?

    • APAC, South America, North America, Europe and Middle East and Africa

  • What are the key growth drivers and market challenges?

    • Surging demand in premium fine fragrances and clean beauty formulations, Severe supply chain volatility and upstream agricultural yield disruptions

  • Who are the major players in the Patchouli Oil Market?

    • Berje Inc., Biolandes SAS, BONTOUX SAS, Citrus and Allied Essences Ltd., DSM Firmenich AG, Ernesto Ventos SA, Fleurchem Inc., Givaudan SA, H. Reynaud and Fils, PT Indesso Aroma, International Flavors Inc., PT Mitra Ayu Adi Pratama, PT. Van Aroma, Robertet SA, Symrise Group, Takasago International Corp., TREATT Plc, Ultra International Ltd., V Mane Fils and Vigon International Inc.

Market Research Insights

  • Patchouli Oil integrates critical sesquiterpene compounds essential for high-performance luxury perfumery formulations. Driven by the expansion of clean-label cosmetics, manufacturers prioritize bulk institutional procurement to secure consistent patchoulol concentration. Processors adopting advanced fractional distillation techniques report a 20% reduction in production downtime and a 15% improvement in scent retention for oriental fragrance accords.
  • Upgrading from traditional iron-pot distillation to modern extraction systems ensures compliance with stringent trace heavy metal filtration mandates. This operational pivot allows essential oil processors to optimize drum-level quality control, minimizing batch rejection rates by up to 18%.
  • By leveraging supply chain traceability, buyers safeguard continuous access to premium ingredients, driving measurable cost reductions and accelerating the deployment of sustainable botanical product lines.

We can help! Our analysts can customize this patchouli oil market research report to meet your requirements.

Get in touch

1. Executive Summary

1.1 Market overview

Executive Summary - Chart on Market Overview
Executive Summary - Data Table on Market Overview
Executive Summary - Chart on Global Market Characteristics
Executive Summary - Chart on Market by Geography
Executive Summary - Chart on Market Segmentation by End-user
Executive Summary - Chart on Market Segmentation by Product Type
Executive Summary - Chart on Market Segmentation by Type
Executive Summary - Chart on Incremental Growth
Executive Summary - Data Table on Incremental Growth
Executive Summary - Chart on Company Market Positioning

2. Technavio Analysis

2.1 Analysis of price sensitivity, lifecycle, customer purchase basket, adoption rates, and purchase criteria

2.2 Criticality of inputs and Factors of differentiation

Chart on Overview on criticality of inputs and factors of differentiation

2.3 Factors of disruption

Chart on Overview on factors of disruption

2.4 Impact of drivers and challenges

Chart on Impact of drivers and challenges in 2025 and 2030

3. Market Landscape

3.1 Market ecosystem

Chart on Parent Market
Data Table on - Parent Market

3.2 Market characteristics

Chart on Market characteristics analysis

3.3 Value chain analysis

Chart on Value chain analysis

4. Market Sizing

4.1 Market definition

Data Table on Offerings of companies included in the market definition

4.2 Market segment analysis

Market segments

4.3 Market size 2025

4.4 Market outlook: Forecast for 2025-2030

Chart on Global - Market size and forecast 2025-2030 ($ thousand)
Data Table on Global - Market size and forecast 2025-2030 ($ thousand)
Chart on Global Market: Year-over-year growth 2025-2030 (%)
Data Table on Global Market: Year-over-year growth 2025-2030 (%)

5. Historic Market Size

5.1 Global Patchouli Oil Market 2020 - 2024

Historic Market Size - Data Table on Global Patchouli Oil Market 2020 - 2024 ($ thousand)

5.2 End-user segment analysis 2020 - 2024

Historic Market Size - End-user Segment 2020 - 2024 ($ thousand)

5.3 Product Type segment analysis 2020 - 2024

Historic Market Size - Product Type Segment 2020 - 2024 ($ thousand)

5.4 Type segment analysis 2020 - 2024

Historic Market Size - Type Segment 2020 - 2024 ($ thousand)

5.5 Geography segment analysis 2020 - 2024

Historic Market Size - Geography Segment 2020 - 2024 ($ thousand)

5.6 Country segment analysis 2020 - 2024

Historic Market Size - Country Segment 2020 - 2024 ($ thousand)

6. Qualitative Analysis

6.1 Impact of AI on Global Patchouli Oil Market

6.2 Impact of geopolitical conflicts on Global Patchouli Oil Market

7. Five Forces Analysis

7.1 Five forces summary

Five forces analysis - Comparison between 2025 and 2030

7.2 Bargaining power of buyers

Bargaining power of buyers - Impact of key factors 2025 and 2030

7.3 Bargaining power of suppliers

Bargaining power of suppliers - Impact of key factors in 2025 and 2030

7.4 Threat of new entrants

Threat of new entrants - Impact of key factors in 2025 and 2030

7.5 Threat of substitutes

Threat of substitutes - Impact of key factors in 2025 and 2030

7.6 Threat of rivalry

Threat of rivalry - Impact of key factors in 2025 and 2030

7.7 Market condition

Chart on Market condition - Five forces 2025 and 2030

8. Market Segmentation by End-user

8.1 Market segments

Chart on End-user - Market share 2025-2030 (%)
Data Table on End-user - Market share 2025-2030 (%)

8.2 Comparison by End-user

Chart on Comparison by End-user
Data Table on Comparison by End-user

8.3 Cosmetics - Market size and forecast 2025-2030

Chart on Cosmetics - Market size and forecast 2025-2030 ($ thousand)
Data Table on Cosmetics - Market size and forecast 2025-2030 ($ thousand)
Chart on Cosmetics - Year-over-year growth 2025-2030 (%)
Data Table on Cosmetics - Year-over-year growth 2025-2030 (%)

8.4 Pharmaceuticals - Market size and forecast 2025-2030

Chart on Pharmaceuticals - Market size and forecast 2025-2030 ($ thousand)
Data Table on Pharmaceuticals - Market size and forecast 2025-2030 ($ thousand)
Chart on Pharmaceuticals - Year-over-year growth 2025-2030 (%)
Data Table on Pharmaceuticals - Year-over-year growth 2025-2030 (%)

8.5 Food and beverage - Market size and forecast 2025-2030

Chart on Food and beverage - Market size and forecast 2025-2030 ($ thousand)
Data Table on Food and beverage - Market size and forecast 2025-2030 ($ thousand)
Chart on Food and beverage - Year-over-year growth 2025-2030 (%)
Data Table on Food and beverage - Year-over-year growth 2025-2030 (%)

8.6 Others - Market size and forecast 2025-2030

Chart on Others - Market size and forecast 2025-2030 ($ thousand)
Data Table on Others - Market size and forecast 2025-2030 ($ thousand)
Chart on Others - Year-over-year growth 2025-2030 (%)
Data Table on Others - Year-over-year growth 2025-2030 (%)

8.7 Market opportunity by End-user

Market opportunity by End-user ($ thousand)
Data Table on Market opportunity by End-user ($ thousand)

9. Market Segmentation by Product Type

9.1 Market segments

Chart on Product Type - Market share 2025-2030 (%)
Data Table on Product Type - Market share 2025-2030 (%)

9.2 Comparison by Product Type

Chart on Comparison by Product Type
Data Table on Comparison by Product Type

9.3 Dark patchouli oil - Market size and forecast 2025-2030

Chart on Dark patchouli oil - Market size and forecast 2025-2030 ($ thousand)
Data Table on Dark patchouli oil - Market size and forecast 2025-2030 ($ thousand)
Chart on Dark patchouli oil - Year-over-year growth 2025-2030 (%)
Data Table on Dark patchouli oil - Year-over-year growth 2025-2030 (%)

9.4 Light patchouli oil - Market size and forecast 2025-2030

Chart on Light patchouli oil - Market size and forecast 2025-2030 ($ thousand)
Data Table on Light patchouli oil - Market size and forecast 2025-2030 ($ thousand)
Chart on Light patchouli oil - Year-over-year growth 2025-2030 (%)
Data Table on Light patchouli oil - Year-over-year growth 2025-2030 (%)

9.5 Market opportunity by Product Type

Market opportunity by Product Type ($ thousand)
Data Table on Market opportunity by Product Type ($ thousand)

10. Market Segmentation by Type

10.1 Market segments

Chart on Type - Market share 2025-2030 (%)
Data Table on Type - Market share 2025-2030 (%)

10.2 Comparison by Type

Chart on Comparison by Type
Data Table on Comparison by Type

10.3 Conventional - Market size and forecast 2025-2030

Chart on Conventional - Market size and forecast 2025-2030 ($ thousand)
Data Table on Conventional - Market size and forecast 2025-2030 ($ thousand)
Chart on Conventional - Year-over-year growth 2025-2030 (%)
Data Table on Conventional - Year-over-year growth 2025-2030 (%)

10.4 Organic - Market size and forecast 2025-2030

Chart on Organic - Market size and forecast 2025-2030 ($ thousand)
Data Table on Organic - Market size and forecast 2025-2030 ($ thousand)
Chart on Organic - Year-over-year growth 2025-2030 (%)
Data Table on Organic - Year-over-year growth 2025-2030 (%)

10.5 Market opportunity by Type

Market opportunity by Type ($ thousand)
Data Table on Market opportunity by Type ($ thousand)

11. Customer Landscape

11.1 Customer landscape overview

Analysis of price sensitivity, lifecycle, customer purchase basket, adoption rates, and purchase criteria

12. Geographic Landscape

12.1 Geographic segmentation

Chart on Market share by geography 2025-2030 (%)
Data Table on Market share by geography 2025-2030 (%)

12.2 Geographic comparison

Chart on Geographic comparison
Data Table on Geographic comparison

12.3 APAC - Market size and forecast 2025-2030

Chart on APAC - Market size and forecast 2025-2030 ($ thousand)
Data Table on APAC - Market size and forecast 2025-2030 ($ thousand)
Chart on APAC - Year-over-year growth 2025-2030 (%)
Data Table on APAC - Year-over-year growth 2025-2030 (%)
Chart on Regional Comparison - APAC
Data Table on Regional Comparison - APAC

12.3.1 China - Market size and forecast 2025-2030

Chart on China - Market size and forecast 2025-2030 ($ thousand)
Data Table on China - Market size and forecast 2025-2030 ($ thousand)
Chart on China - Year-over-year growth 2025-2030 (%)
Data Table on China - Year-over-year growth 2025-2030 (%)

12.3.2 Japan - Market size and forecast 2025-2030

Chart on Japan - Market size and forecast 2025-2030 ($ thousand)
Data Table on Japan - Market size and forecast 2025-2030 ($ thousand)
Chart on Japan - Year-over-year growth 2025-2030 (%)
Data Table on Japan - Year-over-year growth 2025-2030 (%)

12.3.3 India - Market size and forecast 2025-2030

Chart on India - Market size and forecast 2025-2030 ($ thousand)
Data Table on India - Market size and forecast 2025-2030 ($ thousand)
Chart on India - Year-over-year growth 2025-2030 (%)
Data Table on India - Year-over-year growth 2025-2030 (%)

12.3.4 South Korea - Market size and forecast 2025-2030

Chart on South Korea - Market size and forecast 2025-2030 ($ thousand)
Data Table on South Korea - Market size and forecast 2025-2030 ($ thousand)
Chart on South Korea - Year-over-year growth 2025-2030 (%)
Data Table on South Korea - Year-over-year growth 2025-2030 (%)

12.3.5 Australia - Market size and forecast 2025-2030

Chart on Australia - Market size and forecast 2025-2030 ($ thousand)
Data Table on Australia - Market size and forecast 2025-2030 ($ thousand)
Chart on Australia - Year-over-year growth 2025-2030 (%)
Data Table on Australia - Year-over-year growth 2025-2030 (%)

12.3.6 Indonesia - Market size and forecast 2025-2030

Chart on Indonesia - Market size and forecast 2025-2030 ($ thousand)
Data Table on Indonesia - Market size and forecast 2025-2030 ($ thousand)
Chart on Indonesia - Year-over-year growth 2025-2030 (%)
Data Table on Indonesia - Year-over-year growth 2025-2030 (%)

12.4 South America - Market size and forecast 2025-2030

Chart on South America - Market size and forecast 2025-2030 ($ thousand)
Data Table on South America - Market size and forecast 2025-2030 ($ thousand)
Chart on South America - Year-over-year growth 2025-2030 (%)
Data Table on South America - Year-over-year growth 2025-2030 (%)
Chart on Regional Comparison - South America
Data Table on Regional Comparison - South America

12.4.1 Brazil - Market size and forecast 2025-2030

Chart on Brazil - Market size and forecast 2025-2030 ($ thousand)
Data Table on Brazil - Market size and forecast 2025-2030 ($ thousand)
Chart on Brazil - Year-over-year growth 2025-2030 (%)
Data Table on Brazil - Year-over-year growth 2025-2030 (%)

12.4.2 Argentina - Market size and forecast 2025-2030

Chart on Argentina - Market size and forecast 2025-2030 ($ thousand)
Data Table on Argentina - Market size and forecast 2025-2030 ($ thousand)
Chart on Argentina - Year-over-year growth 2025-2030 (%)
Data Table on Argentina - Year-over-year growth 2025-2030 (%)

12.4.3 Chile - Market size and forecast 2025-2030

Chart on Chile - Market size and forecast 2025-2030 ($ thousand)
Data Table on Chile - Market size and forecast 2025-2030 ($ thousand)
Chart on Chile - Year-over-year growth 2025-2030 (%)
Data Table on Chile - Year-over-year growth 2025-2030 (%)

12.5 North America - Market size and forecast 2025-2030

Chart on North America - Market size and forecast 2025-2030 ($ thousand)
Data Table on North America - Market size and forecast 2025-2030 ($ thousand)
Chart on North America - Year-over-year growth 2025-2030 (%)
Data Table on North America - Year-over-year growth 2025-2030 (%)
Chart on Regional Comparison - North America
Data Table on Regional Comparison - North America

12.5.1 US - Market size and forecast 2025-2030

Chart on US - Market size and forecast 2025-2030 ($ thousand)
Data Table on US - Market size and forecast 2025-2030 ($ thousand)
Chart on US - Year-over-year growth 2025-2030 (%)
Data Table on US - Year-over-year growth 2025-2030 (%)

12.5.2 Canada - Market size and forecast 2025-2030

Chart on Canada - Market size and forecast 2025-2030 ($ thousand)
Data Table on Canada - Market size and forecast 2025-2030 ($ thousand)
Chart on Canada - Year-over-year growth 2025-2030 (%)
Data Table on Canada - Year-over-year growth 2025-2030 (%)

12.5.3 Mexico - Market size and forecast 2025-2030

Chart on Mexico - Market size and forecast 2025-2030 ($ thousand)
Data Table on Mexico - Market size and forecast 2025-2030 ($ thousand)
Chart on Mexico - Year-over-year growth 2025-2030 (%)
Data Table on Mexico - Year-over-year growth 2025-2030 (%)

12.6 Europe - Market size and forecast 2025-2030

Chart on Europe - Market size and forecast 2025-2030 ($ thousand)
Data Table on Europe - Market size and forecast 2025-2030 ($ thousand)
Chart on Europe - Year-over-year growth 2025-2030 (%)
Data Table on Europe - Year-over-year growth 2025-2030 (%)
Chart on Regional Comparison - Europe
Data Table on Regional Comparison - Europe

12.6.1 Germany - Market size and forecast 2025-2030

Chart on Germany - Market size and forecast 2025-2030 ($ thousand)
Data Table on Germany - Market size and forecast 2025-2030 ($ thousand)
Chart on Germany - Year-over-year growth 2025-2030 (%)
Data Table on Germany - Year-over-year growth 2025-2030 (%)

12.6.2 UK - Market size and forecast 2025-2030

Chart on UK - Market size and forecast 2025-2030 ($ thousand)
Data Table on UK - Market size and forecast 2025-2030 ($ thousand)
Chart on UK - Year-over-year growth 2025-2030 (%)
Data Table on UK - Year-over-year growth 2025-2030 (%)

12.6.3 France - Market size and forecast 2025-2030

Chart on France - Market size and forecast 2025-2030 ($ thousand)
Data Table on France - Market size and forecast 2025-2030 ($ thousand)
Chart on France - Year-over-year growth 2025-2030 (%)
Data Table on France - Year-over-year growth 2025-2030 (%)

12.6.4 Italy - Market size and forecast 2025-2030

Chart on Italy - Market size and forecast 2025-2030 ($ thousand)
Data Table on Italy - Market size and forecast 2025-2030 ($ thousand)
Chart on Italy - Year-over-year growth 2025-2030 (%)
Data Table on Italy - Year-over-year growth 2025-2030 (%)

12.6.5 Spain - Market size and forecast 2025-2030

Chart on Spain - Market size and forecast 2025-2030 ($ thousand)
Data Table on Spain - Market size and forecast 2025-2030 ($ thousand)
Chart on Spain - Year-over-year growth 2025-2030 (%)
Data Table on Spain - Year-over-year growth 2025-2030 (%)

12.6.6 The Netherlands - Market size and forecast 2025-2030

Chart on The Netherlands - Market size and forecast 2025-2030 ($ thousand)
Data Table on The Netherlands - Market size and forecast 2025-2030 ($ thousand)
Chart on The Netherlands - Year-over-year growth 2025-2030 (%)
Data Table on The Netherlands - Year-over-year growth 2025-2030 (%)

12.7 Middle East and Africa - Market size and forecast 2025-2030

Chart on Middle East and Africa - Market size and forecast 2025-2030 ($ thousand)
Data Table on Middle East and Africa - Market size and forecast 2025-2030 ($ thousand)
Chart on Middle East and Africa - Year-over-year growth 2025-2030 (%)
Data Table on Middle East and Africa - Year-over-year growth 2025-2030 (%)
Chart on Regional Comparison - Middle East and Africa
Data Table on Regional Comparison - Middle East and Africa

12.7.1 Saudi Arabia - Market size and forecast 2025-2030

Chart on Saudi Arabia - Market size and forecast 2025-2030 ($ thousand)
Data Table on Saudi Arabia - Market size and forecast 2025-2030 ($ thousand)
Chart on Saudi Arabia - Year-over-year growth 2025-2030 (%)
Data Table on Saudi Arabia - Year-over-year growth 2025-2030 (%)

12.7.2 UAE - Market size and forecast 2025-2030

Chart on UAE - Market size and forecast 2025-2030 ($ thousand)
Data Table on UAE - Market size and forecast 2025-2030 ($ thousand)
Chart on UAE - Year-over-year growth 2025-2030 (%)
Data Table on UAE - Year-over-year growth 2025-2030 (%)

12.7.3 South Africa - Market size and forecast 2025-2030

Chart on South Africa - Market size and forecast 2025-2030 ($ thousand)
Data Table on South Africa - Market size and forecast 2025-2030 ($ thousand)
Chart on South Africa - Year-over-year growth 2025-2030 (%)
Data Table on South Africa - Year-over-year growth 2025-2030 (%)

12.7.4 Israel - Market size and forecast 2025-2030

Chart on Israel - Market size and forecast 2025-2030 ($ thousand)
Data Table on Israel - Market size and forecast 2025-2030 ($ thousand)
Chart on Israel - Year-over-year growth 2025-2030 (%)
Data Table on Israel - Year-over-year growth 2025-2030 (%)

12.7.5 Turkey - Market size and forecast 2025-2030

Chart on Turkey - Market size and forecast 2025-2030 ($ thousand)
Data Table on Turkey - Market size and forecast 2025-2030 ($ thousand)
Chart on Turkey - Year-over-year growth 2025-2030 (%)
Data Table on Turkey - Year-over-year growth 2025-2030 (%)

12.8 Market opportunity by geography

Market opportunity by geography ($ thousand)
Data Tables on Market opportunity by geography ($ thousand)

13. Drivers, Challenges, and Opportunity

13.1 Market drivers

Surging demand in premium fine fragrances and clean beauty formulations
Expansion of aromatherapy and holistic personal wellness practices
Technological innovations in distillation and phytopharmaceutical applications

13.2 Market challenges

Severe supply chain volatility and upstream agricultural yield disruptions
Dynamic regulatory compliance scrutiny and purity monitoring pressures
Price volatility and competition from synthetic aroma alternatives

13.3 Impact of drivers and challenges

Impact of drivers and challenges in 2025 and 2030

13.4 Market opportunities

Surging demand for encapsulated powder formulations
Adoption of advanced distillation technology protocols
Expansion of solar leaf drying infrastructure

14. Competitive Landscape

14.1 Overview

14.2

Overview on criticality of inputs and factors of differentiation

14.3 Landscape disruption

Overview on factors of disruption

14.4 Industry risks

Impact of key risks on business

15. Competitive Analysis

15.1 Companies profiled

Companies covered

15.2 Company ranking index

15.3 Market positioning of companies

Matrix on companies position and classification

15.4 Berje Inc.

Berje Inc. - Overview
Berje Inc. - Product / Service
Berje Inc. - Key offerings
SWOT

15.5 Biolandes SAS

Biolandes SAS - Overview
Biolandes SAS - Product / Service
Biolandes SAS - Key offerings
SWOT

15.6 Citrus and Allied Essences Ltd.

Citrus and Allied Essences Ltd. - Overview
Citrus and Allied Essences Ltd. - Product / Service
Citrus and Allied Essences Ltd. - Key offerings
SWOT

15.7 DSM Firmenich AG

DSM Firmenich AG - Overview
DSM Firmenich AG - Business segments
DSM Firmenich AG - Key offerings
DSM Firmenich AG - Segment focus
SWOT

15.8 Ernesto Ventos SA

Ernesto Ventos SA - Overview
Ernesto Ventos SA - Product / Service
Ernesto Ventos SA - Key offerings
SWOT

15.9 Givaudan SA

Givaudan SA - Overview
Givaudan SA - Business segments
Givaudan SA - Key news
Givaudan SA - Key offerings
Givaudan SA - Segment focus
SWOT

15.10 H. Reynaud and Fils

H. Reynaud and Fils - Overview
H. Reynaud and Fils - Product / Service
H. Reynaud and Fils - Key offerings
SWOT

15.11 PT Indesso Aroma

PT Indesso Aroma - Overview
PT Indesso Aroma - Product / Service
PT Indesso Aroma - Key offerings
SWOT

15.12 International Flavors Inc.

International Flavors Inc. - Overview
International Flavors Inc. - Business segments
International Flavors Inc. - Key news
International Flavors Inc. - Key offerings
International Flavors Inc. - Segment focus
SWOT

15.13 Robertet SA

Robertet SA - Overview
Robertet SA - Business segments
Robertet SA - Key offerings
Robertet SA - Segment focus
SWOT

15.14 Symrise Group

Symrise Group - Overview
Symrise Group - Business segments
Symrise Group - Key news
Symrise Group - Key offerings
Symrise Group - Segment focus
SWOT

15.15 Takasago International Corp.

Takasago International Corp. - Overview
Takasago International Corp. - Business segments
Takasago International Corp. - Key offerings
Takasago International Corp. - Segment focus
SWOT

15.16 TREATT Plc

TREATT Plc - Overview
TREATT Plc - Product / Service
TREATT Plc - Key offerings
SWOT

15.17 V Mane Fils

V Mane Fils - Overview
V Mane Fils - Product / Service
V Mane Fils - Key offerings
SWOT

15.18 Vigon International Inc.

Vigon International Inc. - Overview
Vigon International Inc. - Product / Service
Vigon International Inc. - Key offerings
SWOT

16. Appendix

16.1 Scope of the report

Market definition
Objectives
Notes and caveats

16.2 Inclusions and exclusions checklist

Inclusions checklist
Exclusions checklist

16.3 Currency conversion rates for US$

16.4 Research methodology

16.5 Data procurement

Information sources

16.6 Data validation

16.7 Validation techniques employed for market sizing

16.8 Data synthesis

16.9 360 degree market analysis

16.10 List of abbreviations

Research Methodology

Technavio presents a detailed picture of the market by way of study, synthesis, and summation of data from multiple sources. The analysts have presented the various facets of the market with a particular focus on identifying the key industry influencers. The data thus presented is comprehensive, reliable, and the result of extensive research, both primary and secondary.

INFORMATION SOURCES

Primary sources

  • Manufacturers and suppliers
  • Channel partners
  • Industry experts
  • Strategic decision makers

Secondary sources

  • Industry journals and periodicals
  • Government data
  • Financial reports of key industry players
  • Historical data
  • Press releases

DATA ANALYSIS

Data Synthesis

  • Collation of data
  • Estimation of key figures
  • Analysis of derived insights

Data Validation

  • Triangulation with data models
  • Reference against proprietary databases
  • Corroboration with industry experts

REPORT WRITING

Qualitative

  • Market drivers
  • Market challenges
  • Market trends
  • Five forces analysis

Quantitative

  • Market size and forecast
  • Market segmentation
  • Geographical insights
  • Competitive landscape

Interested in this report?

Get your sample now to see our research methodology and insights!

Download Now

Frequently Asked Questions

Patchouli Oil market growth will increase by USD 9082.9 thousand thousand during 2026-2030.

The Patchouli Oil market is expected to grow at a CAGR of 2.2% during 2026-2030.

Patchouli Oil market is segmented by End-user (Cosmetics, Pharmaceuticals, Food and beverage, Others) Product type (Dark patchouli oil, Light patchouli oil) Type (Conventional, Organic)

Berje Inc., Biolandes SAS, BONTOUX SAS, Citrus and Allied Essences Ltd., DSM Firmenich AG, Ernesto Ventos SA, Fleurchem Inc., Givaudan SA, H. Reynaud and Fils, PT Indesso Aroma, International Flavors Inc., PT Mitra Ayu Adi Pratama, PT. Van Aroma, Robertet SA, Symrise Group, Takasago International Corp., TREATT Plc, Ultra International Ltd., V Mane Fils, Vigon International Inc. are a few of the key vendors in the Patchouli Oil market.

APAC will register the highest growth rate of 90.6% among the other regions. Therefore, the Patchouli Oil market in APAC is expected to garner significant business opportunities for the vendors during the forecast period.

China, Japan, India, South Korea, Australia, Indonesia, Brazil, Argentina, Chile, US, Canada, Mexico, Germany, UK, France, Italy, Spain, The Netherlands, Saudi Arabia, UAE, South Africa, Israel, Turkey

  • Surging demand in premium fine fragrances and clean beauty formulations is the driving factor this market.

The Patchouli Oil market vendors should focus on grabbing business opportunities from the End-user segment as it accounted for the largest market share in the base year.
RIA - Research AI Assistant
Ask RIA
