Pelvic Floor Diagnostics Market Size 2025-2029
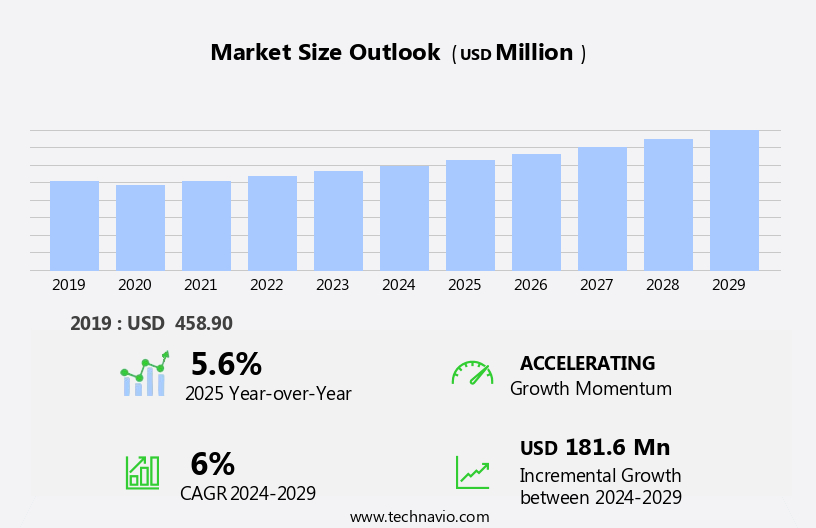
The pelvic floor diagnostics market size is forecast to increase by USD 181.6 million at a CAGR of 6% between 2024 and 2029.
- The market is experiencing significant growth due to the increasing prevalence of urinary incontinence, particularly among the aging population. With an estimated 25 million adults In the US alone suffering from urinary incontinence, the demand for accurate and effective diagnostic tools is on the rise. One such innovation gaining traction is Ambulatory Urodynamic Monitoring (AUM), which offers the advantages of being less invasive and more convenient than traditional urodynamic tests. Ultrasound Systems and Urodynamics Systems are commonly employed for floor diagnostics due to their ability to provide valuable information on the structure and function of the pelvic organs and associated muscles, ligaments, and pressure systems.
- However, the high cost of pelvic floor diagnostics products poses a significant challenge for market growth. Despite this, opportunities abound for companies that can offer cost-effective solutions or differentiated offerings that cater to the unique needs of this patient population. As the global geriatric population continues to expand, the demand for pelvic floor diagnostics is expected to increase, making this an attractive market for investors and innovators alike. Companies seeking to capitalize on these opportunities must navigate the competitive landscape and address the affordability challenge to succeed.
What will be the Size of the Pelvic Floor Diagnostics Market during the forecast period?
- The market encompasses a range of technologies and techniques used to assess pelvic floor conditions, including urodynamics systems, 3D Ultrasound, and noninvasive imaging. These diagnostic tools play a crucial role in identifying various pelvic floor disorders, such as pelvic organ prolapse, urinary incontinence, fecal issues, and uterus disorders. Pelvic floor problems can lead to a range of medical conditions, including bladder control issues, risk of prolapse, and pelvic pain. The market is driven by the growing prevalence of pelvic floor disorders, which are estimated to affect millions of individuals worldwide. Factors contributing to this trend include aging populations, increasing awareness of pelvic floor health, and the availability of advanced diagnostic technologies.
- As a result, the market is experiencing significant growth, with ongoing innovation in areas such as mobile diagnostics, personalized diagnostics, and pelvic floor rehabilitation. Pelvic floor assessment and treatment options, including pelvic floor, pelvic floor therapy, and pelvic floor strengthening exercises, are becoming increasingly important in managing these conditions and improving overall pelvic floor health.
How is this Pelvic Floor Diagnostics Industry segmented?
The industry research report provides comprehensive data (region-wise segment analysis), with forecasts and estimates in "USD million" for the period 2025-2029, as well as historical data from 2019-2023 for the following segments.
- Product
- Ultrasound system
- Uroflowmetry
- Anorectal manometry system
- Urodynamic catheters
- Others
- End-user
- Hospital
- Diagnostic imaging centres and specialised clinics
- Age Group
- Adult
- Geriatric
- Pediatric
- Geography
- North America
- US
- Canada
- Europe
- France
- Germany
- Italy
- UK
- Asia
- Rest of World (ROW)
- North America
By Product Insights
The ultrasound system segment is estimated to witness significant growth during the forecast period. The market is witnessing significant growth due to the increasing prevalence of pelvic floor disorders, such as urinary and fecal incontinence, pelvic organ prolapse, and bladder dysfunction. Ultrasound systems are gaining popularity In the market for diagnosing these conditions, as they provide non-invasive imaging of the pelvic floor muscles and organs. Uroflowmetry devices and anal manometry systems are also essential diagnostic tools for assessing urethral functions, urinary flow, and anal sphincter functions. The aging population and demographic shift towards geriatric populations are contributing to the market growth, as these populations are at a higher risk of pelvic floor disorders. Healthcare expenditure and reimbursement structures are key factors influencing the market, with specialized clinics and diagnostic centers offering comprehensive assessments and treatment plans.
Market participants include diagnostic instrument manufacturers, regional distributors, and healthcare providers. Technical training and continuous patient monitoring are crucial for accurate diagnoses and effective treatment. Diagnostic imaging technologies, such as MRI and 4D ultrasound, are also being used for advanced pelvic floor evaluations. Despite the costly nature of some diagnostic tests and procedures, early diagnoses and conservative treatments, such as physical therapy, are becoming more common. Remote consultations and home healthcare solutions are also emerging trends In the market. However, reimbursement challenges and cultural sensitivities remain barriers to widespread adoption.
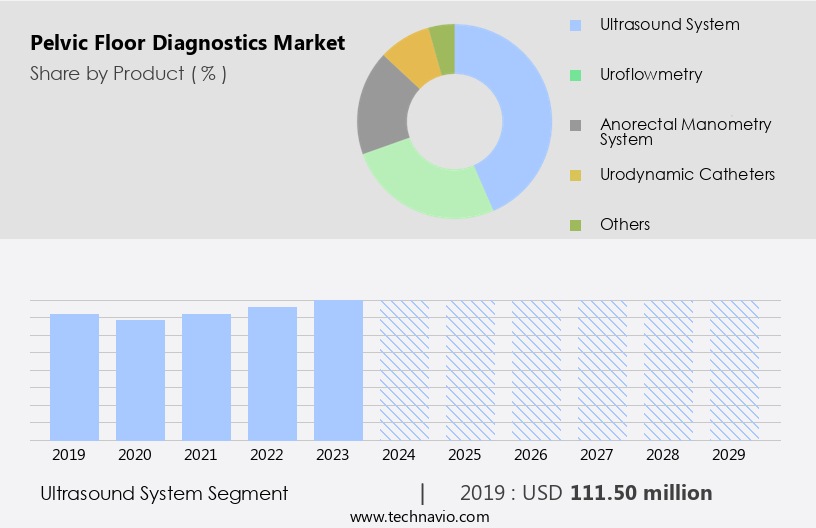
Get a glance at the market report of share of various segments Request Free Sample
The Ultrasound system segment was valued at USD 111.50 million in 2019 and showed a gradual increase during the forecast period.
Regional Analysis
North America is estimated to contribute 40% to the growth of the global market during the forecast period. Technavio's analysts have elaborately explained the regional trends and drivers that shape the market during the forecast period.

For more insights on the market size of various regions, Request Free Sample
The North American market is projected to expand during the forecast period, with the US being the largest market in this region. Factors driving market growth include the increasing geriatric population and rising incidences, such as urinary incontinence and bladder dysfunction. These conditions have led to an increase in urodynamic monitoring, thereby fueling demand for diagnostics. Technologically advanced diagnostic tools, including ultrasound systems, anal manometry systems, and urodynamics systems, are increasingly being used for comprehensive assessments and treatment plans. Healthcare providers are focusing on early diagnoses and specialized care to improve patient outcomes.
Diagnostic centers and specialized clinics are increasingly adopting diagnostic imaging technologies, such as ultrasound imaging and MRI technology, for non-invasive evaluations. Reimbursement structures and healthcare spending are also key considerations for market participants. The market is characterized by the presence of several diagnostic instruments and equipment providers, regional distributors, and healthcare facilities offering technical training and diagnostic services. Remote diagnostic consultations and home healthcare solutions are also gaining popularity for their convenience and cost-effectiveness. However, reimbursement challenges and cultural sensitivities remain key challenges for market growth.
Market Dynamics
Our researchers analyzed the data with 2024 as the base year, along with the key drivers, trends, and challenges. A holistic analysis of drivers will help companies refine their marketing strategies to gain a competitive advantage.
What are the key market drivers leading to the rise In the adoption of Pelvic Floor Diagnostics Industry?
- An increase in prevalence of urinary incontinence coupled with rise in geriatric population is the key driver of the market. Pelvic floor disorders, such as urinary incontinence, refer to the involuntary leakage of urine. This condition can result from various factors, including age-related changes In the urinary tract and underlying health conditions like cognitive impairment, stroke, diabetes, and mobility issues. The prevalence of incontinence increases with age. For instance, the incontinence rate in individuals between 65 and 74 years is 26% for men and 55% for women.
- This rate rises to 35% for men and 56% for women in those aged 75 and above. These statistics underscore the significance of realising and addressing pelvic floor disorders, particularly in older populations.
What are the market trends shaping the Pelvic Floor Diagnostics Industry?
- The increasing demand for ambulatory urodynamic monitoring (AUM) is the upcoming market trend. Ambulatory Urodynamics (AUM) is an emerging diagnostic method for investigating lower urinary tract dysfunction. Unlike conventional urodynamic tests, AUM allows patients to be mobile during the examination, offering several advantages. This method, which continuously monitors pressure during voiding, enables patients to perform daily activities without interruption. Conventional tests, such as those using a Cystometer, may fail to recognize urine leakage or other irregularities under more physiological conditions.
- AUM systems are more patient-friendly, as they do not require restrictive patient positioning or prohibitive costs. Urologists and other physicians are increasingly recommending AUM as a reliable and effective method for evaluating the functioning of the lower urinary tract. This trend is expected to continue as AUM becomes an established diagnostic tool In the medical community.
What challenges does the Pelvic Floor Diagnostics Industry face during its growth?
- High cost of pelvic floor diagnostics products is a key challenge affecting the industry growth. Urodynamic equipment, including video urodynamics, uroflowmeters, electromyograph systems, and ultrasound, are significant investments for healthcare institutions due to their high cost and classification as capital items. The procurement process for these endoscopic devices involves extensive procedures and budget considerations. Advancements in diagnostics, including MRI technology, telemedicine, and remote consultations, enable continuous patient monitoring and more cost-effective care.
- MRI technology is an advanced imaging method used to diagnose pelvic floor disorders, particularly in cases where ultrasound imaging is insufficient. Equipment maintenance also adds to the financial burden for end-users. Advanced urodynamic monitoring technologies have led to increased equipment prices, particularly for video urodynamic systems, making treatments inaccessible for patients in developing economies. Consequently, hospitals and diagnostic centers charge substantial fees for pelvic floor diagnostics testing procedures, which can hinder their adoption due to the high costs.
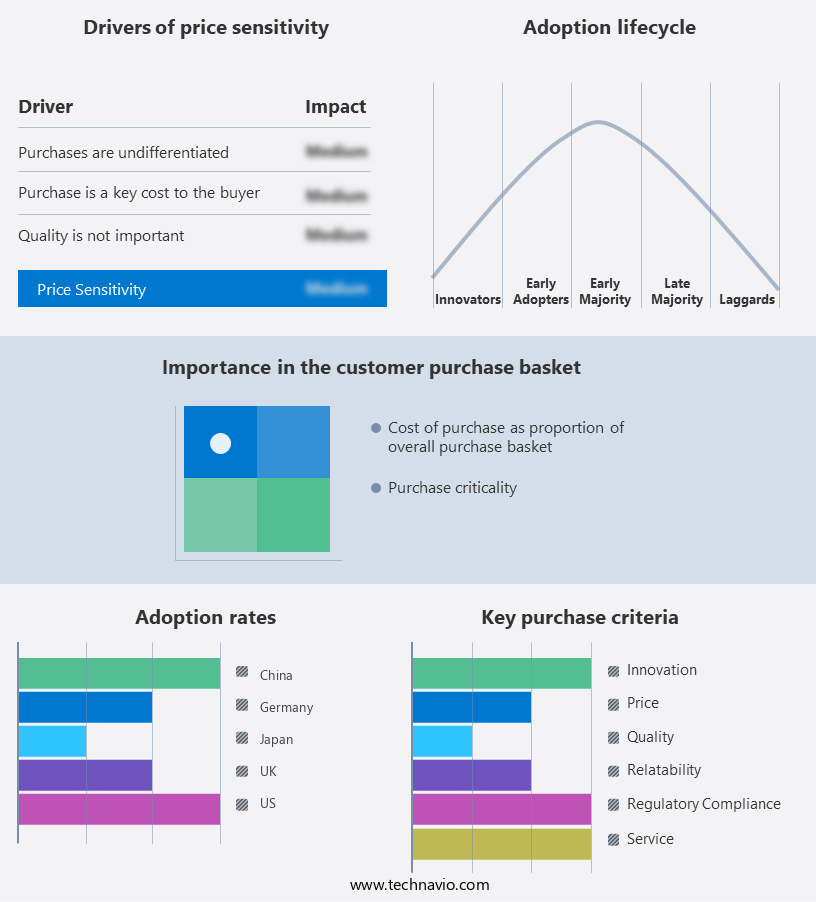
Exclusive Customer Landscape
The market forecasting report includes the adoption lifecycle of the market, covering from the innovator's stage to the laggard's stage. It focuses on adoption rates in different regions based on penetration. Furthermore, the market report also includes key purchase criteria and drivers of price sensitivity to help companies evaluate and develop their market growth analysis strategies.
Customer Landscape
Key Companies & Market Insights
Companies are implementing various strategies, such as strategic alliances, market forecast, partnerships, mergers and acquisitions, geographical expansion, and product/service launches, to enhance their presence In the industry.
Alacer Biomedica: The company offers a pelvic floor diagnostic system called Uranus II Urodynamics equipment
The industry research and growth report includes detailed analyses of the competitive landscape of the market and information about key companies, including:
- Alacer Biomedica
- Cadwell Industries Inc.
- Caldera Medical Inc.
- Diversatek Inc.
- FEMSelect Ltd.
- GE Healthcare Technologies Inc.
- Halo Medical Technologies
- HC Italia srl
- KARL STORZ SE and Co. KG
- Laborie
- MEDKONSULT medical technology s. r. o
- Medspira LLC
- Medtronic Plc
- Neurosoft
- Noraxon USA Inc.
- Renovia Inc.
- SRS Medical
- Stryker Corp.
- THD S.p.A
- The Cooper Companies Inc.
Qualitative and quantitative analysis of companies has been conducted to help clients understand the wider business environment as well as the strengths and weaknesses of key industry players. Data is qualitatively analyzed to categorize companies as pure play, category-focused, industry-focused, and diversified; it is quantitatively analyzed to categorize companies as dominant, leading, strong, tentative, and weak.
Research Analyst Overview
Pelvic floor diagnostics refers to the processes and techniques used to assess the function and integrity of the pelvic floor muscles and organs. These diagnostics play a crucial role in identifying various medical conditions affecting the pelvic region, including urinary incontinence, fecal issues, pelvic organ prolapse, and other pelvic floor disorders. Uroflowmetry devices and anal manometry are two essential diagnostic tools used in the assessments. Uroflowmetry measures urinary flow rate and volume, providing valuable information about bladder emptying function. Anal manometry, on the other hand, evaluates the function of the anal sphincter and detects issues related to fecal incontinence. These conditions can result from injuries, medical conditions such as arthritis, or abnormalities affecting the pelvis, pubic bone, coccyx, and pelvic organs like the bladder, bowel, and uterus.
Healthcare expenditure and reimbursement structures significantly influence the market. As healthcare spending continues to rise, there is a growing demand for cost-effective and efficient diagnostic solutions. Reimbursement structures also impact market participants, as they may influence the adoption of certain diagnostic technologies and techniques. The human pelvic region encompasses various organs, including the bladder, uterus, and rectum. Diagnostic imaging plays a vital role in assessing the health of these organs. Ultrasound imaging, both 2D and 4D, is a non-invasive and widely used diagnostic technology for visualizing pelvic organs.
Pelvic floor disorders can affect individuals of all ages, including expectant mothers and pregnant women. Early diagnoses are essential for effective treatment and management of these conditions. Diagnostic centers and specialized clinics offer comprehensive assessments, enabling healthcare providers to develop personalized treatment plans based on accurate diagnostic information. The aging population and demographic shifts contribute to the growing prevalence. Geriatric populations are at a higher risk of developing pelvic floor disorders due to the natural aging process and other factors. Prostate disorders and lifestyle changes are also significant contributors to the issues in male populations.
Diagnostic processes involve the collection and analysis of patient data, including test results and medical history. This information is crucial for healthcare providers to make informed decisions regarding treatment plans and patient care. Remote diagnostic consultations and home healthcare solutions enable early diagnoses and ongoing monitoring, improving patient outcomes and reducing healthcare costs. The market is characterized by various market participants, including diagnostic equipment manufacturers, regional distributors, and healthcare facilities. Technical training and specialized care are essential for skilled professionals to effectively use diagnostic instruments and equipment, ensuring accurate diagnoses and optimal patient care. Reimbursement challenges and costly diagnostic procedures may limit the adoption of certain diagnostic technologies and techniques.
Conservative treatments, such as physical therapy and lifestyle modifications, are increasingly being considered as alternatives to invasive procedures. Continuous patient monitoring and advanced diagnostic tools, such as urodynamic systems and software solutions, are driving innovation In the market. Cultural sensitivities and healthcare infrastructure variations can impact the adoption and implementation of diagnostics in different regions. Academic institutions and healthcare companies are collaborating to develop new diagnostic techniques and technologies, addressing these challenges and improving patient care. In summary, pelvic floor diagnostics play a vital role in identifying and managing various disorders. The market is influenced by factors such as healthcare expenditure, reimbursement structures, demographic shifts, and technological advancements. Effective collaboration between healthcare providers, diagnostic centers, and medical technology companies is essential for delivering accurate diagnoses, optimizing patient care, and reducing healthcare costs.
|
Market Scope |
|
|
Report Coverage |
Details |
|
Page number |
217 |
|
Base year |
2024 |
|
Historic period |
2019-2023 |
|
Forecast period |
2025-2029 |
|
Growth momentum & CAGR |
Accelerate at a CAGR of 6% |
|
Market growth 2025-2029 |
USD 181.6 million |
|
Market structure |
Fragmented |
|
YoY growth 2024-2025(%) |
5.6 |
|
Key countries |
US, Canada, Germany, China, UK, France, Japan, India, Italy, and South Korea |
|
Competitive landscape |
Leading Companies, Market Positioning of Companies, Competitive Strategies, and Industry Risks |
What are the Key Data Covered in this Market Research and Growth Report?
- CAGR of the industry during the forecast period
- Detailed information on factors that will drive the growth and forecasting between 2025 and 2029
- Precise estimation of the size of the market and its contribution of the industry in focus to the parent market
- Accurate predictions about upcoming growth and trends and changes in consumer behaviour
- Growth of the market across North America, Europe, Asia, and Rest of World (ROW)
- Thorough analysis of the market's competitive landscape and detailed information about companies
- Comprehensive analysis of factors that will challenge the market growth of industry companies
We can help! Our analysts can customize this market research report to meet your requirements.
 RIA -
RIA - 
