Pet Treats Market Analysis, Size, and Forecast 2024-2028: North America (US, Canada, and Mexico), Europe (France, Germany, and UK), Middle East and Africa (UAE), APAC (China, India, Indonesia, Japan, Malaysia, South Korea, and Thailand), South America (Brazil), and Rest of World (ROW)

Pet Treats Market Analysis, Size, and Forecast 2024-2028:
North America (US, Canada, and Mexico), Europe (France, Germany, and UK), Middle East and Africa (UAE), APAC (China, India, Indonesia, Japan, Malaysia, South Korea, and Thailand), South America (Brazil), and Rest of World (ROW)

Published: Oct 2024 159 Pages SKU: IRTNTR76562

Market Overview at a Glance

$9.10 B
Market Opportunity
6.6%
CAGR
6.4
YoY growth 2023-2024(%)

Pet Treats Market Size 2024-2028

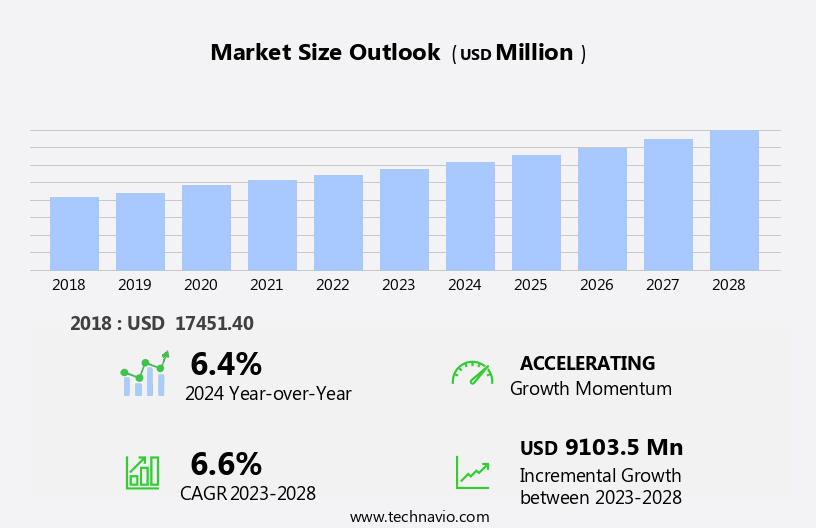
The pet treats market size is forecast to increase by USD 9.1 billion, at a CAGR of 6.6% between 2023 and 2028.

  • The market is experiencing significant growth, driven by the increasing demand for organic and  pet foods and the growing preference for natural and organic options. This trend is fueled by the rising awareness among pet owners regarding the health benefits of organic pet treats and their desire to provide the best for their pets. However, the market faces challenges as well, with the increasing instances of pet allergies being a major concern. Pet owners are becoming more vigilant about the ingredients in their pets' food, and companies must ensure their products are free from common allergens to cater to this demand.
  • Navigating this landscape requires a deep understanding of consumer preferences and the ability to offer high-quality, allergy-friendly options. Companies that can successfully address these trends and challenges will be well-positioned to capitalize on the market's potential for growth.

What will be the Size of the Pet Treats Market during the forecast period?

Pet Treats Market Size

Explore in-depth regional segment analysis with market size data - historical 2018-2022 and forecasts 2024-2028 - in the full report.  
Request Free Sample

The pet treat market continues to evolve, with innovations and trends shaping its dynamics. Freeze-dried pet food and treats, for instance, have gained popularity due to their ability to preserve the natural nutrients and flavors of the ingredients. Novel protein sources, such as kangaroo and venison, are also finding their way into pet treats, catering to the growing demand for dietary diversity. Dehydrated pet treats, grain-free, and functional treats are other categories witnessing significant growth. Manufacturers are continually exploring new ways to enhance palatability and functionality. For example, some are integrating probiotics into pet treats to support digestive health. Others are focusing on natural and organic ingredients to cater to the increasing preference for clean-label products.

The treat manufacturing process is also undergoing changes, with an emphasis on automation and improved efficiency. Packaging is another area of focus, with sustainable and eco-friendly options gaining traction. Single-source protein treats and dental pet chews are other emerging categories, addressing specific pet health concerns. Limited ingredient diets and hypoallergenic pet food are also driving demand for specialized pet treats. Functional pet treats, which offer health benefits beyond basic nutrition, are a growing segment. These treats may contain ingredients like omega-3 fatty acids, glucosamine, and chondroitin to support joint health, or probiotics for digestive health. Overall, the pet treat market is a dynamic and evolving landscape, with manufacturers continually innovating to meet the changing needs and preferences of pet owners.

How is this Pet Treats Industry segmented?

The pet treats industry research report provides comprehensive data (region-wise segment analysis), with forecasts and estimates in "USD million" for the period 2024-2028, as well as historical data from 2018-2022 for the following segments.

  • Distribution Channel
    • Offline
    • Online
  • Type
    • Dog
    • Cat
    • Others
  • Product Type
    • Chews
    • Jerky
    • Biscuits
    • Others
  • Form
    • Dental Treats
    • Natural Treats
    • Functional Treats
    • Others
  • Geography
    • North America
      • US
      • Canada
      • Mexico
    • Europe
      • France
      • Germany
      • UK
    • Middle East and Africa
      • UAE
    • APAC
      • China
      • India
      • Indonesia
      • Japan
      • Malaysia
      • South Korea
      • Thailand
    • South America
      • Brazil
    • Rest of World (ROW)

By Distribution Channel Insights

The offline segment is estimated to witness significant growth during the forecast period.

In the dynamic pet treat market, baked pet treats continue to gain popularity due to their palatability and variety, with cat treat recipes and limited ingredient diets catering to specific pet needs. Ingredients for both dog and cat treats prioritize natural sources and novel proteins, including probiotics for enhanced digestibility. Freeze-dried and dehydrated pet treats offer long shelf life and convenience, while grain-free and functional pet treats cater to health-conscious pet owners. Single-source protein treats and hypoallergenic pet food are essential options for pets with sensitivities. Pet treat manufacturing processes prioritize quality and safety, ensuring digestibility and palatability. Organic pet snacks further appeal to consumers seeking ethical and sustainable options.

Dental pet chews and dental treats are increasingly demanded for pet oral health. Offline distribution channels, including pet specialty stores, veterinary clinics, supermarkets, and grocery stores, remain significant due to their accessibility and the trust they build through knowledgeable staff.

Pet Treats Market Size

Request Free Sample

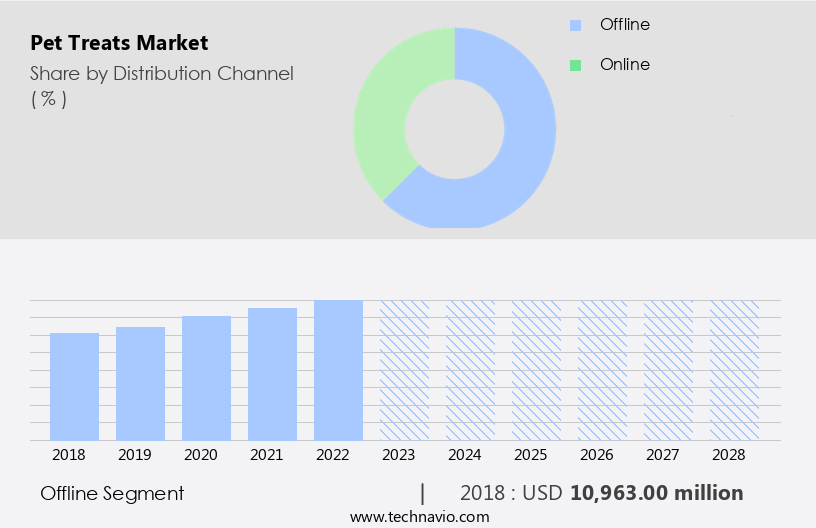
The Offline segment was valued at USD 10.96 billion in 2018 and showed a gradual increase during the forecast period.

Regional Analysis

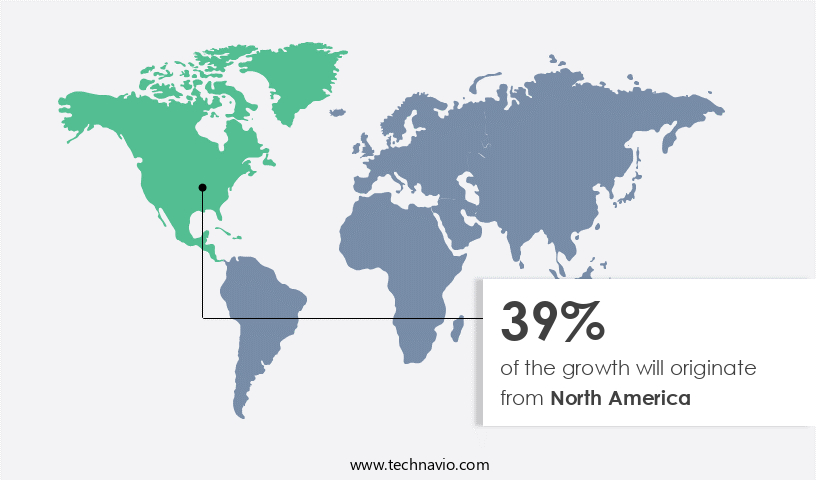
North America is estimated to contribute 39% to the growth of the global market during the forecast period.Technavio's analysts have elaborately explained the regional trends and drivers that shape the market during the forecast period.

Pet Treats Market Share by Geography

 Request Free Sample

The market in North America is experiencing notable growth due to the increasing number of pet owners who view their pets as family members. This trend has led to a heightened demand for high-quality, nutritious, and gourmet treats. Baked pet treats, both for cats and dogs, are gaining popularity with the rise of homemade cat treat recipes and limited ingredient diets. The market offers a variety of options, including probiotic pet treats, freeze-dried, dehydrated, and single-source protein treats. Novel protein sources and grain-free pet treats cater to pets with specific dietary needs. Functional pet treats, such as dental chews and hypoallergenic pet food, provide additional health benefits.

Natural pet snacks made through the treat manufacturing process are preferred by health-conscious pet owners. Organic pet snacks and pet treat packaging ensure transparency and peace of mind for consumers. Pet treat formulation focuses on palatability, digestibility, and functional ingredients to meet the evolving needs of pets and their owners.

Market Dynamics

Our researchers analyzed the data with 2023 as the base year, along with the key drivers, trends, and challenges. A holistic analysis of drivers will help companies refine their marketing strategies to gain a competitive advantage.

B2B pet treats supply solutions leverage advanced pet food technologies for quality. Pet treats market growth opportunities 2025 include pet treats for retail and natural pet treat products, meeting demand. Pet treats supply chain software optimizes operations, while pet treats market competitive analysis highlights key brands. Sustainable pet treat practices align with eco-friendly pet food trends. Pet treats regulations 2024-2028 shapes pet treats demand in North America 2025. Premium pet treat solutions and pet treats market insights boost adoption. Pet treats for pet stores and customized pet treat formulations target niches. Pet treats market challenges and solutions address safety, with direct procurement strategies for pet treats and pet treats pricing optimization enhancing profitability. Data-driven pet treats analytics and healthy pet food trends drive innovation.

What are the key market drivers leading to the rise in the adoption of Pet Treats Industry?

  • The increasing preference for organic food products extends to the pet industry, driving a significant market growth for organic pet food offerings. 
  • Pet treats, specifically baked ones, have gained significant traction in the market as pet owners prioritize their furry friends' health and wellbeing. The demand for cat treat recipes and dog treat ingredients that adhere to limited ingredient diets is on the rise. Probiotic pet treats are also popular due to their potential health benefits. Organic pet treats, made with plant and animal ingredients that meet USDA regulations, are increasingly preferred. These ingredients must be grown free from pesticides, artificial fertilizers, genetic modification, irradiation, and sewage sludge. Animal ingredients must come from animals raised on organic feed, given access to the outdoors, and not treated with antibiotics or hormones.
  • Consumers are more conscious of their pets' dietary needs and are seeking natural and organic options. The popularity of organic and natural food in human consumption has influenced this trend.  The market is witnessing a shift towards organic and natural ingredients, driven by consumer awareness and preferences.

What are the market trends shaping the Pet Treats Industry?

  • The growing preference for natural and organic pet treats represents a significant market trend. Consumers are increasingly seeking out high-quality, health-conscious options for their pets, driving demand for natural and organic pet treat products.
  • Pet treat market is witnessing a significant shift towards natural and organic options as consumers prioritize their pets' health. This trend is driven by the growing awareness of the connection between nutrition and pet well-being. As a result, there is a rising demand for pet treats made from novel protein sources, such as freeze-dried and dehydrated options. Transparency in labeling is also crucial for consumers, who prefer recognizable, natural ingredients. Manufacturers are addressing this need by providing clear and detailed information on their product labels.
  • Functional pet treats, which offer additional health benefits, are gaining popularity due to their perceived value. The market is expected to continue growing as pet owners remain committed to providing their pets with the best possible nutrition.

What challenges does the Pet Treats Industry face during its growth?

  • The rise in pet allergies among pet owners poses a significant challenge to the industry's growth, necessitating continuous research and development of hypoallergenic pet breeds and products to cater to this expanding market. 
  • The natural pet snacks market is driven by growing concerns over pet health and wellbeing, leading to an increased demand for high-quality, safe treats. The treat manufacturing process prioritizes single-source protein treats to minimize the risk of contamination from harmful bacteria like Campylobacter jejuni. These bacteria can be transmitted to humans, especially children, through contact with animals. Furthermore, cats and birds are common causes of allergies in humans, with some proteins in their saliva and urine triggering skin allergies. Approximately 15%-30% of allergies, such as asthma and allergic rhinitis, are attributed to dogs or cats.
  • To cater to this demand, pet treat palatability and packaging have become essential factors in the market. Manufacturers focus on creating immersive, harmonious packaging designs that appeal to pet owners while ensuring the safety and freshness of the treats.

Exclusive Customer Landscape

The pet treats market forecasting report includes the adoption lifecycle of the market, covering from the innovator's stage to the laggard's stage. It focuses on adoption rates in different regions based on penetration. Furthermore, the pet treats market report also includes key purchase criteria and drivers of price sensitivity to help companies evaluate and develop their market growth analysis strategies.

Pet Treats Market Share by Geography

 Customer Landscape

Key Companies & Market Insights

Companies are implementing various strategies, such as strategic alliances, pet treats market forecast, partnerships, mergers and acquisitions, geographical expansion, and product/service launches, to enhance their presence in the industry.

Addiction Pet Foods - This company specializes in producing soft and flavorful pet treats, such as Meaty Bites, which enhance formulations and improve pet nutrition. Their offerings cater to the growing demand for high-quality, nutritious pet food solutions. The treats' unique formulation sets them apart, ensuring pets receive optimal nourishment.

The industry research and growth report includes detailed analyses of the competitive landscape of the market and information about key companies, including:

  • Addiction Pet Foods
  • Arden Grange
  • Assisi Pet Care Ltd.
  • Canine India
  • Colgate Palmolive Co.
  • General Mills Inc.
  • heristo aktiengesellschaft
  • Mars Inc.
  • Nestle SA
  • Nulo Pet Food
  • Plato Pet Treats
  • PPN Ltd. Partnership
  • Primal Pet Foods Inc.
  • Schell and Kampeter Inc.
  • Spectrum Brands Holdings Inc.
  • The J.M Smucker Co.
  • Unicharm Corp.
  • Vegeco Ltd
  • Wellness Pet Co. Inc.
  • Wiggles

Qualitative and quantitative analysis of companies has been conducted to help clients understand the wider business environment as well as the strengths and weaknesses of key industry players. Data is qualitatively analyzed to categorize companies as pure play, category-focused, industry-focused, and diversified; it is quantitatively analyzed to categorize companies as dominant, leading, strong, tentative, and weak.

Recent Development and News in Pet Treats Market

  • In January 2024, Mars, Incorporated, a leading global food company, announced the launch of a new line of grain-free pet treats, "Mars Petcare's Wholesomes Grain Free," in response to the growing consumer demand for grain-free pet food options (Mars, Inc. Press Release, 2024).
  • In March 2024, Blue Buffalo, a prominent pet food manufacturer, entered into a strategic partnership with Chewy, an e-commerce platform for pet food and supplies, to expand its online presence and reach a broader customer base (Blue Buffalo Press Release, 2024).
  • In May 2025, Nestlé Purina PetCare Company, a subsidiary of Nestlé, completed the acquisition of Ainsworth Pet Nutrition, a leading manufacturer of pet treats and supplies, for approximately USD1.7 billion, expanding its product offerings and market presence (Nestlé SA Press Release, 2025).
  • In April 2025, the European Commission approved the use of insect proteins as an ingredient in pet food, opening up a new market for sustainable and eco-friendly pet treats (European Commission Press Release, 2025). This approval is expected to encourage the growth of startups and established players in the pet treats industry to invest in insect protein production for pet food applications.

Research Analyst Overview

  • The pet treat market continues to evolve, with a growing emphasis on sustainability and recycling initiatives. Consumers are increasingly conscious of the environmental impact of their purchasing decisions, leading to a demand for eco-friendly pet treats. Companies are responding by exploring ways to reduce waste and minimize their carbon footprint in the production process. Pet treat recycling programs, for instance, are gaining traction as a means of repurposing manufacturing byproducts and reducing the amount of waste sent to landfills.
  • This trend is expected to shape the market dynamics in the coming years, as businesses strive to meet the evolving needs and values of pet-loving consumers.

Dive into Technavio's robust research methodology, blending expert interviews, extensive data synthesis, and validated models for unparalleled Pet Treats Market insights. See full methodology.

Market Scope

Report Coverage

Details

Page number

159

Base year

2023

Historic period

2018-2022

Forecast period

2024-2028

Growth momentum & CAGR

Accelerate at a CAGR of 6.6%

Market growth 2024-2028

USD 9103.5 million

Market structure

Fragmented

YoY growth 2023-2024(%)

6.4

Key countries

US, Malaysia, Indonesia, Germany, UK, South Korea, France, Canada, Brazil, Thailand, UAE, Mexico, China, Japan, and India

Competitive landscape

Leading Companies, Market Positioning of Companies, Competitive Strategies, and Industry Risks

Request Free Sample

What are the Key Data Covered in this Pet Treats Market Research and Growth Report?

  • CAGR of the Pet Treats industry during the forecast period
  • Detailed information on factors that will drive the growth and forecasting between 2024 and 2028
  • Precise estimation of the size of the market and its contribution of the industry in focus to the parent market
  • Accurate predictions about upcoming growth and trends and changes in consumer behaviour
  • Growth of the market across North America, Europe, APAC, South America, and Middle East and Africa
  • Thorough analysis of the market's competitive landscape and detailed information about companies
  • Comprehensive analysis of factors that will challenge the pet treats market growth of industry companies

We can help! Our analysts can customize this pet treats market research report to meet your requirements.

Get in touch

1 Executive Summary

  • 1.1 Market overview
    • Executive Summary - Chart on Market Overview
    • Executive Summary - Data Table on Market Overview
    • Executive Summary - Chart on Global Market Characteristics
    • Executive Summary - Chart on Market by Geography
    • Executive Summary - Chart on Market Segmentation by Distribution Channel
    • Executive Summary - Chart on Market Segmentation by Type
    • Executive Summary - Chart on Incremental Growth
    • Executive Summary - Data Table on Incremental Growth
    • Executive Summary - Chart on Company Market Positioning

2 Market Landscape

  • 2.1 Market ecosystem
    • Parent Market
    • Data Table on - Parent Market
  • 2.2 Market characteristics
    • Market characteristics analysis
  • 2.3 Value chain analysis
    • Value Chain Analysis

3 Market Sizing

  • 3.1 Market definition
    • Offerings of companies included in the market definition
  • 3.2 Market segment analysis
    • Market segments
  • 3.3 Market size 2023
    • 3.4 Market outlook: Forecast for 2023-2028
      • Chart on Global - Market size and forecast 2023-2028 ($ million)
      • Data Table on Global - Market size and forecast 2023-2028 ($ million)
      • Chart on Global Market: Year-over-year growth 2023-2028 (%)
      • Data Table on Global Market: Year-over-year growth 2023-2028 (%)

    4 Historic Market Size

    • 4.1 Global Pet Treats Market 2018 - 2022
      • Historic Market Size - Data Table on Global Pet Treats Market 2018 - 2022 ($ million)
    • 4.2 Distribution Channel segment analysis 2018 - 2022
      • Historic Market Size - Distribution Channel Segment 2018 - 2022 ($ million)
    • 4.3 Type segment analysis 2018 - 2022
      • Historic Market Size - Type Segment 2018 - 2022 ($ million)
    • 4.4 Geography segment analysis 2018 - 2022
      • Historic Market Size - Geography Segment 2018 - 2022 ($ million)
    • 4.5 Country segment analysis 2018 - 2022
      • Historic Market Size - Country Segment 2018 - 2022 ($ million)

    5 Five Forces Analysis

    • 5.1 Five forces summary
      • Five forces analysis - Comparison between 2023 and 2028
    • 5.2 Bargaining power of buyers
      • Bargaining power of buyers - Impact of key factors 2023 and 2028
    • 5.3 Bargaining power of suppliers
      • Bargaining power of suppliers - Impact of key factors in 2023 and 2028
    • 5.4 Threat of new entrants
      • Threat of new entrants - Impact of key factors in 2023 and 2028
    • 5.5 Threat of substitutes
      • Threat of substitutes - Impact of key factors in 2023 and 2028
    • 5.6 Threat of rivalry
      • Threat of rivalry - Impact of key factors in 2023 and 2028
    • 5.7 Market condition
      • Chart on Market condition - Five forces 2023 and 2028

    6 Market Segmentation by Distribution Channel

    • 6.1 Market segments
      • Chart on Distribution Channel - Market share (2023-2028) (%)
      • Data Table on Distribution Channel - Market share (2023-2028) (%)
    • 6.2 Comparison by Distribution Channel
      • Chart on Comparison by Distribution Channel
      • Data Table on Comparison by Distribution Channel
    • 6.3 Offline - Market size and forecast (2023-2028)
      • Chart on Offline - Market size and forecast (2023-2028) ($ million)
      • Data Table on Offline - Market size and forecast (2023-2028) ($ million)
      • Chart on Offline - Year-over-year growth (2023-2028) (%)
      • Data Table on Offline - Year-over-year growth (2023-2028) (%)
    • 6.4 Online - Market size and forecast (2023-2028)
      • Chart on Online - Market size and forecast (2023-2028) ($ million)
      • Data Table on Online - Market size and forecast (2023-2028) ($ million)
      • Chart on Online - Year-over-year growth (2023-2028) (%)
      • Data Table on Online - Year-over-year growth (2023-2028) (%)
    • 6.5 Market opportunity by Distribution Channel
      • Market opportunity by Distribution Channel ($ million)
      • Data Table on Market opportunity by Distribution Channel ($ million)

    7 Market Segmentation by Type

    • 7.1 Market segments
      • Chart on Type - Market share (2023-2028) (%)
      • Data Table on Type - Market share (2023-2028) (%)
    • 7.2 Comparison by Type
      • Chart on Comparison by Type
      • Data Table on Comparison by Type
    • 7.3 Dog - Market size and forecast (2023-2028)
      • Chart on Dog - Market size and forecast (2023-2028) ($ million)
      • Data Table on Dog - Market size and forecast (2023-2028) ($ million)
      • Chart on Dog - Year-over-year growth (2023-2028) (%)
      • Data Table on Dog - Year-over-year growth (2023-2028) (%)
    • 7.4 Cat - Market size and forecast (2023-2028)
      • Chart on Cat - Market size and forecast (2023-2028) ($ million)
      • Data Table on Cat - Market size and forecast (2023-2028) ($ million)
      • Chart on Cat - Year-over-year growth (2023-2028) (%)
      • Data Table on Cat - Year-over-year growth (2023-2028) (%)
    • 7.5 Others - Market size and forecast (2023-2028)
      • Chart on Others - Market size and forecast (2023-2028) ($ million)
      • Data Table on Others - Market size and forecast (2023-2028) ($ million)
      • Chart on Others - Year-over-year growth (2023-2028) (%)
      • Data Table on Others - Year-over-year growth (2023-2028) (%)
    • 7.6 Market opportunity by Type
      • Market opportunity by Type ($ million)
      • Data Table on Market opportunity by Type ($ million)

    8 Market Segmentation by Product Type

    • 8.1 Market segments
      • Chart on Product Type - Market share (2023-2028) (%)
      • Data Table on Product Type - Market share (2023-2028) (%)
    • 8.2 Comparison by Product Type
      • Chart on Comparison by Product Type
      • Data Table on Comparison by Product Type
    • 8.3 Chews - Market size and forecast (2023-2028)
      • Chart on Chews - Market size and forecast (2023-2028) ($ million)
      • Data Table on Chews - Market size and forecast (2023-2028) ($ million)
      • Chart on Chews - Year-over-year growth (2023-2028) (%)
      • Data Table on Chews - Year-over-year growth (2023-2028) (%)
    • 8.4 Jerky - Market size and forecast (2023-2028)
      • Chart on Jerky - Market size and forecast (2023-2028) ($ million)
      • Data Table on Jerky - Market size and forecast (2023-2028) ($ million)
      • Chart on Jerky - Year-over-year growth (2023-2028) (%)
      • Data Table on Jerky - Year-over-year growth (2023-2028) (%)
    • 8.5 Biscuits - Market size and forecast (2023-2028)
      • Chart on Biscuits - Market size and forecast (2023-2028) ($ million)
      • Data Table on Biscuits - Market size and forecast (2023-2028) ($ million)
      • Chart on Biscuits - Year-over-year growth (2023-2028) (%)
      • Data Table on Biscuits - Year-over-year growth (2023-2028) (%)
    • 8.6 Others - Market size and forecast (2023-2028)
      • Chart on Others - Market size and forecast (2023-2028) ($ million)
      • Data Table on Others - Market size and forecast (2023-2028) ($ million)
      • Chart on Others - Year-over-year growth (2023-2028) (%)
      • Data Table on Others - Year-over-year growth (2023-2028) (%)
    • 8.7 Market opportunity by Product Type
      • Market opportunity by Product Type ($ million)
      • Data Table on Market opportunity by Product Type ($ million)

    9 Market Segmentation by Form

    • 9.1 Market segments
      • Chart on Form - Market share (2023-2028) (%)
      • Data Table on Form - Market share (2023-2028) (%)
    • 9.2 Comparison by Form
      • Chart on Comparison by Form
      • Data Table on Comparison by Form
    • 9.3 Dental Treats - Market size and forecast (2023-2028)
      • Chart on Dental Treats - Market size and forecast (2023-2028) ($ million)
      • Data Table on Dental Treats - Market size and forecast (2023-2028) ($ million)
      • Chart on Dental Treats - Year-over-year growth (2023-2028) (%)
      • Data Table on Dental Treats - Year-over-year growth (2023-2028) (%)
    • 9.4 Natural Treats - Market size and forecast (2023-2028)
      • Chart on Natural Treats - Market size and forecast (2023-2028) ($ million)
      • Data Table on Natural Treats - Market size and forecast (2023-2028) ($ million)
      • Chart on Natural Treats - Year-over-year growth (2023-2028) (%)
      • Data Table on Natural Treats - Year-over-year growth (2023-2028) (%)
    • 9.5 Functional Treats - Market size and forecast (2023-2028)
      • Chart on Functional Treats - Market size and forecast (2023-2028) ($ million)
      • Data Table on Functional Treats - Market size and forecast (2023-2028) ($ million)
      • Chart on Functional Treats - Year-over-year growth (2023-2028) (%)
      • Data Table on Functional Treats - Year-over-year growth (2023-2028) (%)
    • 9.6 Others - Market size and forecast (2023-2028)
      • Chart on Others - Market size and forecast (2023-2028) ($ million)
      • Data Table on Others - Market size and forecast (2023-2028) ($ million)
      • Chart on Others - Year-over-year growth (2023-2028) (%)
      • Data Table on Others - Year-over-year growth (2023-2028) (%)
    • 9.7 Market opportunity by Form
      • Market opportunity by Form ($ million)
      • Data Table on Market opportunity by Form ($ million)

    10 Customer Landscape

    • 10.1 Customer landscape overview
      • Analysis of price sensitivity, lifecycle, customer purchase basket, adoption rates, and purchase criteria

    11 Geographic Landscape

    • 11.1 Geographic segmentation
      • Chart on Market share by geography 2023-2028 (%)
      • Data Table on Market share by geography 2023-2028 (%)
    • 11.2 Geographic comparison
      • Chart on Geographic comparison
      • Data Table on Geographic comparison
    • 11.3 North America - Market size and forecast 2023-2028
      • Chart on North America - Market size and forecast 2023-2028 ($ million)
      • Data Table on North America - Market size and forecast 2023-2028 ($ million)
      • Chart on North America - Year-over-year growth 2023-2028 (%)
      • Data Table on North America - Year-over-year growth 2023-2028 (%)
    • 11.4 Europe - Market size and forecast 2023-2028
      • Chart on Europe - Market size and forecast 2023-2028 ($ million)
      • Data Table on Europe - Market size and forecast 2023-2028 ($ million)
      • Chart on Europe - Year-over-year growth 2023-2028 (%)
      • Data Table on Europe - Year-over-year growth 2023-2028 (%)
    • 11.5 APAC - Market size and forecast 2023-2028
      • Chart on APAC - Market size and forecast 2023-2028 ($ million)
      • Data Table on APAC - Market size and forecast 2023-2028 ($ million)
      • Chart on APAC - Year-over-year growth 2023-2028 (%)
      • Data Table on APAC - Year-over-year growth 2023-2028 (%)
    • 11.6 South America - Market size and forecast 2023-2028
      • Chart on South America - Market size and forecast 2023-2028 ($ million)
      • Data Table on South America - Market size and forecast 2023-2028 ($ million)
      • Chart on South America - Year-over-year growth 2023-2028 (%)
      • Data Table on South America - Year-over-year growth 2023-2028 (%)
    • 11.7 Middle East and Africa - Market size and forecast 2023-2028
      • Chart on Middle East and Africa - Market size and forecast 2023-2028 ($ million)
      • Data Table on Middle East and Africa - Market size and forecast 2023-2028 ($ million)
      • Chart on Middle East and Africa - Year-over-year growth 2023-2028 (%)
      • Data Table on Middle East and Africa - Year-over-year growth 2023-2028 (%)
    • 11.8 US - Market size and forecast 2023-2028
      • Chart on US - Market size and forecast 2023-2028 ($ million)
      • Data Table on US - Market size and forecast 2023-2028 ($ million)
      • Chart on US - Year-over-year growth 2023-2028 (%)
      • Data Table on US - Year-over-year growth 2023-2028 (%)
    • 11.9 China - Market size and forecast 2023-2028
      • Chart on China - Market size and forecast 2023-2028 ($ million)
      • Data Table on China - Market size and forecast 2023-2028 ($ million)
      • Chart on China - Year-over-year growth 2023-2028 (%)
      • Data Table on China - Year-over-year growth 2023-2028 (%)
    • 11.10 Germany - Market size and forecast 2023-2028
      • Chart on Germany - Market size and forecast 2023-2028 ($ million)
      • Data Table on Germany - Market size and forecast 2023-2028 ($ million)
      • Chart on Germany - Year-over-year growth 2023-2028 (%)
      • Data Table on Germany - Year-over-year growth 2023-2028 (%)
    • 11.11 France - Market size and forecast 2023-2028
      • Chart on France - Market size and forecast 2023-2028 ($ million)
      • Data Table on France - Market size and forecast 2023-2028 ($ million)
      • Chart on France - Year-over-year growth 2023-2028 (%)
      • Data Table on France - Year-over-year growth 2023-2028 (%)
    • 11.12 UK - Market size and forecast 2023-2028
      • Chart on UK - Market size and forecast 2023-2028 ($ million)
      • Data Table on UK - Market size and forecast 2023-2028 ($ million)
      • Chart on UK - Year-over-year growth 2023-2028 (%)
      • Data Table on UK - Year-over-year growth 2023-2028 (%)
    • 11.13 Market opportunity by geography
      • Market opportunity by geography ($ million)
      • Data Tables on Market opportunity by geography ($ million)
    • 11.14 Malaysia - Market size and forecast (2023-2028)
      • Chart on Malaysia - Market size and forecast (2023-2028) ($ million)
      • Data Table on Malaysia - Market size and forecast (2023-2028) ($ million)
      • Chart on Malaysia - Year-over-year growth (2023-2028) (%)
      • Data Table on Malaysia - Year-over-year growth (2023-2028) (%)
    • 11.15 Indonesia - Market size and forecast (2023-2028)
      • Chart on Indonesia - Market size and forecast (2023-2028) ($ million)
      • Data Table on Indonesia - Market size and forecast (2023-2028) ($ million)
      • Chart on Indonesia - Year-over-year growth (2023-2028) (%)
      • Data Table on Indonesia - Year-over-year growth (2023-2028) (%)
    • 11.16 South Korea - Market size and forecast (2023-2028)
      • Chart on South Korea - Market size and forecast (2023-2028) ($ million)
      • Data Table on South Korea - Market size and forecast (2023-2028) ($ million)
      • Chart on South Korea - Year-over-year growth (2023-2028) (%)
      • Data Table on South Korea - Year-over-year growth (2023-2028) (%)
    • 11.17 Canada - Market size and forecast (2023-2028)
      • Chart on Canada - Market size and forecast (2023-2028) ($ million)
      • Data Table on Canada - Market size and forecast (2023-2028) ($ million)
      • Chart on Canada - Year-over-year growth (2023-2028) (%)
      • Data Table on Canada - Year-over-year growth (2023-2028) (%)
    • 11.18 Brazil - Market size and forecast (2023-2028)
      • Chart on Brazil - Market size and forecast (2023-2028) ($ million)
      • Data Table on Brazil - Market size and forecast (2023-2028) ($ million)
      • Chart on Brazil - Year-over-year growth (2023-2028) (%)
      • Data Table on Brazil - Year-over-year growth (2023-2028) (%)
    • 11.19 Thailand - Market size and forecast (2023-2028)
      • Chart on Thailand - Market size and forecast (2023-2028) ($ million)
      • Data Table on Thailand - Market size and forecast (2023-2028) ($ million)
      • Chart on Thailand - Year-over-year growth (2023-2028) (%)
      • Data Table on Thailand - Year-over-year growth (2023-2028) (%)
    • 11.20 UAE - Market size and forecast (2023-2028)
      • Chart on UAE - Market size and forecast (2023-2028) ($ million)
      • Data Table on UAE - Market size and forecast (2023-2028) ($ million)
      • Chart on UAE - Year-over-year growth (2023-2028) (%)
      • Data Table on UAE - Year-over-year growth (2023-2028) (%)
    • 11.21 Mexico - Market size and forecast (2023-2028)
      • Chart on Mexico - Market size and forecast (2023-2028) ($ million)
      • Data Table on Mexico - Market size and forecast (2023-2028) ($ million)
      • Chart on Mexico - Year-over-year growth (2023-2028) (%)
      • Data Table on Mexico - Year-over-year growth (2023-2028) (%)
    • 11.22 Japan - Market size and forecast (2023-2028)
      • Chart on Japan - Market size and forecast (2023-2028) ($ million)
      • Data Table on Japan - Market size and forecast (2023-2028) ($ million)
      • Chart on Japan - Year-over-year growth (2023-2028) (%)
      • Data Table on Japan - Year-over-year growth (2023-2028) (%)
    • 11.23 India - Market size and forecast (2023-2028)
      • Chart on India - Market size and forecast (2023-2028) ($ million)
      • Data Table on India - Market size and forecast (2023-2028) ($ million)
      • Chart on India - Year-over-year growth (2023-2028) (%)
      • Data Table on India - Year-over-year growth (2023-2028) (%)
    • 11.24 Rest of World (ROW) - Market size and forecast (2023-2028)
      • Chart on Rest of World (ROW) - Market size and forecast (2023-2028) ($ million)
      • Data Table on Rest of World (ROW) - Market size and forecast (2023-2028) ($ million)
      • Chart on Rest of World (ROW) - Year-over-year growth (2023-2028) (%)
      • Data Table on Rest of World (ROW) - Year-over-year growth (2023-2028) (%)

    12 Drivers, Challenges, and Opportunity/Restraints

    • 12.1 Market drivers
      • 12.2 Market challenges
        • 12.3 Impact of drivers and challenges
          • Impact of drivers and challenges in 2023 and 2028
        • 12.4 Market opportunities/restraints

          13 Competitive Landscape

          • 13.1 Overview
            • 13.2 Competitive Landscape
              • Overview on criticality of inputs and factors of differentiation
            • 13.3 Landscape disruption
              • Overview on factors of disruption
            • 13.4 Industry risks
              • Impact of key risks on business

            14 Competitive Analysis

            • 14.1 Companies profiled
              • Companies covered
            • 14.2 Market positioning of companies
              • Matrix on companies position and classification
            • 14.3 Addiction Pet Foods
              • Addiction Pet Foods - Overview
              • Addiction Pet Foods - Product / Service
              • Addiction Pet Foods - Key offerings
            • 14.4 Arden Grange
              • Arden Grange - Overview
              • Arden Grange - Product / Service
              • Arden Grange - Key offerings
            • 14.5 Assisi Pet Care Ltd.
              • Assisi Pet Care Ltd. - Overview
              • Assisi Pet Care Ltd. - Product / Service
              • Assisi Pet Care Ltd. - Key offerings
            • 14.6 Colgate Palmolive Co.
              • Colgate Palmolive Co. - Overview
              • Colgate Palmolive Co. - Business segments
              • Colgate Palmolive Co. - Key news
              • Colgate Palmolive Co. - Key offerings
              • Colgate Palmolive Co. - Segment focus
            • 14.7 General Mills Inc.
              • General Mills Inc. - Overview
              • General Mills Inc. - Business segments
              • General Mills Inc. - Key news
              • General Mills Inc. - Key offerings
              • General Mills Inc. - Segment focus
            • 14.8 heristo aktiengesellschaft
              • heristo aktiengesellschaft - Overview
              • heristo aktiengesellschaft - Product / Service
              • heristo aktiengesellschaft - Key offerings
            • 14.9 Mars Inc.
              • Mars Inc. - Overview
              • Mars Inc. - Product / Service
              • Mars Inc. - Key news
              • Mars Inc. - Key offerings
            • 14.10 Nestle SA
              • Nestle SA - Overview
              • Nestle SA - Business segments
              • Nestle SA - Key news
              • Nestle SA - Key offerings
              • Nestle SA - Segment focus
            • 14.11 Plato Pet Treats
              • Plato Pet Treats - Overview
              • Plato Pet Treats - Product / Service
              • Plato Pet Treats - Key offerings
            • 14.12 Primal Pet Foods Inc.
              • Primal Pet Foods Inc. - Overview
              • Primal Pet Foods Inc. - Product / Service
              • Primal Pet Foods Inc. - Key offerings
            • 14.13 Schell and Kampeter Inc.
              • Schell and Kampeter Inc. - Overview
              • Schell and Kampeter Inc. - Product / Service
              • Schell and Kampeter Inc. - Key offerings
            • 14.14 Spectrum Brands Holdings Inc.
              • Spectrum Brands Holdings Inc. - Overview
              • Spectrum Brands Holdings Inc. - Product / Service
              • Spectrum Brands Holdings Inc. - Key offerings
            • 14.15 The J.M Smucker Co.
              • The J.M Smucker Co. - Overview
              • The J.M Smucker Co. - Business segments
              • The J.M Smucker Co. - Key news
              • The J.M Smucker Co. - Key offerings
              • The J.M Smucker Co. - Segment focus
            • 14.16 Unicharm Corp.
              • Unicharm Corp. - Overview
              • Unicharm Corp. - Business segments
              • Unicharm Corp. - Key news
              • Unicharm Corp. - Key offerings
              • Unicharm Corp. - Segment focus
            • 14.17 Wellness Pet Co. Inc.
              • Wellness Pet Co. Inc. - Overview
              • Wellness Pet Co. Inc. - Product / Service
              • Wellness Pet Co. Inc. - Key offerings

            15 Appendix

            • 15.1 Scope of the report
              • 15.2 Inclusions and exclusions checklist
                • Inclusions checklist
                • Exclusions checklist
              • 15.3 Currency conversion rates for US$
                • Currency conversion rates for US$
              • 15.4 Research methodology
                • Research methodology
              • 15.5 Data procurement
                • Information sources
              • 15.6 Data validation
                • Data validation
              • 15.7 Validation techniques employed for market sizing
                • Validation techniques employed for market sizing
              • 15.8 Data synthesis
                • Data synthesis
              • 15.9 360 degree market analysis
                • 360 degree market analysis
              • 15.10 List of abbreviations
                • List of abbreviations

              Research Methodology

              Technavio presents a detailed picture of the market by way of study, synthesis, and summation of data from multiple sources. The analysts have presented the various facets of the market with a particular focus on identifying the key industry influencers. The data thus presented is comprehensive, reliable, and the result of extensive research, both primary and secondary.

              INFORMATION SOURCES

              Primary sources

              • Manufacturers and suppliers
              • Channel partners
              • Industry experts
              • Strategic decision makers

              Secondary sources

              • Industry journals and periodicals
              • Government data
              • Financial reports of key industry players
              • Historical data
              • Press releases

              DATA ANALYSIS

              Data Synthesis

              • Collation of data
              • Estimation of key figures
              • Analysis of derived insights

              Data Validation

              • Triangulation with data models
              • Reference against proprietary databases
              • Corroboration with industry experts

              REPORT WRITING

              Qualitative

              • Market drivers
              • Market challenges
              • Market trends
              • Five forces analysis

              Quantitative

              • Market size and forecast
              • Market segmentation
              • Geographical insights
              • Competitive landscape

              Interested in this report?

              Get your sample now to see our research methodology and insights!

              Download Now

              Frequently Asked Questions

              Pet Treats market growth will increase by $ 9103.5 mn during 2024-2028.

              The Pet Treats market is expected to grow at a CAGR of 6.6% during 2024-2028.

              Pet Treats market is segmented by Distribution Channel( Offline, Online) Type( Dog, Cat, Others)

              Addiction Pet Foods, Arden Grange, Assisi Pet Care Ltd., Canine India, Colgate Palmolive Co., General Mills Inc., heristo aktiengesellschaft, Mars Inc., Nestle SA, Nulo Pet Food, Plato Pet Treats, PPN Ltd. Partnership, Primal Pet Foods Inc., Schell and Kampeter Inc., Spectrum Brands Holdings Inc., The J.M Smucker Co., Unicharm Corp., Vegeco Ltd, Wellness Pet Co. Inc., Wiggles are a few of the key vendors in the Pet Treats market.

              North America will register the highest growth rate of 39% among the other regions. Therefore, the Pet Treats market in North America is expected to garner significant business opportunities for the vendors during the forecast period.

              US, Malaysia, Indonesia, Germany, UK, South Korea, France, Canada, Brazil, Thailand, UAE, Mexico, China, Japan, India

              • Growing demand for organic pet foodsOrganic pet food is a natural food for pets is the driving factor this market.
              • which must meet the USDA regulations described on the organic label. In addition to this is the driving factor this market.
              • to be certified as organic is the driving factor this market.
              • pet food should contain plant ingredients (grown free from pesticides is the driving factor this market.
              • artificial fertilizers is the driving factor this market.
              • genetic modification is the driving factor this market.
              • irradiation is the driving factor this market.
              • and sewage sludge) and animal ingredients (from animals raised on organic feed is the driving factor this market.
              • given access to the outdoors is the driving factor this market.
              • and not treated with antibiotics or hormones). Consumers are now more aware of the ingredients in their pet food than ever before. With organic and natural food becoming the popular choice when it comes to human food is the driving factor this market.
              • pet owners want the same for their pets. The global pet treats market is growing at a high rate owing to the increasing focus of pet owners on pet health and wellness is the driving factor this market.
              • along with the emerging pet humanization trend. For many pet owners is the driving factor this market.
              • their pets are part of the family. They refer to them as their fur babies or children is the driving factor this market.
              • thus making the humanization of pets one of the key trends driving the pet food industry. Labeling and marketing of pet food products have also become humanized is the driving factor this market.
              • showing photos of mouth-watering steaks is the driving factor this market.
              • carrots is the driving factor this market.
              • broccoli is the driving factor this market.
              • and pink salmon bursting in color to appeal to owners. With the rising number of health issues among pets is the driving factor this market.
              • many pet owners have started opting for organic pet food over conventional ones is the driving factor this market.
              • as organic pet food has health benefits for animals is the driving factor this market.
              • such as the reduction in skin allergies and ailments is the driving factor this market.
              • fewer digestive disorders is the driving factor this market.
              • better overall health is the driving factor this market.
              • and quality life. To cater to this demand is the driving factor this market.
              • currently is the driving factor this market.
              • many vendors operating in the global pet treats market have started launching and selling organic pet food varieties. Currently is the driving factor this market.
              • the adoption rate of small reptiles is less than that of small mammals; therefore is the driving factor this market.
              • not many vendors are coming up with organic food designed for small reptiles. However is the driving factor this market.
              • it is expected that with the increase in the adoption of small reptiles is the driving factor this market.
              • organic foods meant for this category will increase among pet owners in the coming years. Thus is the driving factor this market.
              • the growing demand for organic pet foods will propel the growth of the global pet treats market during the forecast period. is the driving factor this market.

              The Pet Treats market vendors should focus on grabbing business opportunities from the Offline segment as it accounted for the largest market share in the base year.
              RIA - Research AI Assistant
              Ask RIA