Pharmaceutical Cartridges Market Size 2026-2030
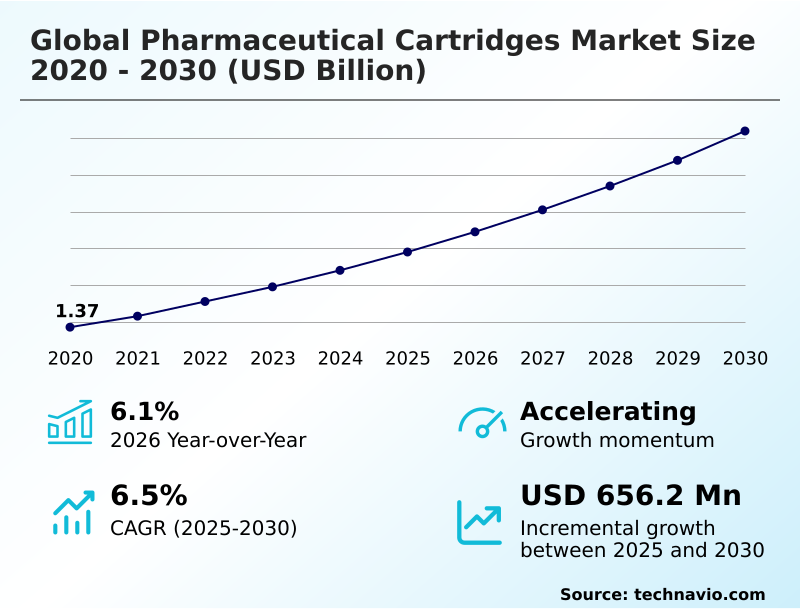
The pharmaceutical cartridges market size is valued to increase by USD 656.2 million, at a CAGR of 6.5% from 2025 to 2030. Increase in research and development spending in pharmaceutical industry will drive the pharmaceutical cartridges market.
Major Market Trends & Insights
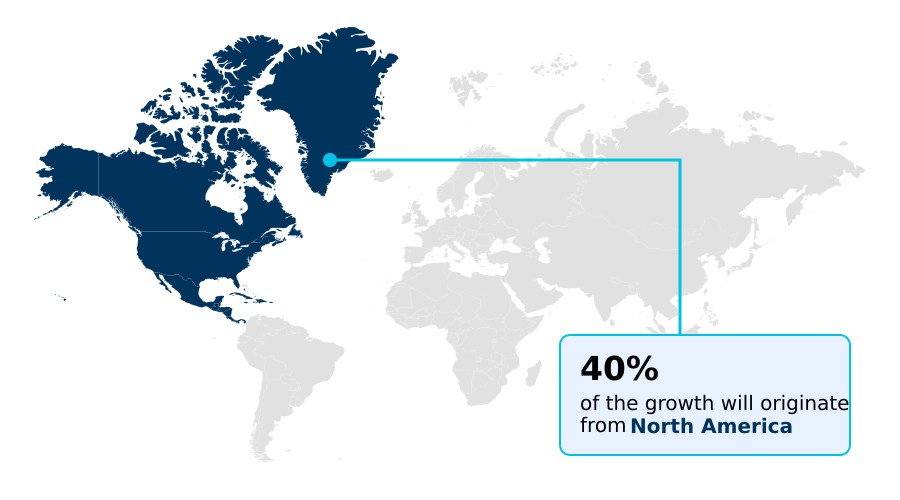
- North America dominated the market and accounted for a 40.4% growth during the forecast period.
- By Material - Glass segment was valued at USD 1.19 billion in 2024
- By Capacity - Below 5 ml segment accounted for the largest market revenue share in 2024
Market Size & Forecast
- Market Opportunities: USD 1.07 billion
- Market Future Opportunities: USD 656.2 million
- CAGR from 2025 to 2030 : 6.5%
Market Summary
- The pharmaceutical cartridges market is defined by its critical role in advanced drug delivery, particularly for chronic diseases managed through self-administration. These specialized containers, essential for pen injectors and auto-injectors, are central to the administration of insulin, biologics, and biosimilars.
- A key driver is the industry's shift toward patient-centric care, which demands convenient, safe, and accurate dosing systems that cartridges provide. This has intensified the focus on material science, with high-quality borosilicate glass and advanced polymers like cyclic olefin polymer (COP) being pivotal for ensuring drug stability and minimizing contamination risks.
- For instance, a biopharmaceutical company launching a new biologic therapy must choose a cartridge that prevents protein aggregation and meets stringent regulatory standards for extractables and leachables. This requires significant investment in container closure integrity testing and compatibility studies.
- Consequently, manufacturers are innovating with ready-to-use (RTU) formats and specialized coatings to streamline fill-finish operations and support the delivery of next-generation injectable therapies. The market's trajectory is thus shaped by the convergence of therapeutic innovation, regulatory demands, and the need for reliable, user-friendly drug delivery systems.
What will be the Size of the Pharmaceutical Cartridges Market during the forecast period?
Get Key Insights on Market Forecast (PDF) Get Free Sample
How is the Pharmaceutical Cartridges Market Segmented?
The pharmaceutical cartridges industry research report provides comprehensive data (region-wise segment analysis), with forecasts and estimates in "USD million" for the period 2026-2030, as well as historical data from 2020-2024 for the following segments.
- Material
- Glass
- Plastic
- Capacity
- Below 5 ml
- 5-50 ml
- 51-250 ml
- Above 250 ml
- Distribution channel
- Indirect sales
- Direct sales
- Geography
- North America
- US
- Canada
- Mexico
- Europe
- Germany
- UK
- France
- Asia
- Rest of World (ROW)
- North America
By Material Insights
The glass segment is estimated to witness significant growth during the forecast period.
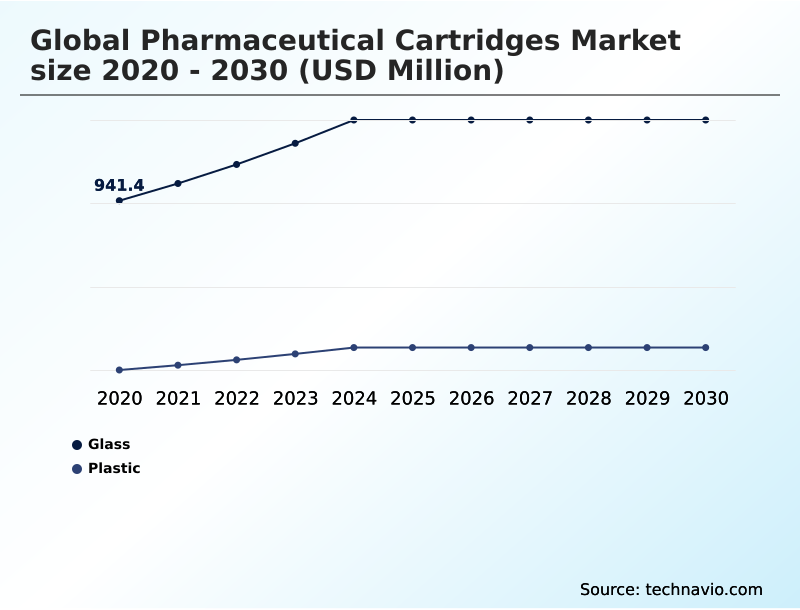
The glass segment dominates the market, with borosilicate glass cartridges remaining the industry standard for injectable drug containment due to superior barrier properties and an established regulatory profile.
This pharmaceutical glass packaging is vital for sensitive formulations where stability is paramount. The market is shifting toward primary packaging standardization, with ready-to-use (RTU) formats gaining traction to accelerate time-to-market.
Manufacturers are focusing on low-tungsten glass processing and advanced automated visual inspection, which improves error detection by up to 15%, to ensure dimensional integrity and enhance container closure integrity.
These innovations in parenteral drug packaging are crucial for glass delamination risk mitigation and meeting stringent ISO-compliant cartridge dimensions.
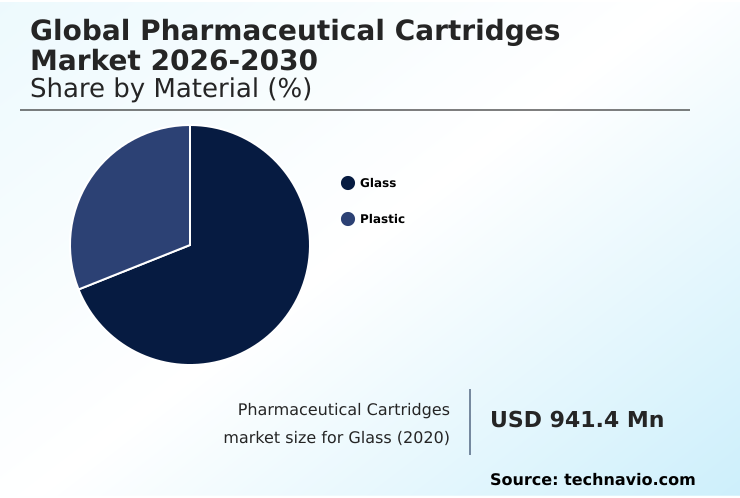
The Glass segment was valued at USD 1.19 billion in 2024 and showed a gradual increase during the forecast period.
Regional Analysis
North America is estimated to contribute 40.4% to the growth of the global market during the forecast period.Technavio’s analysts have elaborately explained the regional trends and drivers that shape the market during the forecast period.
See How Pharmaceutical Cartridges Market Demand is Rising in North America Get Free Sample
North America leads the market, accounting for over 40% of the incremental growth, driven by its advanced healthcare infrastructure and high adoption of self-administered therapies. The region's focus on biologics and complex cold-chain storage solutions fuels demand for high-quality cartridges.
Europe remains a manufacturing powerhouse, emphasizing sustainable production. Asia is the fastest-growing region, with countries like China and India expanding their production of dental anesthetic cartridges and components for vaccine delivery technology.
This expansion is supported by government initiatives to improve healthcare access, which has increased local demand for sterile injectable solutions by approximately 12%.
Investment in local manufacturing capabilities, including gamma irradiation sterilization and the production of elastomeric plunger seals, is reducing reliance on imports.
Market Dynamics
Our researchers analyzed the data with 2025 as the base year, along with the key drivers, trends, and challenges. A holistic analysis of drivers will help companies refine their marketing strategies to gain a competitive advantage.
- Strategic decision-making in the global pharmaceutical cartridges market 2026-2030 is increasingly focused on the trade-offs between established and emerging technologies. The debate over borosilicate glass vs polymer cartridges continues, with glass valued for its proven barrier properties and regulatory acceptance, while polymers offer superior break resistance and design flexibility, crucial for packaging for high-viscosity injectables.
- The impact of RTU on fill-finish operations is a critical consideration; adopting ready-to-use cartridges can reduce in-house processing steps by over 50%, directly improving operational efficiency and accelerating time-to-market. For therapies like GLP-1 drugs, cartridge technology for GLP-1 drugs is non-negotiable, demanding high precision and compatibility with pen devices.
- The role of cartridges in home healthcare is expanding, driving innovation in dual-chamber cartridges for lyophilized biologics that simplify reconstitution for patients. Addressing challenges in large-volume cartridge delivery and ensuring container closure integrity for biologics are top priorities. Advancements in cartridge inspection technology and developing effective sterilization methods for pharmaceutical cartridges are key to meeting regulatory compliance for cartridge materials.
- Furthermore, improving dose accuracy with cartridges while preventing breakage in glass cartridges remains a central focus for manufacturers aiming to enhance sustainability in pharmaceutical cartridge manufacturing.
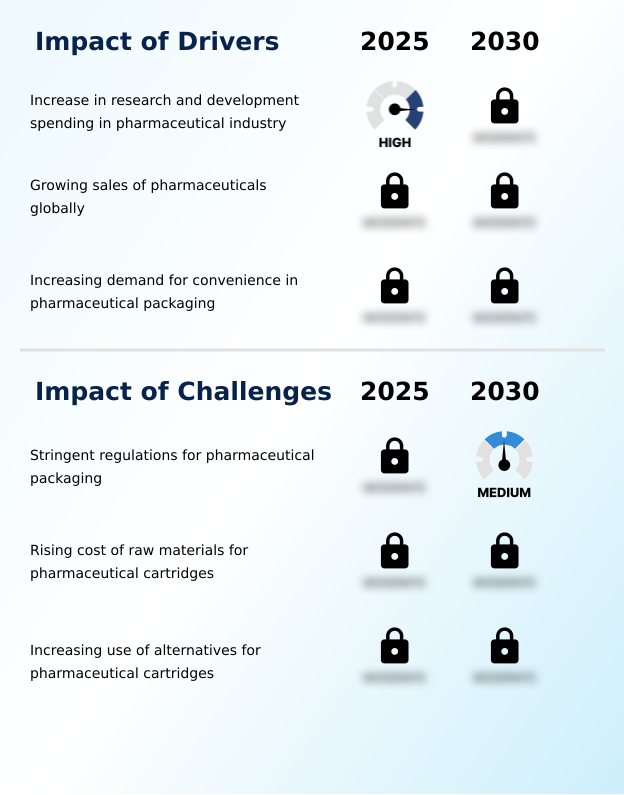
What are the key market drivers leading to the rise in the adoption of Pharmaceutical Cartridges Industry?
- Increased research and development spending within the pharmaceutical industry serves as a key driver for market growth.
- Rising pharmaceutical sales and R&D spending are major market drivers. The global expansion of insulin delivery systems and the surge in demand for GLP-1 receptor agonist packaging require high-quality sterile cartridge systems that ensure biologic drug stability.
- Pharmaceutical firms and their contract development and manufacturing (CDMO) partners are investing in advanced aseptic filling lines to improve fill-finish manufacturing operations, with some achieving a 10% increase in throughput.
- This focus on efficiency and pen injector compatibility strengthens supply chain resilience in pharma.
- Moreover, the need for effective high-viscosity formulation delivery in next-generation therapies directly stimulates demand for specialized cartridge solutions, which can reduce drug wastage by up to 5%.
What are the market trends shaping the Pharmaceutical Cartridges Industry?
- A significant market trend is the rising demand for large-volume polymer cartridges. This shift is driven by the need for advanced delivery systems for biologics and self-administered therapies.
- A key trend is the growing adoption of large-volume wearable injectors and on-body delivery systems, which necessitates parenteral packaging innovation in self-administration device components. This shift is driving demand for advanced medical-grade polymer containers, with some manufacturers reporting a 20% increase in cyclic olefin polymer (COP) adoption for drug-device combination products. These materials offer superior break resistance for high-viscosity drugs.
- Furthermore, innovations in dual-chamber cartridges are critical, enabling the lyophilized drug reconstitution of unstable biologics at the point of care. This drug delivery system integration enhances patient convenience and reduces preparation errors by over 25%, reshaping the delivery of chronic care therapies.
What challenges does the Pharmaceutical Cartridges Industry face during its growth?
- Stringent regulations governing pharmaceutical packaging present a significant challenge to industry growth and market scalability.
- The market faces challenges from stringent pharmaceutical packaging regulations, which mandate extensive extractables and leachables testing and add significant compliance costs, with some firms reporting a 15% increase in validation timelines. Rising raw material costs further squeeze margins.
- Additionally, the growing preference for alternative formats, such as integrated prefillable syringe systems and devices requiring complex auto-injector components, threatens demand for standalone cartridges. This requires manufacturers to invest in new dimensional tolerance control.
- Meeting requirements for tamper-evident packaging features for high-potency API containment adds another layer of complexity to aseptic processing solutions and the development of solutions like a silicone-free cartridge to achieve better protein adsorption reduction.
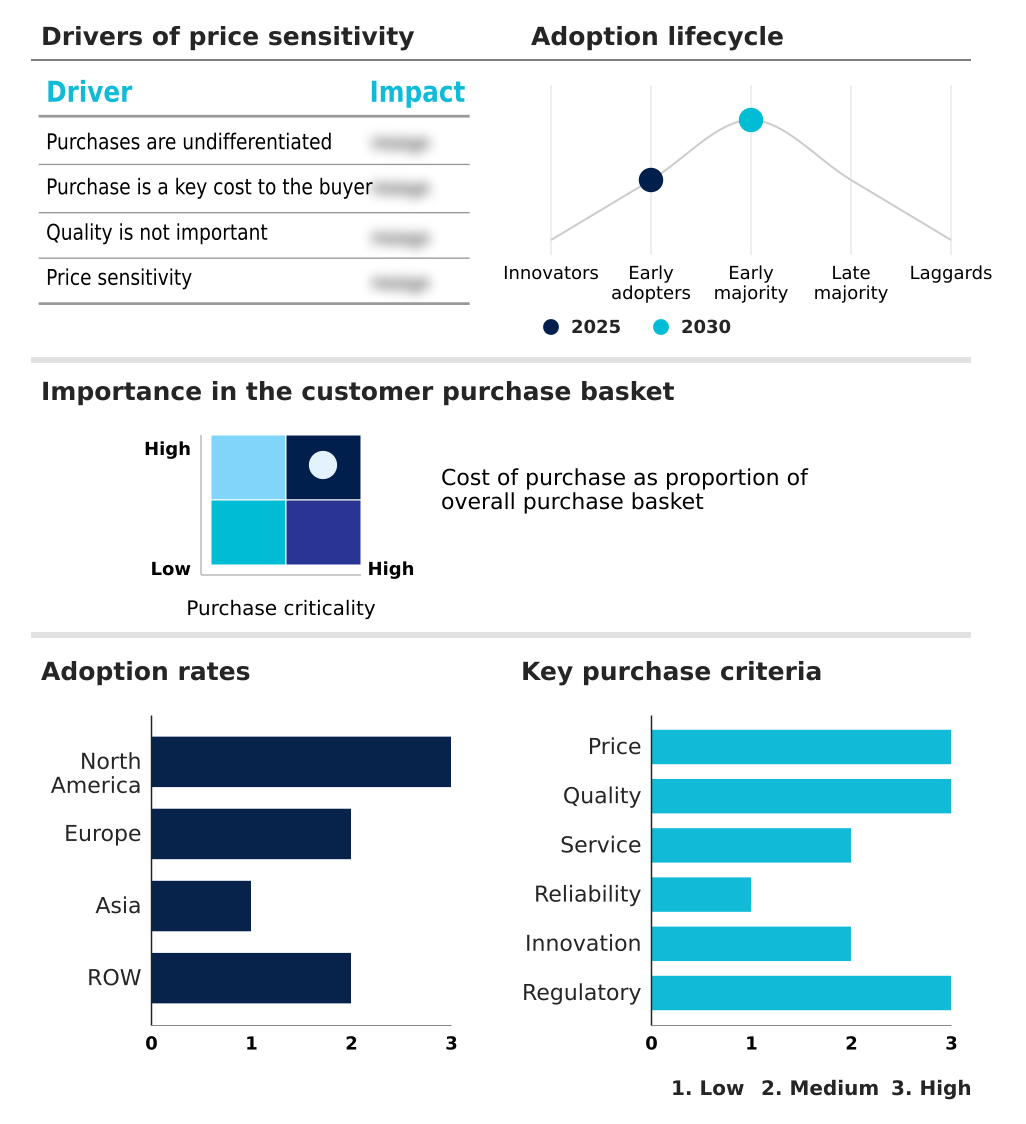
Exclusive Technavio Analysis on Customer Landscape
The pharmaceutical cartridges market forecasting report includes the adoption lifecycle of the market, covering from the innovator’s stage to the laggard’s stage. It focuses on adoption rates in different regions based on penetration. Furthermore, the pharmaceutical cartridges market report also includes key purchase criteria and drivers of price sensitivity to help companies evaluate and develop their market growth analysis strategies.
Customer Landscape of Pharmaceutical Cartridges Industry
Competitive Landscape
Companies are implementing various strategies, such as strategic alliances, pharmaceutical cartridges market forecast, partnerships, mergers and acquisitions, geographical expansion, and product/service launches, to enhance their presence in the industry.
Ambica Pharma Machines Pvt. - Delivers integrated biopharma solutions, specializing in precision glass primary packaging and drug containment systems for advanced injectable therapies.
The industry research and growth report includes detailed analyses of the competitive landscape of the market and information about key companies, including:
- Ambica Pharma Machines Pvt.
- AptarGroup Inc.
- Baxter International Inc.
- Becton Dickinson and Co.
- Corden Pharma Intl. GmbH
- Datwyler Holding Inc.
- Gerresheimer AG
- Groninger and Co. Gmbh
- Haselmeier GmbH
- Maquinaria Industrial Dara SL
- Merck KGaA
- Nipro Corp.
- Owen Mumford Ltd.
- SCHOTT AG
- SGD Pharma
- Shandong Pharma Glass Co. Ltd.
- Stevanato Group S.p.A
- Transcoject GmbH
- West Pharma Services Inc.
Qualitative and quantitative analysis of companies has been conducted to help clients understand the wider business environment as well as the strengths and weaknesses of key industry players. Data is qualitatively analyzed to categorize companies as pure play, category-focused, industry-focused, and diversified; it is quantitatively analyzed to categorize companies as dominant, leading, strong, tentative, and weak.
Recent Development and News in Pharmaceutical cartridges market
- In September, 2024, Schott Pharma, Gerresheimer, and Stevanato Group announced the formation of the Alliance for RTU to accelerate market adoption of ready-to-use vials and cartridges.
- In October, 2024, Gerresheimer AG showcased its Gx Elite cartridges at CPHI Milan, designed for high-quality protection of sensitive injectable drugs.
- In March, 2025, Pfizer Inc. and Schreiner MediPharm entered a strategic collaboration to develop a new smart label for cartridge-based delivery systems to enhance patient adherence tracking.
- In May, 2025, Schott Pharma expanded its ready-to-use portfolio by launching a new 1.5 ml sterile cartridge within its cartriQ product line for modern insulin and GLP-1 therapies.
Dive into Technavio’s robust research methodology, blending expert interviews, extensive data synthesis, and validated models for unparalleled Pharmaceutical Cartridges Market insights. See full methodology.
| Market Scope | |
|---|---|
| Page number | 288 |
| Base year | 2025 |
| Historic period | 2020-2024 |
| Forecast period | 2026-2030 |
| Growth momentum & CAGR | Accelerate at a CAGR of 6.5% |
| Market growth 2026-2030 | USD 656.2 million |
| Market structure | Fragmented |
| YoY growth 2025-2026(%) | 6.1% |
| Key countries | US, Canada, Mexico, Germany, UK, France, Italy, Spain, The Netherlands, China, Japan, India, South Korea, Thailand, Indonesia, Brazil, Saudi Arabia, Argentina, UAE, South Africa, Colombia, Turkey and Israel |
| Competitive landscape | Leading Companies, Market Positioning of Companies, Competitive Strategies, and Industry Risks |
Research Analyst Overview
- The pharmaceutical cartridges market is undergoing a strategic pivot toward high-value containment solutions, driven by the proliferation of biologic therapies. Boardroom decisions are centered on mitigating supply chain risks and investing in technologies that ensure biologic drug stability and performance.
- The adoption of ready-to-use (RTU) formats is a key strategy, as it allows pharmaceutical companies to outsource complex preparation steps, with some achieving a 30% reduction in processing time and accelerating speed-to-market. This shift necessitates substantial capital investment in advanced aseptic filling lines and automated visual inspection systems to guarantee dimensional tolerance control.
- Ensuring robust container closure integrity has become paramount, prompting deeper collaboration on the development of advanced elastomeric plunger seals and low-tungsten glass processing. The focus on parenteral drug packaging extends to specialized solutions like dual-chamber cartridges for lyophilized drug reconstitution and robust cartridges compatible with large-volume wearable injectors, reflecting a market that prioritizes precision, safety, and operational efficiency.
What are the Key Data Covered in this Pharmaceutical Cartridges Market Research and Growth Report?
-
What is the expected growth of the Pharmaceutical Cartridges Market between 2026 and 2030?
-
USD 656.2 million, at a CAGR of 6.5%
-
-
What segmentation does the market report cover?
-
The report is segmented by Material (Glass, and Plastic), Capacity (Below 5 ml, 5-50 ml, 51-250 ml, and Above 250 ml), Distribution Channel (Indirect sales, and Direct sales) and Geography (North America, Europe, Asia, Rest of World (ROW))
-
-
Which regions are analyzed in the report?
-
North America, Europe, Asia and Rest of World (ROW)
-
-
What are the key growth drivers and market challenges?
-
Increase in research and development spending in pharmaceutical industry, Stringent regulations for pharmaceutical packaging
-
-
Who are the major players in the Pharmaceutical Cartridges Market?
-
Ambica Pharma Machines Pvt., AptarGroup Inc., Baxter International Inc., Becton Dickinson and Co., Corden Pharma Intl. GmbH, Datwyler Holding Inc., Gerresheimer AG, Groninger and Co. Gmbh, Haselmeier GmbH, Maquinaria Industrial Dara SL, Merck KGaA, Nipro Corp., Owen Mumford Ltd., SCHOTT AG, SGD Pharma, Shandong Pharma Glass Co. Ltd., Stevanato Group S.p.A, Transcoject GmbH and West Pharma Services Inc.
-
Market Research Insights
- Market dynamics are shaped by a convergence of high-value applications and significant operational pressures. The increasing adoption of self-administration device components for chronic care has intensified the need for supply chain resilience in pharma, with a focus on sourcing high-quality sterile injectable solutions.
- This demand is met with considerable capital investment, as setting up advanced aseptic processing solutions can represent a 30% increase in annual budgets for manufacturers. Furthermore, while quality is a non-negotiable factor for buyers, ranking over 80% higher in importance than cost, intense competition and volume-based procurement exert downward price pressure.
- This forces suppliers to optimize fill-finish manufacturing operations and innovate in areas like parenteral packaging to maintain margins without compromising on stringent pharmaceutical packaging regulations.
We can help! Our analysts can customize this pharmaceutical cartridges market research report to meet your requirements.
 RIA -
RIA - 
