Phenol Market Analysis, Size, and Forecast 2026-2030: APAC (China, India, and Japan), Europe (Germany, France, and UK), North America (US, Canada, and Mexico), South America (Brazil, Argentina, and Colombia), Middle East and Africa (Saudi Arabia, Turkey, and UAE), and Rest of World (ROW)

Phenol Market Analysis, Size, and Forecast 2026-2030:
APAC (China, India, and Japan), Europe (Germany, France, and UK), North America (US, Canada, and Mexico), South America (Brazil, Argentina, and Colombia), Middle East and Africa (Saudi Arabia, Turkey, and UAE), and Rest of World (ROW)

Published: Mar 2026 314 Pages SKU: IRTNTR41158

Market Overview at a Glance

$4.71 B
Market Opportunity
3.4%
CAGR 2025 - 2030
62.9%
APAC Growth
$11.90 B
BPA segment 2024

Phenol Market Size 2026-2030

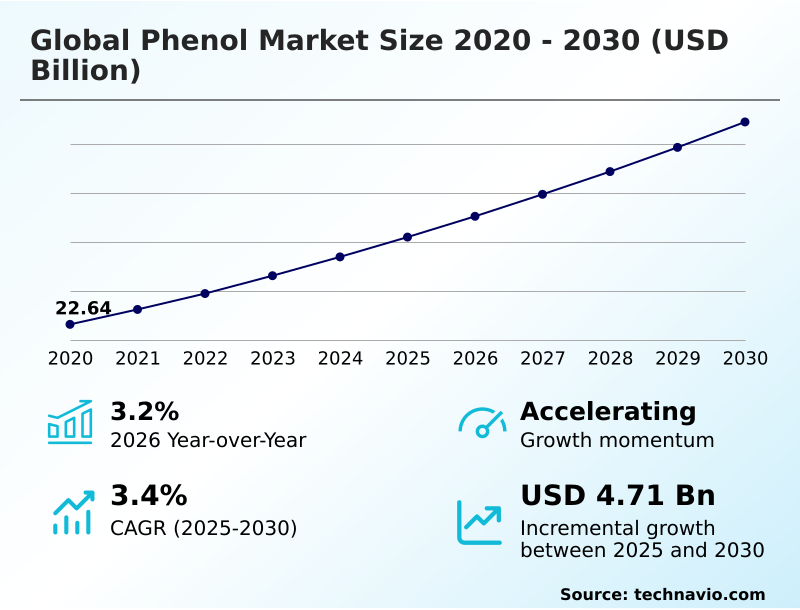
The phenol market size is valued to increase by USD 4.71 billion, at a CAGR of 3.4% from 2025 to 2030. Robust demand for BPA as primary growth catalyst will drive the phenol market.

Major Market Trends & Insights

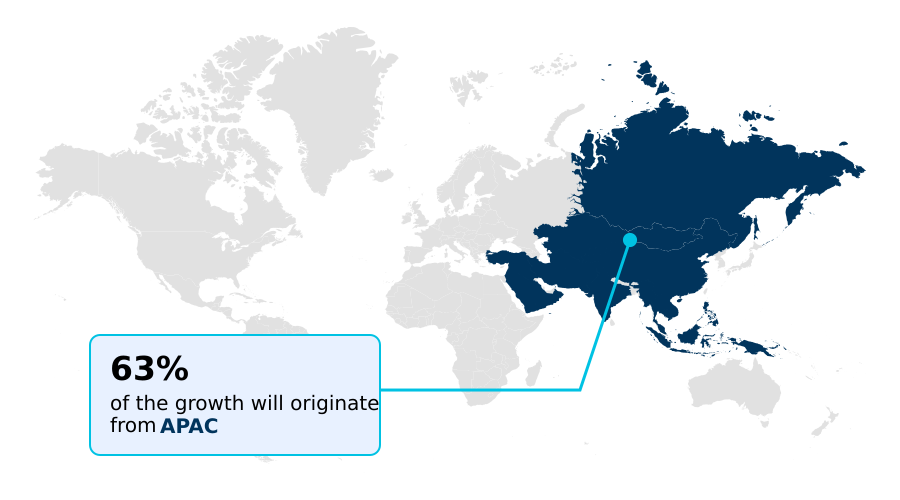
  • APAC dominated the market and accounted for a 62.9% growth during the forecast period.
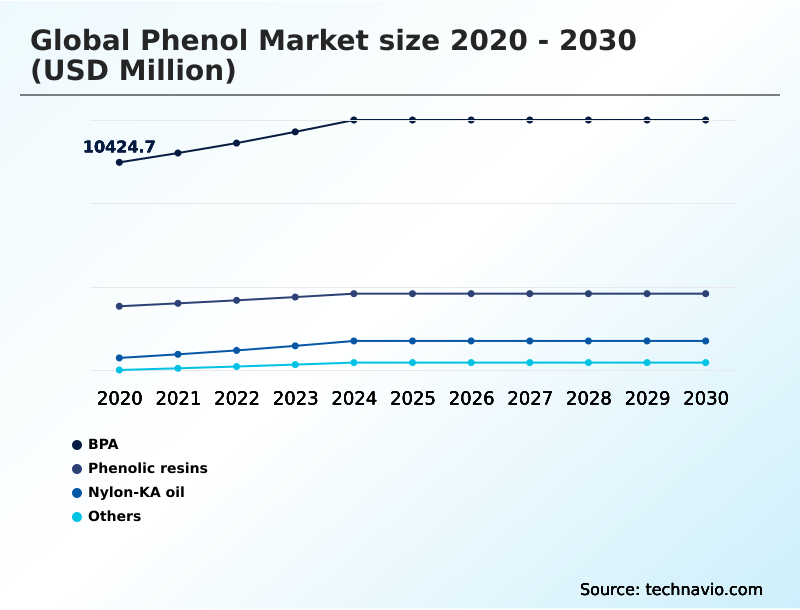
  • By Derivative Type - BPA segment was valued at USD 11.90 billion in 2024
  • By End-user - Chemical segment accounted for the largest market revenue share in 2024

Market Size & Forecast

  • Market Opportunities: USD 8.28 billion
  • Market Future Opportunities: USD 4.71 billion
  • CAGR from 2025 to 2030 : 3.4%

Market Summary

  • The phenol market is undergoing a significant transformation, shaped by the robust demand for its derivatives in high-performance applications and a strategic shift in global production capacities. Key drivers include the extensive use of polycarbonate and epoxy resins in the automotive and electronics sectors, which rely on phenol as a foundational chemical intermediate.
  • Concurrently, the industry is navigating the trend toward sustainable manufacturing, with research into bio-based alternatives gaining traction to mitigate environmental impact. However, the market contends with challenges such as pronounced feedstock price volatility and structural oversupply in certain regions, which pressures profit margins.
  • A typical business scenario involves a derivative manufacturer implementing advanced analytics to optimize its supply chain, enabling it to better forecast raw material price fluctuations and adjust production schedules, thereby improving operational efficiency and cost control in a competitive environment. This dynamic interplay of demand, innovation, and economic pressures defines the current landscape.

What will be the Size of the Phenol Market during the forecast period?

Get Key Insights on Market Forecast (PDF) Request Free Sample

How is the Phenol Market Segmented?

The phenol industry research report provides comprehensive data (region-wise segment analysis), with forecasts and estimates in "USD million" for the period 2026-2030, as well as historical data from 2020-2024 for the following segments.

  • Derivative type
    • BPA
    • Phenolic resins
    • Nylon-KA oil
    • Others
  • End-user
    • Chemical
    • Construction
    • Automotive
    • Electronic communication
    • Others
  • Channel
    • Indirect sale
    • Direct sale
  • Geography
    • APAC
      • China
      • India
      • Japan
    • Europe
      • Germany
      • France
      • UK
    • North America
      • US
      • Canada
      • Mexico
    • South America
      • Brazil
      • Argentina
      • Colombia
    • Middle East and Africa
      • Saudi Arabia
      • Turkey
      • UAE
    • Rest of World (ROW)

By Derivative Type Insights

The bpa segment is estimated to witness significant growth during the forecast period.

The global phenol market is segmented by derivative type, end-user, and geography. The bisphenol-a (bpa) segment is the largest, accounting for approximately 47% of phenol applications.

As a critical monomer, bpa is essential for producing high-performance materials like polycarbonate and epoxy resins, which are integral to numerous end-use industries.

The downstream demand for these phenol derivatives, including laminates, is driven by their use in automotive, electronics, and construction sectors. The synthesis of this aromatic organic compound through processes like hydrogenation underpins its role as a foundational industrial chemical.

This segmentation highlights the market's dependence on the performance of key industrial manufacturing outputs and the extensive reach of phenol's versatile applications.

Request Free Sample

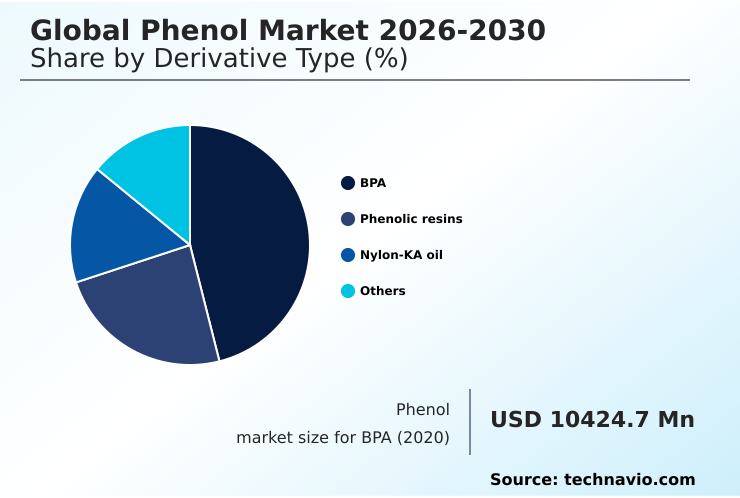
The BPA segment was valued at USD 11.90 billion in 2024 and showed a gradual increase during the forecast period.

Request Free Sample

Regional Analysis

APAC is estimated to contribute 62.9% to the growth of the global market during the forecast period.Technavio’s analysts have elaborately explained the regional trends and drivers that shape the market during the forecast period.

See How Phenol Market Demand is Rising in APAC Request Free Sample

The global phenol market is experiencing a profound geographic realignment, driven by shifting regional dynamics. The APAC region, particularly China, has become the dominant force, with new petrochemical infrastructure investments leading to superior operational efficiency.

This expansion alters global trade flows and reshapes the commodity chemicals market. In contrast, producers in North America and Europe are focusing on high-value derivatives such as alkylphenols and materials for semiconductor encapsulation and printed circuit boards (PCBs).

This strategic pivot leverages advanced synthesis process capabilities and feedstock integration to enhance supply chain resilience. Navigating this evolving manufacturing footprint and ensuring regulatory compliance across jurisdictions is essential for maintaining a competitive edge.

This shift underscores a broader trend where operational footprint alignment with demand centers is critical.

Market Dynamics

Our researchers analyzed the data with 2025 as the base year, along with the key drivers, trends, and challenges. A holistic analysis of drivers will help companies refine their marketing strategies to gain a competitive advantage.

  • The global phenol market is navigating a complex environment defined by specific end-use demands and production challenges. The primary application remains bisphenol-a for polycarbonate manufacturing, a cornerstone for durable goods. Concurrently, the use of phenolic resins in construction materials provides a stable, high-volume demand stream.
  • In specialty areas, caprolactam for nylon 6 synthesis and alkylphenols for industrial surfactants showcase the material's versatility. Key growth sectors include phenol applications in automotive components and epoxy resins for protective coatings, while phenol use in electronic communication is driven by miniaturization.
  • The push for sustainability trends in phenol production is evident in the exploration of bio-based phenol production from lignin. Operationally, firms are focused on managing feedstock price volatility and the efficiency of the cumene process, which remains the dominant production route.
  • The impact of regulations on phenol manufacturing is forcing investment in cleaner technologies, which can represent over 15% of new plant capital expenditure compared to older designs. The competitive landscape for phenol producers is intensifying due to phenol market oversupply challenges, making strategic sourcing of benzene and propylene critical.
  • This has led to a regional shift in phenol consumption toward areas with lower production costs. Businesses are now focused on optimizing phenol plant utilization rates and leveraging phenol as a chemical intermediate for higher-margin products, including its role in pharmaceutical synthesis and for creating specialty polymers.

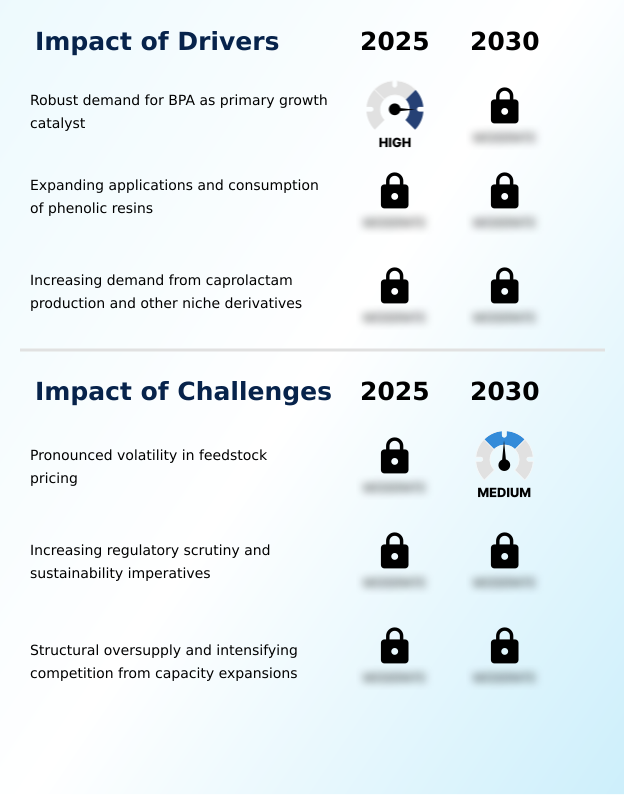
What are the key market drivers leading to the rise in the adoption of Phenol Industry?

  • Robust demand for bisphenol a (BPA) serves as a primary catalyst for growth in the phenol market.

  • The phenol market's growth is fundamentally driven by sustained downstream demand across the petrochemical value chain.
  • The cumene process remains the cornerstone of phenol production, supplying the essential chemical intermediate for derivatives like caprolactam, which undergoes polymerization to create nylon 6. This material's use in applications from textiles to automotive components highlights the market's reach.
  • The demand for industrial additives and industrial lubricants also contributes steadily. Technological advancement in chemical synthesis and catalytic process optimization is boosting production capacity, with some modernized plants improving yields by up to 3%.
  • This focus on efficiency in the synthesis process is crucial for producing high-performance materials and friction materials for various end-use industries.

What are the market trends shaping the Phenol Industry?

  • The expansion of applications for phenolic resins reinforces foundational demand. This development is emerging as a significant market trend.

  • Key trends are reshaping the global phenol market, driven by a strategic shift towards sustainability and value-added applications. The development of bio-based phenol from lignin feedstock is moving from niche research to a viable component of the circular economy framework.
  • This push for sustainable manufacturing and green chemistry is influencing the asset portfolio of major producers, with some achieving a 5% reduction in carbon footprint through process innovations. Simultaneously, the expanding use of high-performance thermosetting polymers and wood adhesives in construction provides foundational demand.
  • This strategic realignment allows producers to adjust their operational footprint away from commoditized segments toward specialty chemicals, enhancing market competitiveness. Such diversification within the value chain analysis is critical for long-term stability.

What challenges does the Phenol Industry face during its growth?

  • Pronounced volatility in feedstock pricing presents a significant challenge to the growth of the phenol industry.

  • Significant challenges in the phenol market stem from structural economic pressures and operational complexities. The primary issue is feedstock volatility, with unpredictable price instability for benzene and propylene creating severe margin compression. This forces a relentless focus on cost optimization and supply chain optimization to protect profitability.
  • The reliance on petroleum derivatives for raw material sourcing exposes producers to geopolitical and market-driven price shocks. In response, some firms with strong vertical integration report a 10% greater stability in input costs compared to those without. However, widespread oversupply leads to low capacity utilization, sometimes falling below 80% during economic downturns, which intensifies competition and leads to asset rationalization.
  • Managing this difficult balance of high operational expenditure and pricing pressure is a defining characteristic of the current market.

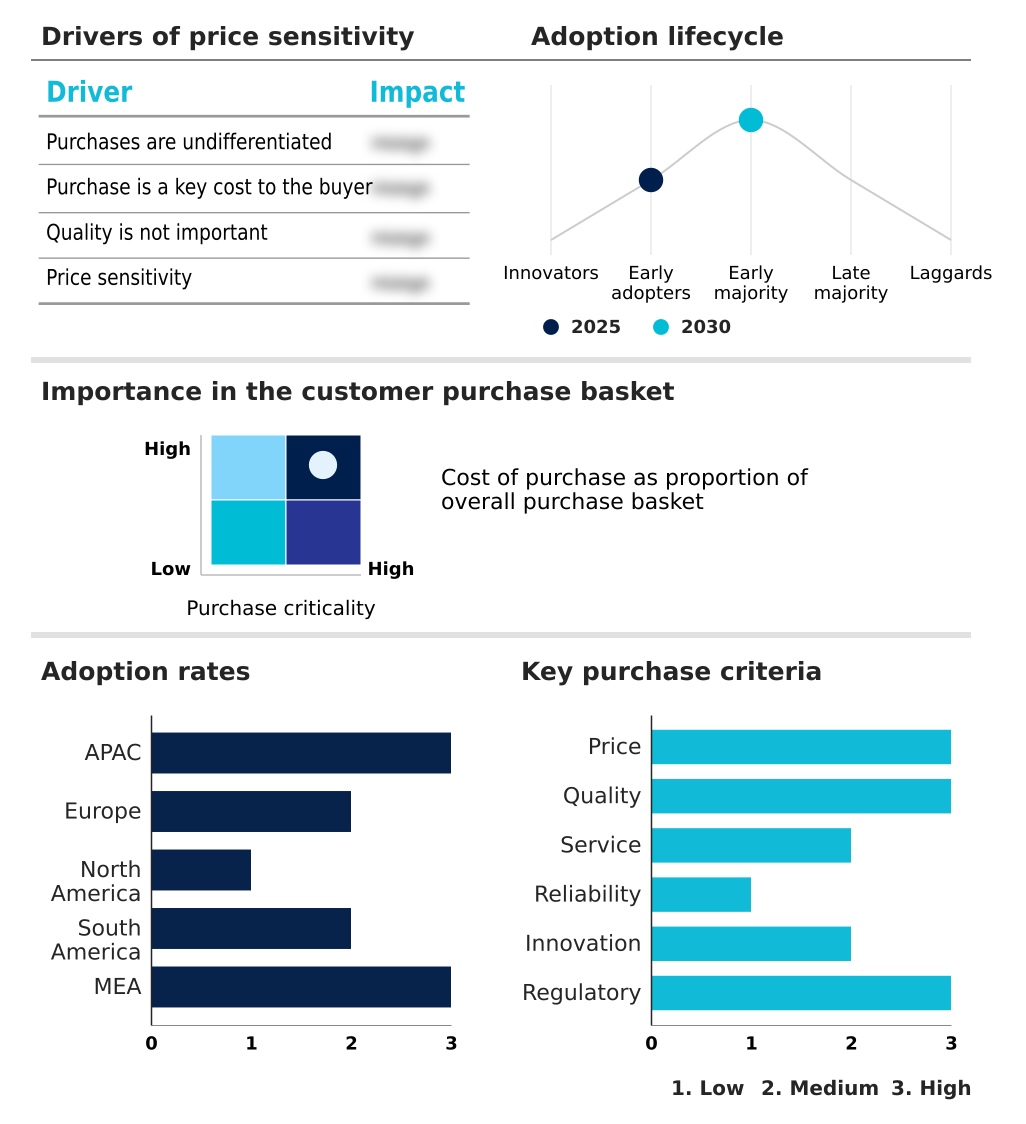
Exclusive Technavio Analysis on Customer Landscape

The phenol market forecasting report includes the adoption lifecycle of the market, covering from the innovator’s stage to the laggard’s stage. It focuses on adoption rates in different regions based on penetration. Furthermore, the phenol market report also includes key purchase criteria and drivers of price sensitivity to help companies evaluate and develop their market growth analysis strategies.

Customer Landscape of Phenol Industry

Competitive Landscape

Companies are implementing various strategies, such as strategic alliances, phenol market forecast, partnerships, mergers and acquisitions, geographical expansion, and product/service launches, to enhance their presence in the industry.

AdvanSix Inc. - Phenol offerings for bisphenol-a and phenolic resins are key to industrial applications, supporting diverse manufacturing of specialty chemicals and high-performance materials.

The industry research and growth report includes detailed analyses of the competitive landscape of the market and information about key companies, including:

  • AdvanSix Inc.
  • ALTIVIA
  • BASF SE
  • Chang Chun Group
  • Deepak Nitrite Ltd.
  • Domo Chemicals GmbH
  • Formosa Chemicals and Fibre Corp
  • Honeywell International Inc.
  • INEOS Group Holdings S.A.
  • Kumho Chemicals Inc.
  • LG Chem Ltd.
  • Mitsui Chemicals Inc.
  • MOEVE S.A.
  • Nanjing Chemical Material Corp
  • PTT Global Chemical Public Co.
  • Sasol Ltd.
  • Shell plc
  • Solvay SA
  • The Mitsubishi Chemical Group

Qualitative and quantitative analysis of companies has been conducted to help clients understand the wider business environment as well as the strengths and weaknesses of key industry players. Data is qualitatively analyzed to categorize companies as pure play, category-focused, industry-focused, and diversified; it is quantitatively analyzed to categorize companies as dominant, leading, strong, tentative, and weak.

Recent Development and News in Phenol market

  • In November 2024, Haldia Petrochemicals Ltd. announced an additional investment to augment its Haldia facility's phenol production capacity, with completion expected in the first quarter of 2026.
  • In January 2025, INEOS Phenol announced a significant capital investment to expand its production facility in Mobile, Alabama, to meet growing North American demand from the automotive and construction industries.
  • In April 2025, Sinopec and INEOS confirmed their joint venture to construct China's largest phenol and acetone facility in Nanjing, with an annual capacity of at least 400,000 tons of phenol.
  • In April 2025, Orlen declared its intention to discontinue phenol and acetone production at its Plock, Poland petrochemical site by the end of the year as part of a strategic realignment.

Dive into Technavio’s robust research methodology, blending expert interviews, extensive data synthesis, and validated models for unparalleled Phenol Market insights. See full methodology.

Market Scope
Page number 314
Base year 2025
Historic period 2020-2024
Forecast period 2026-2030
Growth momentum & CAGR Accelerate at a CAGR of 3.4%
Market growth 2026-2030 USD 4705.8 million
Market structure Fragmented
YoY growth 2025-2026(%) 3.2%
Key countries China, India, Japan, South Korea, Australia, Indonesia, Germany, Russia, France, UK, Spain, The Netherlands, US, Canada, Mexico, Brazil, Argentina, Colombia, Saudi Arabia, Turkey, UAE, South Africa and Egypt
Competitive landscape Leading Companies, Market Positioning of Companies, Competitive Strategies, and Industry Risks

Request Free Sample

Research Analyst Overview

  • The phenol market is defined by a strategic recalibration of global supply chains and a heightened focus on production economics. The industry is moving beyond its reliance on traditional end-use industries by advancing green chemistry initiatives, such as developing bio-based phenol from lignin feedstock.
  • This transition toward sustainable manufacturing is creating a new competitive paradigm where the ability to innovate within a circular economy framework is as critical as cost optimization. This shift directly influences boardroom decisions on capital allocation, with investments in green technologies now a key part of long-term strategy to ensure market competitiveness and de-risk the asset portfolio from feedstock volatility.
  • In this landscape, operational efficiency and a resilient manufacturing footprint are paramount. For instance, companies adopting advanced catalytic process technologies have reported improvements in yield and energy consumption, leading to a more favorable operational expenditure profile. The strategic realignment of production capacity toward high-growth regions reflects a fundamental adaptation to evolving downstream demand and global trade flows.

What are the Key Data Covered in this Phenol Market Research and Growth Report?

  • What is the expected growth of the Phenol Market between 2026 and 2030?

    • USD 4.71 billion, at a CAGR of 3.4%

  • What segmentation does the market report cover?

    • The report is segmented by Derivative Type (BPA, Phenolic resins, Nylon-KA oil, and Others), End-user (Chemical, Construction, Automotive, Electronic communication, and Others), Channel (Indirect sale, and Direct sale) and Geography (APAC, Europe, North America, South America, Middle East and Africa)

  • Which regions are analyzed in the report?

    • APAC, Europe, North America, South America and Middle East and Africa

  • What are the key growth drivers and market challenges?

    • Robust demand for BPA as primary growth catalyst, Pronounced volatility in feedstock pricing

  • Who are the major players in the Phenol Market?

    • AdvanSix Inc., ALTIVIA, BASF SE, Chang Chun Group, Deepak Nitrite Ltd., Domo Chemicals GmbH, Formosa Chemicals and Fibre Corp, Honeywell International Inc., INEOS Group Holdings S.A., Kumho Chemicals Inc., LG Chem Ltd., Mitsui Chemicals Inc., MOEVE S.A., Nanjing Chemical Material Corp, PTT Global Chemical Public Co., Sasol Ltd., Shell plc, Solvay SA and The Mitsubishi Chemical Group

Market Research Insights

  • The phenol market is characterized by complex dynamics where operational efficiency and strategic raw material sourcing are paramount. Within the petrochemical value chain, producers navigate significant price instability, with integrated firms often achieving a 10-15% cost advantage over non-integrated competitors.
  • Adherence to stringent regulatory compliance for industrial chemical production has spurred technological advancement, leading to process optimizations that have reduced wastewater effluent by over 20% in modern facilities. The downstream demand for high-performance materials and phenol derivatives is reshaping global trade flows, forcing a strategic realignment of manufacturing footprints.
  • Companies are increasingly focused on supply chain resilience to mitigate the effects of margin compression and ensure stable production capacity for diverse phenol applications across end-use industries.

We can help! Our analysts can customize this phenol market research report to meet your requirements.

Get in touch

1. Executive Summary

1.1 Market overview

Executive Summary - Chart on Market Overview
Executive Summary - Data Table on Market Overview
Executive Summary - Chart on Global Market Characteristics
Executive Summary - Chart on Market by Geography
Executive Summary - Chart on Market Segmentation by Derivative Type
Executive Summary - Chart on Market Segmentation by End-user
Executive Summary - Chart on Market Segmentation by Channel
Executive Summary - Chart on Incremental Growth
Executive Summary - Data Table on Incremental Growth
Executive Summary - Chart on Company Market Positioning

2. Technavio Analysis

2.1 Analysis of price sensitivity, lifecycle, customer purchase basket, adoption rates, and purchase criteria

2.2 Criticality of inputs and Factors of differentiation

Chart on Overview on criticality of inputs and factors of differentiation

2.3 Factors of disruption

Chart on Overview on factors of disruption

2.4 Impact of drivers and challenges

Chart on Impact of drivers and challenges in 2025 and 2030

3. Market Landscape

3.1 Market ecosystem

Chart on Parent Market
Data Table on - Parent Market

3.2 Market characteristics

Chart on Market characteristics analysis

3.3 Value chain analysis

Chart on Value chain analysis

4. Market Sizing

4.1 Market definition

Data Table on Offerings of companies included in the market definition

4.2 Market segment analysis

Market segments

4.3 Market size 2025

4.4 Market outlook: Forecast for 2025-2030

Chart on Global - Market size and forecast 2025-2030 ($ million)
Data Table on Global - Market size and forecast 2025-2030 ($ million)
Chart on Global Market: Year-over-year growth 2025-2030 (%)
Data Table on Global Market: Year-over-year growth 2025-2030 (%)

5. Historic Market Size

5.1 Global Phenol Market 2020 - 2024

Historic Market Size - Data Table on Global Phenol Market 2020 - 2024 ($ million)

5.2 Derivative Type segment analysis 2020 - 2024

Historic Market Size - Derivative Type Segment 2020 - 2024 ($ million)

5.3 End-user segment analysis 2020 - 2024

Historic Market Size - End-user Segment 2020 - 2024 ($ million)

5.4 Channel segment analysis 2020 - 2024

Historic Market Size - Channel Segment 2020 - 2024 ($ million)

5.5 Geography segment analysis 2020 - 2024

Historic Market Size - Geography Segment 2020 - 2024 ($ million)

5.6 Country segment analysis 2020 - 2024

Historic Market Size - Country Segment 2020 - 2024 ($ million)

6. Qualitative Analysis

6.1 Impact of AI on global phenol market

6.2 Impact of geopolitical conflicts on global phenol market

7. Five Forces Analysis

7.1 Five forces summary

Five forces analysis - Comparison between 2025 and 2030

7.2 Bargaining power of buyers

Bargaining power of buyers - Impact of key factors 2025 and 2030

7.3 Bargaining power of suppliers

Bargaining power of suppliers - Impact of key factors in 2025 and 2030

7.4 Threat of new entrants

Threat of new entrants - Impact of key factors in 2025 and 2030

7.5 Threat of substitutes

Threat of substitutes - Impact of key factors in 2025 and 2030

7.6 Threat of rivalry

Threat of rivalry - Impact of key factors in 2025 and 2030

7.7 Market condition

Chart on Market condition - Five forces 2025 and 2030

8. Market Segmentation by Derivative Type

8.1 Market segments

Chart on Derivative Type - Market share 2025-2030 (%)
Data Table on Derivative Type - Market share 2025-2030 (%)

8.2 Comparison by Derivative Type

Chart on Comparison by Derivative Type
Data Table on Comparison by Derivative Type

8.3 BPA - Market size and forecast 2025-2030

Chart on BPA - Market size and forecast 2025-2030 ($ million)
Data Table on BPA - Market size and forecast 2025-2030 ($ million)
Chart on BPA - Year-over-year growth 2025-2030 (%)
Data Table on BPA - Year-over-year growth 2025-2030 (%)

8.4 Phenolic resins - Market size and forecast 2025-2030

Chart on Phenolic resins - Market size and forecast 2025-2030 ($ million)
Data Table on Phenolic resins - Market size and forecast 2025-2030 ($ million)
Chart on Phenolic resins - Year-over-year growth 2025-2030 (%)
Data Table on Phenolic resins - Year-over-year growth 2025-2030 (%)

8.5 Nylon-KA oil - Market size and forecast 2025-2030

Chart on Nylon-KA oil - Market size and forecast 2025-2030 ($ million)
Data Table on Nylon-KA oil - Market size and forecast 2025-2030 ($ million)
Chart on Nylon-KA oil - Year-over-year growth 2025-2030 (%)
Data Table on Nylon-KA oil - Year-over-year growth 2025-2030 (%)

8.6 Others - Market size and forecast 2025-2030

Chart on Others - Market size and forecast 2025-2030 ($ million)
Data Table on Others - Market size and forecast 2025-2030 ($ million)
Chart on Others - Year-over-year growth 2025-2030 (%)
Data Table on Others - Year-over-year growth 2025-2030 (%)

8.7 Market opportunity by Derivative Type

Market opportunity by Derivative Type ($ million)
Data Table on Market opportunity by Derivative Type ($ million)

9. Market Segmentation by End-user

9.1 Market segments

Chart on End-user - Market share 2025-2030 (%)
Data Table on End-user - Market share 2025-2030 (%)

9.2 Comparison by End-user

Chart on Comparison by End-user
Data Table on Comparison by End-user

9.3 Chemical - Market size and forecast 2025-2030

Chart on Chemical - Market size and forecast 2025-2030 ($ million)
Data Table on Chemical - Market size and forecast 2025-2030 ($ million)
Chart on Chemical - Year-over-year growth 2025-2030 (%)
Data Table on Chemical - Year-over-year growth 2025-2030 (%)

9.4 Construction - Market size and forecast 2025-2030

Chart on Construction - Market size and forecast 2025-2030 ($ million)
Data Table on Construction - Market size and forecast 2025-2030 ($ million)
Chart on Construction - Year-over-year growth 2025-2030 (%)
Data Table on Construction - Year-over-year growth 2025-2030 (%)

9.5 Automotive - Market size and forecast 2025-2030

Chart on Automotive - Market size and forecast 2025-2030 ($ million)
Data Table on Automotive - Market size and forecast 2025-2030 ($ million)
Chart on Automotive - Year-over-year growth 2025-2030 (%)
Data Table on Automotive - Year-over-year growth 2025-2030 (%)

9.6 Electronic communication - Market size and forecast 2025-2030

Chart on Electronic communication - Market size and forecast 2025-2030 ($ million)
Data Table on Electronic communication - Market size and forecast 2025-2030 ($ million)
Chart on Electronic communication - Year-over-year growth 2025-2030 (%)
Data Table on Electronic communication - Year-over-year growth 2025-2030 (%)

9.7 Others - Market size and forecast 2025-2030

Chart on Others - Market size and forecast 2025-2030 ($ million)
Data Table on Others - Market size and forecast 2025-2030 ($ million)
Chart on Others - Year-over-year growth 2025-2030 (%)
Data Table on Others - Year-over-year growth 2025-2030 (%)

9.8 Market opportunity by End-user

Market opportunity by End-user ($ million)
Data Table on Market opportunity by End-user ($ million)

10. Market Segmentation by Channel

10.1 Market segments

Chart on Channel - Market share 2025-2030 (%)
Data Table on Channel - Market share 2025-2030 (%)

10.2 Comparison by Channel

Chart on Comparison by Channel
Data Table on Comparison by Channel

10.3 Indirect sale - Market size and forecast 2025-2030

Chart on Indirect sale - Market size and forecast 2025-2030 ($ million)
Data Table on Indirect sale - Market size and forecast 2025-2030 ($ million)
Chart on Indirect sale - Year-over-year growth 2025-2030 (%)
Data Table on Indirect sale - Year-over-year growth 2025-2030 (%)

10.4 Direct sale - Market size and forecast 2025-2030

Chart on Direct sale - Market size and forecast 2025-2030 ($ million)
Data Table on Direct sale - Market size and forecast 2025-2030 ($ million)
Chart on Direct sale - Year-over-year growth 2025-2030 (%)
Data Table on Direct sale - Year-over-year growth 2025-2030 (%)

10.5 Market opportunity by Channel

Market opportunity by Channel ($ million)
Data Table on Market opportunity by Channel ($ million)

11. Customer Landscape

11.1 Customer landscape overview

Analysis of price sensitivity, lifecycle, customer purchase basket, adoption rates, and purchase criteria

12. Geographic Landscape

12.1 Geographic segmentation

Chart on Market share by geography 2025-2030 (%)
Data Table on Market share by geography 2025-2030 (%)

12.2 Geographic comparison

Chart on Geographic comparison
Data Table on Geographic comparison

12.3 APAC - Market size and forecast 2025-2030

Chart on APAC - Market size and forecast 2025-2030 ($ million)
Data Table on APAC - Market size and forecast 2025-2030 ($ million)
Chart on APAC - Year-over-year growth 2025-2030 (%)
Data Table on APAC - Year-over-year growth 2025-2030 (%)
Chart on Regional Comparison - APAC
Data Table on Regional Comparison - APAC

12.3.1 China - Market size and forecast 2025-2030

Chart on China - Market size and forecast 2025-2030 ($ million)
Data Table on China - Market size and forecast 2025-2030 ($ million)
Chart on China - Year-over-year growth 2025-2030 (%)
Data Table on China - Year-over-year growth 2025-2030 (%)

12.3.2 India - Market size and forecast 2025-2030

Chart on India - Market size and forecast 2025-2030 ($ million)
Data Table on India - Market size and forecast 2025-2030 ($ million)
Chart on India - Year-over-year growth 2025-2030 (%)
Data Table on India - Year-over-year growth 2025-2030 (%)

12.3.3 Japan - Market size and forecast 2025-2030

Chart on Japan - Market size and forecast 2025-2030 ($ million)
Data Table on Japan - Market size and forecast 2025-2030 ($ million)
Chart on Japan - Year-over-year growth 2025-2030 (%)
Data Table on Japan - Year-over-year growth 2025-2030 (%)

12.3.4 South Korea - Market size and forecast 2025-2030

Chart on South Korea - Market size and forecast 2025-2030 ($ million)
Data Table on South Korea - Market size and forecast 2025-2030 ($ million)
Chart on South Korea - Year-over-year growth 2025-2030 (%)
Data Table on South Korea - Year-over-year growth 2025-2030 (%)

12.3.5 Australia - Market size and forecast 2025-2030

Chart on Australia - Market size and forecast 2025-2030 ($ million)
Data Table on Australia - Market size and forecast 2025-2030 ($ million)
Chart on Australia - Year-over-year growth 2025-2030 (%)
Data Table on Australia - Year-over-year growth 2025-2030 (%)

12.3.6 Indonesia - Market size and forecast 2025-2030

Chart on Indonesia - Market size and forecast 2025-2030 ($ million)
Data Table on Indonesia - Market size and forecast 2025-2030 ($ million)
Chart on Indonesia - Year-over-year growth 2025-2030 (%)
Data Table on Indonesia - Year-over-year growth 2025-2030 (%)

12.4 Europe - Market size and forecast 2025-2030

Chart on Europe - Market size and forecast 2025-2030 ($ million)
Data Table on Europe - Market size and forecast 2025-2030 ($ million)
Chart on Europe - Year-over-year growth 2025-2030 (%)
Data Table on Europe - Year-over-year growth 2025-2030 (%)
Chart on Regional Comparison - Europe
Data Table on Regional Comparison - Europe

12.4.1 Germany - Market size and forecast 2025-2030

Chart on Germany - Market size and forecast 2025-2030 ($ million)
Data Table on Germany - Market size and forecast 2025-2030 ($ million)
Chart on Germany - Year-over-year growth 2025-2030 (%)
Data Table on Germany - Year-over-year growth 2025-2030 (%)

12.4.2 Russia - Market size and forecast 2025-2030

Chart on Russia - Market size and forecast 2025-2030 ($ million)
Data Table on Russia - Market size and forecast 2025-2030 ($ million)
Chart on Russia - Year-over-year growth 2025-2030 (%)
Data Table on Russia - Year-over-year growth 2025-2030 (%)

12.4.3 France - Market size and forecast 2025-2030

Chart on France - Market size and forecast 2025-2030 ($ million)
Data Table on France - Market size and forecast 2025-2030 ($ million)
Chart on France - Year-over-year growth 2025-2030 (%)
Data Table on France - Year-over-year growth 2025-2030 (%)

12.4.4 UK - Market size and forecast 2025-2030

Chart on UK - Market size and forecast 2025-2030 ($ million)
Data Table on UK - Market size and forecast 2025-2030 ($ million)
Chart on UK - Year-over-year growth 2025-2030 (%)
Data Table on UK - Year-over-year growth 2025-2030 (%)

12.4.5 Spain - Market size and forecast 2025-2030

Chart on Spain - Market size and forecast 2025-2030 ($ million)
Data Table on Spain - Market size and forecast 2025-2030 ($ million)
Chart on Spain - Year-over-year growth 2025-2030 (%)
Data Table on Spain - Year-over-year growth 2025-2030 (%)

12.4.6 The Netherlands - Market size and forecast 2025-2030

Chart on The Netherlands - Market size and forecast 2025-2030 ($ million)
Data Table on The Netherlands - Market size and forecast 2025-2030 ($ million)
Chart on The Netherlands - Year-over-year growth 2025-2030 (%)
Data Table on The Netherlands - Year-over-year growth 2025-2030 (%)

12.5 North America - Market size and forecast 2025-2030

Chart on North America - Market size and forecast 2025-2030 ($ million)
Data Table on North America - Market size and forecast 2025-2030 ($ million)
Chart on North America - Year-over-year growth 2025-2030 (%)
Data Table on North America - Year-over-year growth 2025-2030 (%)
Chart on Regional Comparison - North America
Data Table on Regional Comparison - North America

12.5.1 US - Market size and forecast 2025-2030

Chart on US - Market size and forecast 2025-2030 ($ million)
Data Table on US - Market size and forecast 2025-2030 ($ million)
Chart on US - Year-over-year growth 2025-2030 (%)
Data Table on US - Year-over-year growth 2025-2030 (%)

12.5.2 Canada - Market size and forecast 2025-2030

Chart on Canada - Market size and forecast 2025-2030 ($ million)
Data Table on Canada - Market size and forecast 2025-2030 ($ million)
Chart on Canada - Year-over-year growth 2025-2030 (%)
Data Table on Canada - Year-over-year growth 2025-2030 (%)

12.5.3 Mexico - Market size and forecast 2025-2030

Chart on Mexico - Market size and forecast 2025-2030 ($ million)
Data Table on Mexico - Market size and forecast 2025-2030 ($ million)
Chart on Mexico - Year-over-year growth 2025-2030 (%)
Data Table on Mexico - Year-over-year growth 2025-2030 (%)

12.6 South America - Market size and forecast 2025-2030

Chart on South America - Market size and forecast 2025-2030 ($ million)
Data Table on South America - Market size and forecast 2025-2030 ($ million)
Chart on South America - Year-over-year growth 2025-2030 (%)
Data Table on South America - Year-over-year growth 2025-2030 (%)
Chart on Regional Comparison - South America
Data Table on Regional Comparison - South America

12.6.1 Brazil - Market size and forecast 2025-2030

Chart on Brazil - Market size and forecast 2025-2030 ($ million)
Data Table on Brazil - Market size and forecast 2025-2030 ($ million)
Chart on Brazil - Year-over-year growth 2025-2030 (%)
Data Table on Brazil - Year-over-year growth 2025-2030 (%)

12.6.2 Argentina - Market size and forecast 2025-2030

Chart on Argentina - Market size and forecast 2025-2030 ($ million)
Data Table on Argentina - Market size and forecast 2025-2030 ($ million)
Chart on Argentina - Year-over-year growth 2025-2030 (%)
Data Table on Argentina - Year-over-year growth 2025-2030 (%)

12.6.3 Colombia - Market size and forecast 2025-2030

Chart on Colombia - Market size and forecast 2025-2030 ($ million)
Data Table on Colombia - Market size and forecast 2025-2030 ($ million)
Chart on Colombia - Year-over-year growth 2025-2030 (%)
Data Table on Colombia - Year-over-year growth 2025-2030 (%)

12.7 Middle East and Africa - Market size and forecast 2025-2030

Chart on Middle East and Africa - Market size and forecast 2025-2030 ($ million)
Data Table on Middle East and Africa - Market size and forecast 2025-2030 ($ million)
Chart on Middle East and Africa - Year-over-year growth 2025-2030 (%)
Data Table on Middle East and Africa - Year-over-year growth 2025-2030 (%)
Chart on Regional Comparison - Middle East and Africa
Data Table on Regional Comparison - Middle East and Africa

12.7.1 Saudi Arabia - Market size and forecast 2025-2030

Chart on Saudi Arabia - Market size and forecast 2025-2030 ($ million)
Data Table on Saudi Arabia - Market size and forecast 2025-2030 ($ million)
Chart on Saudi Arabia - Year-over-year growth 2025-2030 (%)
Data Table on Saudi Arabia - Year-over-year growth 2025-2030 (%)

12.7.2 Turkey - Market size and forecast 2025-2030

Chart on Turkey - Market size and forecast 2025-2030 ($ million)
Data Table on Turkey - Market size and forecast 2025-2030 ($ million)
Chart on Turkey - Year-over-year growth 2025-2030 (%)
Data Table on Turkey - Year-over-year growth 2025-2030 (%)

12.7.3 UAE - Market size and forecast 2025-2030

Chart on UAE - Market size and forecast 2025-2030 ($ million)
Data Table on UAE - Market size and forecast 2025-2030 ($ million)
Chart on UAE - Year-over-year growth 2025-2030 (%)
Data Table on UAE - Year-over-year growth 2025-2030 (%)

12.7.4 South Africa - Market size and forecast 2025-2030

Chart on South Africa - Market size and forecast 2025-2030 ($ million)
Data Table on South Africa - Market size and forecast 2025-2030 ($ million)
Chart on South Africa - Year-over-year growth 2025-2030 (%)
Data Table on South Africa - Year-over-year growth 2025-2030 (%)

12.7.5 Egypt - Market size and forecast 2025-2030

Chart on Egypt - Market size and forecast 2025-2030 ($ million)
Data Table on Egypt - Market size and forecast 2025-2030 ($ million)
Chart on Egypt - Year-over-year growth 2025-2030 (%)
Data Table on Egypt - Year-over-year growth 2025-2030 (%)

12.8 Market opportunity by geography

Market opportunity by geography ($ million)
Data Tables on Market opportunity by geography ($ million)

13. Drivers, Challenges, and Opportunity

13.1 Market drivers

Robust demand for BPA as primary growth catalyst
Expanding applications and consumption of phenolic resins
Increasing demand from caprolactam production and other niche derivatives

13.2 Market challenges

Pronounced volatility in feedstock pricing
Increasing regulatory scrutiny and sustainability imperatives
Structural oversupply and intensifying competition from capacity expansions

13.3 Impact of drivers and challenges

Impact of drivers and challenges in 2025 and 2030

13.4 Market opportunities

Expanding applications in phenolic resins reinforcing foundational demand
Emergence of bio-based phenol and sustainable manufacturing processes
Significant geographical shift in production and consumption towards Asia Pacific region

14. Competitive Landscape

14.1 Overview

14.2

Overview on criticality of inputs and factors of differentiation

14.3 Landscape disruption

Overview on factors of disruption

14.4 Industry risks

Impact of key risks on business

15. Competitive Analysis

15.1 Companies profiled

Companies covered

15.2 Company ranking index

15.3 Market positioning of companies

Matrix on companies position and classification

15.4 AdvanSix Inc.

AdvanSix Inc. - Overview
AdvanSix Inc. - Business segments
AdvanSix Inc. - Key offerings
AdvanSix Inc. - Segment focus
SWOT

15.5 BASF SE

BASF SE - Overview
BASF SE - Business segments
BASF SE - Key news
BASF SE - Key offerings
BASF SE - Segment focus
SWOT

15.6 Chang Chun Group

Chang Chun Group - Overview
Chang Chun Group - Product / Service
Chang Chun Group - Key offerings
SWOT

15.7 Deepak Nitrite Ltd.

Deepak Nitrite Ltd. - Overview
Deepak Nitrite Ltd. - Business segments
Deepak Nitrite Ltd. - Key offerings
Deepak Nitrite Ltd. - Segment focus
SWOT

15.8 Domo Chemicals GmbH

Domo Chemicals GmbH - Overview
Domo Chemicals GmbH - Product / Service
Domo Chemicals GmbH - Key offerings
SWOT

15.9 Honeywell International Inc.

Honeywell International Inc. - Overview
Honeywell International Inc. - Business segments
Honeywell International Inc. - Key news
Honeywell International Inc. - Key offerings
Honeywell International Inc. - Segment focus
SWOT

15.10 INEOS Group Holdings S.A.

INEOS Group Holdings S.A. - Overview
INEOS Group Holdings S.A. - Product / Service
INEOS Group Holdings S.A. - Key offerings
SWOT

15.11 LG Chem Ltd.

LG Chem Ltd. - Overview
LG Chem Ltd. - Business segments
LG Chem Ltd. - Key offerings
LG Chem Ltd. - Segment focus
SWOT

15.12 Mitsui Chemicals Inc.

Mitsui Chemicals Inc. - Overview
Mitsui Chemicals Inc. - Business segments
Mitsui Chemicals Inc. - Key offerings
Mitsui Chemicals Inc. - Segment focus
SWOT

15.13 MOEVE S.A.

MOEVE S.A. - Overview
MOEVE S.A. - Product / Service
MOEVE S.A. - Key offerings
SWOT

15.14 PTT Global Chemical Public Co.

PTT Global Chemical Public Co. - Overview
PTT Global Chemical Public Co. - Business segments
PTT Global Chemical Public Co. - Key offerings
PTT Global Chemical Public Co. - Segment focus
SWOT

15.15 Sasol Ltd.

Sasol Ltd. - Overview
Sasol Ltd. - Business segments
Sasol Ltd. - Key offerings
Sasol Ltd. - Segment focus
SWOT

15.16 Shell plc

Shell plc - Overview
Shell plc - Business segments
Shell plc - Key news
Shell plc - Key offerings
Shell plc - Segment focus
SWOT

15.17 Solvay SA

Solvay SA - Overview
Solvay SA - Business segments
Solvay SA - Key offerings
Solvay SA - Segment focus
SWOT

15.18 The Mitsubishi Chemical Group

The Mitsubishi Chemical Group - Overview
The Mitsubishi Chemical Group - Business segments
The Mitsubishi Chemical Group - Key news
The Mitsubishi Chemical Group - Key offerings
The Mitsubishi Chemical Group - Segment focus
SWOT

16. Appendix

16.1 Scope of the report

Market definition
Objectives
Notes and caveats

16.2 Inclusions and exclusions checklist

Inclusions checklist
Exclusions checklist

16.3 Currency conversion rates for US$

16.4 Research methodology

16.5 Data procurement

Information sources

16.6 Data validation

16.7 Validation techniques employed for market sizing

16.8 Data synthesis

16.9 360 degree market analysis

16.10 List of abbreviations

Research Methodology

Technavio presents a detailed picture of the market by way of study, synthesis, and summation of data from multiple sources. The analysts have presented the various facets of the market with a particular focus on identifying the key industry influencers. The data thus presented is comprehensive, reliable, and the result of extensive research, both primary and secondary.

INFORMATION SOURCES

Primary sources

  • Manufacturers and suppliers
  • Channel partners
  • Industry experts
  • Strategic decision makers

Secondary sources

  • Industry journals and periodicals
  • Government data
  • Financial reports of key industry players
  • Historical data
  • Press releases

DATA ANALYSIS

Data Synthesis

  • Collation of data
  • Estimation of key figures
  • Analysis of derived insights

Data Validation

  • Triangulation with data models
  • Reference against proprietary databases
  • Corroboration with industry experts

REPORT WRITING

Qualitative

  • Market drivers
  • Market challenges
  • Market trends
  • Five forces analysis

Quantitative

  • Market size and forecast
  • Market segmentation
  • Geographical insights
  • Competitive landscape

Interested in this report?

Get your sample now to see our research methodology and insights!

Download Now

Frequently Asked Questions

Phenol market growth will increase by USD 4705.8 million during 2026-2030.

The Phenol market is expected to grow at a CAGR of 3.4% during 2026-2030.

Phenol market is segmented by Derivative type (BPA, Phenolic resins, Nylon-KA oil, Others) End-user (Chemical, Construction, Automotive, Electronic communication, Others) Channel (Indirect sale, Direct sale)

AdvanSix Inc., ALTIVIA, BASF SE, Chang Chun Group, Deepak Nitrite Ltd., Domo Chemicals GmbH, Formosa Chemicals and Fibre Corp, Honeywell International Inc., INEOS Group Holdings S.A., Kumho Chemicals Inc., LG Chem Ltd., Mitsui Chemicals Inc., MOEVE S.A., Nanjing Chemical Material Corp, PTT Global Chemical Public Co., Sasol Ltd., Shell plc, Solvay SA, The Mitsubishi Chemical Group are a few of the key vendors in the Phenol market.

APAC will register the highest growth rate of 62.9% among the other regions. Therefore, the Phenol market in APAC is expected to garner significant business opportunities for the vendors during the forecast period.

China, India, Japan, South Korea, Australia, Indonesia, Germany, Russia, France, UK, Spain, The Netherlands, US, Canada, Mexico, Brazil, Argentina, Colombia, Saudi Arabia, Turkey, UAE, South Africa, Egypt

  • Robust demand for BPA as primary growth catalyst is the driving factor this market.

The Phenol market vendors should focus on grabbing business opportunities from the Derivative type segment as it accounted for the largest market share in the base year.
RIA - Research AI Assistant
Ask RIA