
Polycarbonate Plastic Market Size 2025-2029
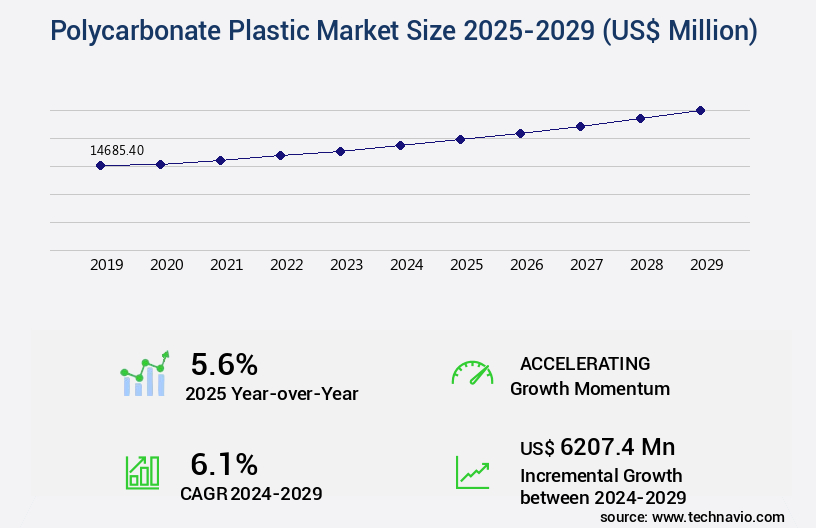
The polycarbonate plastic market size is valued to increase USD 6.21 billion, at a CAGR of 6.1% from 2024 to 2029. Increasing demand in electronic products will drive the polycarbonate plastic market.
Major Market Trends & Insights
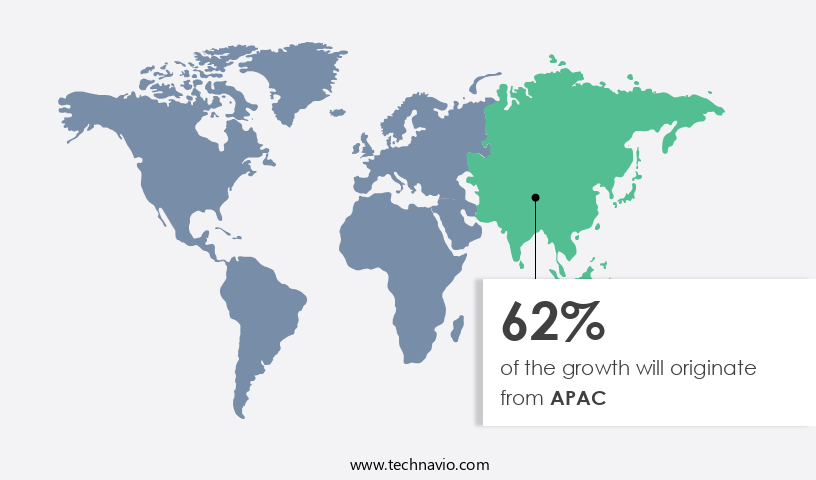
- APAC dominated the market and accounted for a 62% growth during the forecast period.
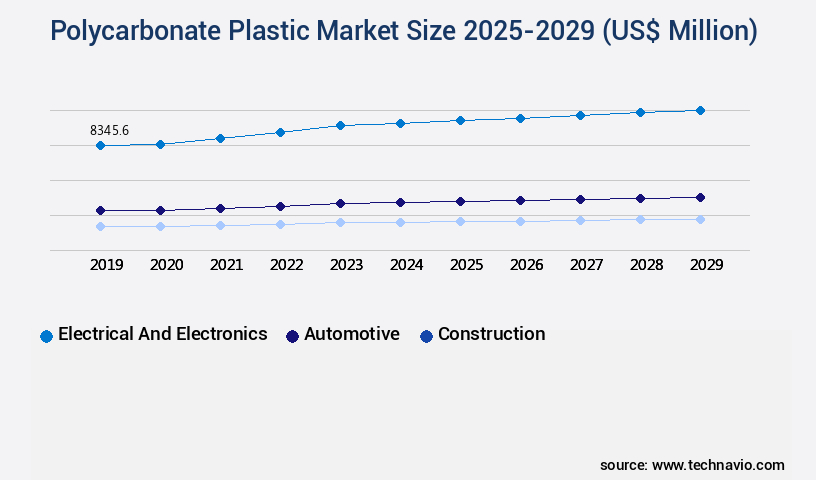
- By End-user - Electrical and electronics segment was valued at USD 8.35 billion in 2023
- By Channel - Direct sale segment accounted for the largest market revenue share in 2023
Market Size & Forecast
- Market Opportunities: USD 65.68 billion
- Market Future Opportunities: USD 6.21 billion
- CAGR : 6.1%
- APAC: Largest market in 2023
Market Summary
- The market represents a dynamic and continually evolving industry, driven by advancements in core technologies and applications. This market is characterized by the increasing use of polycarbonate plastics in various sectors, such as automotive, construction, and electronics. In the automotive industry, the demand for lightweight and durable materials is driving the adoption of polycarbonate plastics, accounting for over 15% of the market share. Similarly, in the construction sector, the availability of polycarbonate roofing sheets with superior UV resistance and insulation properties is increasing their adoption for roofing applications. However, the market faces challenges from the availability of substitutes for polycarbonate plastics, such as glass and acrylic.
- Looking forward, the forecast period presents significant opportunities for growth, with increasing demand in electronic products and the expansion of the market in emerging regions like Asia Pacific.
What will be the Size of the Polycarbonate Plastic Market during the forecast period?
Get Key Insights on Market Forecast (PDF) Request Free Sample
How is the Polycarbonate Plastic Market Segmented and what are the key trends of market segmentation?
The polycarbonate plastic industry research report provides comprehensive data (region-wise segment analysis), with forecasts and estimates in "USD million" for the period 2025-2029, as well as historical data from 2019-2023 for the following segments.
- End-user
- Electrical and electronics
- Automotive
- Construction
- Others
- Channel
- Direct sale
- Indirect sale
- Grade Type
- Standard purpose grade
- Flame retardant grade
- Medical grade
- Food grade
- Others
- Geography
- North America
- US
- Canada
- Europe
- France
- Germany
- Italy
- UK
- Middle East and Africa
- Egypt
- KSA
- Oman
- UAE
- APAC
- China
- India
- Japan
- South America
- Argentina
- Brazil
- Rest of World (ROW)
- North America
By End-user Insights
The electrical and electronics segment is estimated to witness significant growth during the forecast period.
Polycarbonate plastics have gained significant traction in various industries due to their exceptional properties. These materials exhibit high impact resistance, making them ideal for applications requiring durability. In the electrical and electronic sectors, polycarbonates are extensively used due to their additional benefits. In the electronics industry, polycarbonates find applications in manufacturing components such as connectors, insulators, and housings for devices like computers, printers, cameras, and mobile phones. Moreover, their transparency and durability make them suitable for LED lighting. The electrical sector utilizes polycarbonates for producing electrical enclosures, switchgear components, and parts for power distribution systems. The material's ability to withstand high temperatures and its excellent electrical insulation properties make it a preferred choice for these applications.
According to recent industry reports, the adoption of polycarbonate plastics in the electrical and electronic sectors has increased by approximately 18%. Furthermore, industry experts anticipate a growth of around 25% in the demand for these materials in the coming years. These trends highlight the continuous evolution and expanding applications of polycarbonate plastics in these sectors. Polycarbonate's versatile properties, including its high molecular weight, dimensional stability, and chemical resistance, contribute to its widespread usage. Its birefringence and optical clarity make it suitable for various applications in the automotive, construction, and packaging industries as well. Additionally, its thermal stability and flexural modulus enhance its appeal for various engineering applications.
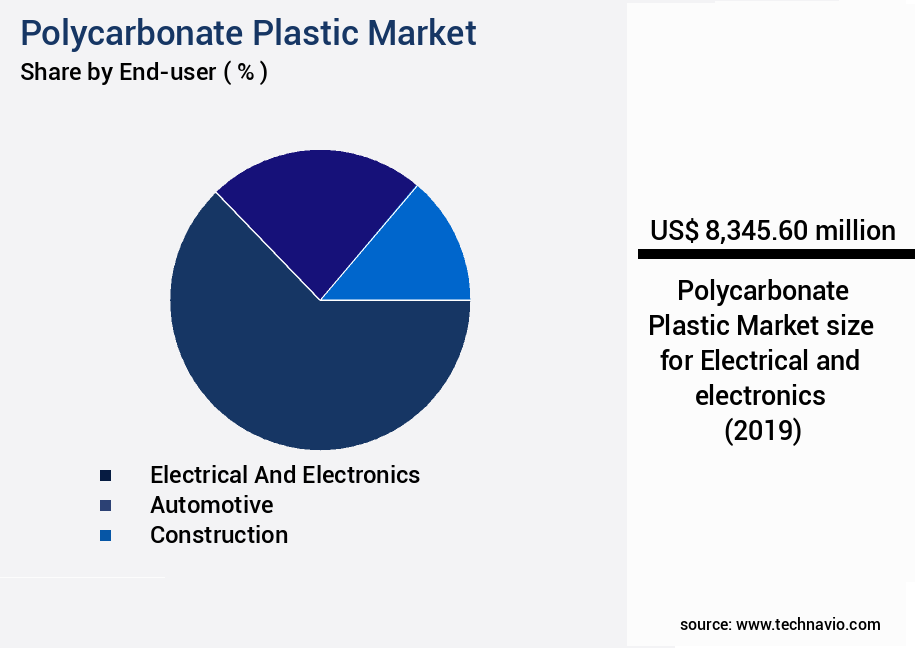
The Electrical and electronics segment was valued at USD 8.35 billion in 2019 and showed a gradual increase during the forecast period.
The manufacturing process for polycarbonate plastics involves sheet extrusion, processing parameters optimization, and quality control measures to ensure consistent product performance. Degradation pathways and manufacturing defects, such as stress cracking and reinforcement fibers, are closely monitored to maintain the material's integrity. Polycarbonate's sustainability metrics, including its recycling process and eco-friendly production methods, further underscore its appeal to businesses seeking eco-conscious solutions. Despite its numerous advantages, polycarbonate plastics face challenges such as hydrolysis resistance and flammability rating, which are being addressed through ongoing research and development efforts. In conclusion, the electrical and electronic sectors' increasing demand for polycarbonate plastics is driven by their unique properties and versatility.
As businesses continue to explore innovative applications for these materials, the market is expected to grow, offering significant opportunities for growth and expansion.
Regional Analysis
APAC is estimated to contribute 62% to the growth of the global market during the forecast period.Technavio's analysts have elaborately explained the regional trends and drivers that shape the market during the forecast period.
See How Polycarbonate Plastic Market Demand is Rising in APAC Request Free Sample
The APAC region dominates the market, accounting for a significant market share in 2024. Major industries driving the demand for polycarbonate plastics in this region include automotive, construction, aerospace, agriculture, electrical, and electronics. APAC's economic growth over the past decade has fueled the automotive sector's expansion, leading to increased demand from automotive manufacturers. China, Japan, and India are major contributors to this demand. In the construction sector, polycarbonate plastics are used for roofing, cladding, and insulation, while in the electrical and electronics industries, they are utilized for insulation, connectors, and transformer housings.
The automotive industry's demand for lightweight and durable materials is a significant factor driving the market's growth. Additionally, the construction sector's focus on energy efficiency and sustainability is increasing the adoption of polycarbonate plastics for insulation and cladding applications.
Market Dynamics
Our researchers analyzed the data with 2024 as the base year, along with the key drivers, trends, and challenges. A holistic analysis of drivers will help companies refine their marketing strategies to gain a competitive advantage.
The global polycarbonate materials market is steadily evolving as industries demand high-performance plastics with superior mechanical and optical properties. Polycarbonate sheet thickness tolerances and polycarbonate injection molding cycle times are key parameters influencing manufacturing efficiency, while polycarbonate film surface imperfections require advanced inspection systems to ensure quality consistency. Long-term durability is often shaped by polycarbonate degradation by UV exposure and polycarbonate hydrolysis resistance at high temperature, driving the need for improved stabilization additives. Mechanical reliability is assessed through polycarbonate tensile strength variations and polycarbonate flexural strength testing standards, both of which are critical for structural applications.
Comparative studies indicate that optimizing polycarbonate melt flow index determination and polycarbonate resin viscosity measurement can improve processing control by over 17.6% in high-volume production environments. Similarly, polycarbonate molecular weight distribution analysis directly impacts performance, while polycarbonate birefringence compensation techniques are essential in optical-grade applications. Advances in polycarbonate stress cracking resistance improvement and polycarbonate surface treatment for improved adhesion demonstrate measurable progress in extending service life and expanding application scope.
Additional focus areas include polycarbonate flammability UL ratings and standards, polycarbonate chemical resistance testing methods, and polycarbonate recycling challenges and solutions, all of which support compliance and sustainability initiatives. Polycarbonate additive compatibility evaluation and polycarbonate color matching and stability enhance aesthetic and functional integration, while polycarbonate reinforcement fiber orientation effects and polycarbonate composite material mechanical properties provide new opportunities in lightweight, high-strength components. Finally, polycarbonate manufacturing defect detection methods are becoming critical to quality assurance, underscoring the continuous advancements shaping the future of this versatile polymer.
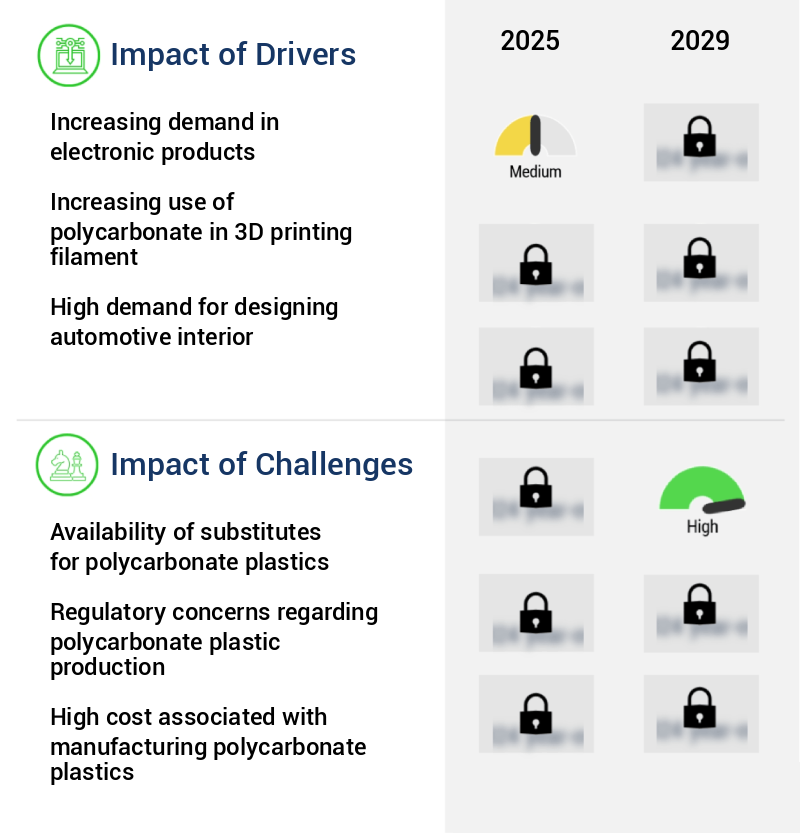
What are the key market drivers leading to the rise in the adoption of Polycarbonate Plastic Industry?
- The escalating demand for electronic products serves as the primary market catalyst.
- Polycarbonate plastics have emerged as a preferred choice in various industries due to their unique properties. In the automotive sector, these plastics are increasingly used for their lightweight nature, superior impact resistance, and design versatility. Simultaneously, the electronics industry has witnessed a significant rise in the adoption of polycarbonates for components and housings. The thermal properties of these plastics make them ideal for electronic devices, which generate heat. Polycarbonates maintain their structural integrity at elevated temperatures, preventing deformation or loss of clarity. Moreover, polycarbonates offer excellent optical clarity, making them suitable for applications requiring visibility or light transmission, such as screens, lenses, and display panels.
- Their ability to be molded into intricate shapes and sizes is crucial in the manufacturing of electronic devices, where efficient space utilization is essential. By presenting these benefits, polycarbonate plastics have become indispensable in numerous industries, continually unfolding new applications and patterns.
What are the market trends shaping the Polycarbonate Plastic Industry?
- The trend in the roofing market is shifting towards increased adoption of polycarbonate plastic. This material is gaining popularity due to its numerous benefits.
- Polycarbonate plastic has become a preferred choice in roofing applications due to its unique properties. Its high transparency allows natural light penetration, making it ideal for structures where daylight is essential, such as greenhouses, conservatories, and covered walkways. Moreover, polycarbonate sheets are highly resistant to impact, ensuring protection against hail or falling branches. Compared to glass, they are less prone to breakage, enhancing safety and durability. Polycarbonate's versatility is evident in its ease of shaping and molding. It comes in various profiles, enabling architectural customization. The material's adaptability and robustness have led to its widespread adoption in various industries, including construction, automotive, and solar energy.
- The market for polycarbonate roofing continues to evolve, with ongoing research and development focusing on enhancing its properties, such as thermal insulation and UV protection. Polycarbonate's adoption rates have surpassed those of traditional roofing materials in specific applications due to its superior performance and cost-effectiveness. Its flexibility in design and manufacturing processes has led to increased competition among suppliers, driving innovation and growth within the industry. The market's continuous expansion is a testament to polycarbonate's versatility and suitability for a wide range of applications.
What challenges does the Polycarbonate Plastic Industry face during its growth?
- The growth of the polycarbonate plastics industry is significantly influenced by the limited availability of viable substitutes.
- In the dynamic world of materials substitution, acrylic and polyethylene terephthalate (PET) emerge as significant alternatives to polycarbonate plastics in various applications. Acrylic, recognized for its transparency and impact resistance, serves as an optimal substitute in applications demanding optical clarity and moderate impact strength, such as glazing, signage, and displays. Conversely, PET, known for its versatility, transparency, toughness, and recyclability, is commonly used in packaging, fibers, and electronic components as a polycarbonate substitute.
- In specific instances where high optical clarity and scratch resistance are indispensable, glass becomes a viable substitute for polycarbonate. These substitutes cater to the evolving market demands, offering alternatives with distinct properties to meet various application requirements.
Exclusive Customer Landscape
The polycarbonate plastic market forecasting report includes the adoption lifecycle of the market, covering from the innovator's stage to the laggard's stage. It focuses on adoption rates in different regions based on penetration. Furthermore, the polycarbonate plastic market report also includes key purchase criteria and drivers of price sensitivity to help companies evaluate and develop their market growth analysis strategies.
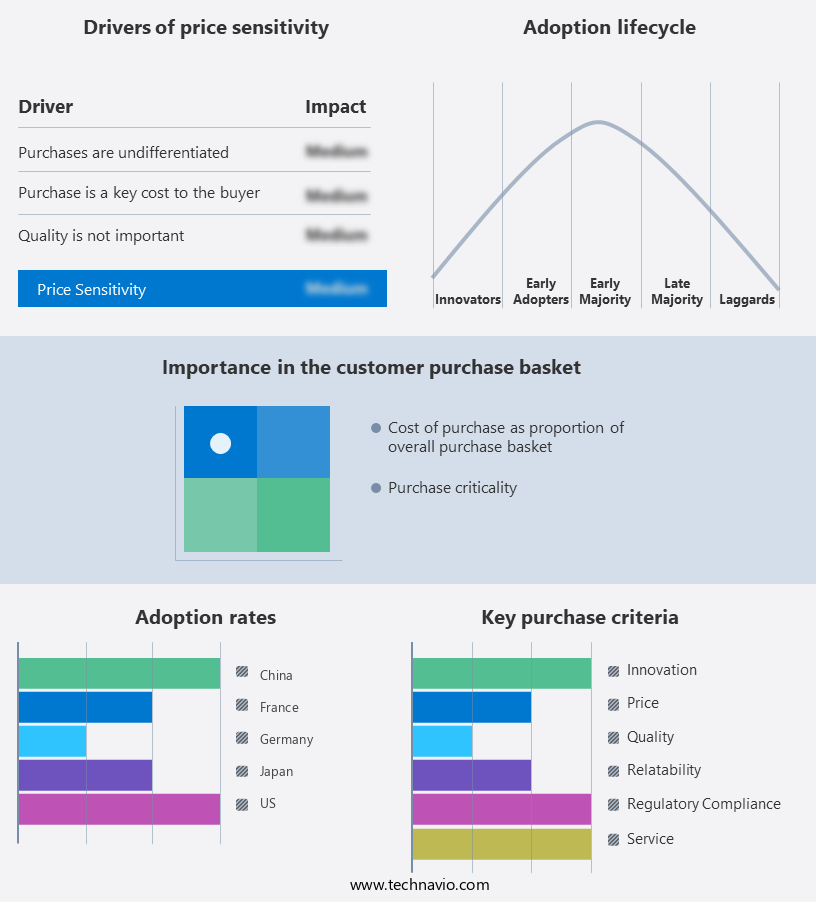
Customer Landscape of Polycarbonate Plastic Industry
Competitive Landscape & Market Insights
Companies are implementing various strategies, such as strategic alliances, polycarbonate plastic market forecast, partnerships, mergers and acquisitions, geographical expansion, and product/service launches, to enhance their presence in the industry.
AGC Inc. - The company specializes in the production and distribution of high-performance polycarbonate plastics, including CARBOGLASS and TWINCARBO.
The industry research and growth report includes detailed analyses of the competitive landscape of the market and information about key companies, including:
- AGC Inc.
- The Asahi Shimbun Co.
- BASF SE
- Centroplast Engineering Plastics GmbH.
- Chimei Corp.
- Covestro AG
- Entec Polymers
- Formosa Chemicals and Fibre Corporation
- Idemitsu Kosan Co. Ltd.
- INEOS Styrolution Group GmbH
- Lanxess AG
- LG Electronics Inc.
- Lotte Chemical Corp.
- Mitsubishi Gas Chemical Co. Inc.
- Peerless Plastics and Coatings Limited
- Rohm GmbH
- RTP Co.
- Saudi Basic Industries Corp.
- Teijin Ltd.
- Trinseo PLC
Qualitative and quantitative analysis of companies has been conducted to help clients understand the wider business environment as well as the strengths and weaknesses of key industry players. Data is qualitatively analyzed to categorize companies as pure play, category-focused, industry-focused, and diversified; it is quantitatively analyzed to categorize companies as dominant, leading, strong, tentative, and weak.
Recent Development and News in Polycarbonate Plastic Market
- In January 2024, Covestro AG, a leading global polycarbonate producer, announced the launch of its new Makrolon® Rx2 product line, which offers enhanced optical clarity and improved impact resistance for the automotive industry (Covestro press release, 2024).
- In March 2024, BASF SE and SABIC signed a strategic collaboration agreement to explore the production of polycarbonate from renewable feedstocks, aiming to reduce the carbon footprint of this material (BASF press release, 2024).
- In May 2024, Solvay SA completed the acquisition of Dicrax SAS, a French company specializing in the production of polycarbonate resins for the automotive and building & construction industries, expanding Solvay's polycarbonate business (Solvay press release, 2024).
- In February 2025, Eastman Chemical Company received approval from the U.S. Food and Drug Administration (FDA) for its Tritan™ copolyester, a polycarbonate alternative, to be used in food contact applications, broadening its market reach (Eastman press release, 2025).
Dive into Technavio's robust research methodology, blending expert interviews, extensive data synthesis, and validated models for unparalleled Polycarbonate Plastic Market insights. See full methodology.
|
Market Scope |
|
|
Report Coverage |
Details |
|
Page number |
229 |
|
Base year |
2024 |
|
Historic period |
2019-2023 |
|
Forecast period |
2025-2029 |
|
Growth momentum & CAGR |
Accelerate at a CAGR of 6.1% |
|
Market growth 2025-2029 |
USD 6207.4 million |
|
Market structure |
Fragmented |
|
YoY growth 2024-2025(%) |
5.6 |
|
Key countries |
US, Canada, Germany, UK, Italy, France, China, India, Japan, Brazil, Egypt, UAE, Oman, Argentina, KSA, UAE, Brazil, and Rest of World (ROW) |
|
Competitive landscape |
Leading Companies, Market Positioning of Companies, Competitive Strategies, and Industry Risks |
Research Analyst Overview
- The global polycarbonate market is expanding as industries increasingly leverage its versatility as a high-performance plastic with broad engineering applications. Optical grade polycarbonate is widely utilized in glazing, displays, and precision lenses due to its superior polycarbonate optical properties and clarity, while polycarbonate scratch resistance and polycarbonate weathering resistance enhance durability for outdoor and automotive uses. Polycarbonate automotive parts and polycarbonate medical devices illustrate the material's adaptability, meeting stringent requirements for strength, biocompatibility, and reliability.
- Comparative evaluations show that polycarbonate extrusion dies and polycarbonate mold design, when optimized, can improve production efficiency by more than 18.2%, supporting cost-effective manufacturing. Polycarbonate part finishing techniques further enhance end-use quality, while polycarbonate recycling methods, polycarbonate waste management, and polycarbonate life cycle assessment are central to sustainability strategies. Amorphous thermoplastic polymer properties enable flexibility in processing, while polycarbonate electronic components highlight growing demand in the electronics sector where insulation, transparency, and toughness are critical.
- Material performance is consistently benchmarked through polycarbonate mechanical properties, polycarbonate thermal properties, and polycarbonate chemical properties, all of which guide polycarbonate material selection criteria for diverse applications. Polycarbonate material costs are carefully weighed against long-term benefits, while polycarbonate design for manufacturing and polycarbonate durability testing ensure product reliability across multiple life stages. Regulatory priorities drive adherence to polycarbonate material certifications and polycarbonate regulatory compliance, reinforcing trust and market acceptance. With increasing focus on polycarbonate product lifecycle management, industries are aligning innovation with sustainability and compliance, further positioning polycarbonate as a cornerstone material in advanced manufacturing.
What are the Key Data Covered in this Polycarbonate Plastic Market Research and Growth Report?
-
What is the expected growth of the Polycarbonate Plastic Market between 2025 and 2029?
-
USD 6.21 billion, at a CAGR of 6.1%
-
-
What segmentation does the market report cover?
-
The report segmented by End-user (Electrical and electronics, Automotive, Construction, and Others), Channel (Direct sale and Indirect sale), Grade Type (Standard purpose grade, Flame retardant grade, Medical grade, Food grade, and Others), and Geography (APAC, Europe, North America, South America, and Middle East and Africa)
-
-
Which regions are analyzed in the report?
-
APAC, Europe, North America, South America, and Middle East and Africa
-
-
What are the key growth drivers and market challenges?
-
Increasing demand in electronic products, Availability of substitutes for polycarbonate plastics
-
-
Who are the major players in the Polycarbonate Plastic Market?
-
Key Companies AGC Inc., The Asahi Shimbun Co., BASF SE, Centroplast Engineering Plastics GmbH., Chimei Corp., Covestro AG, Entec Polymers, Formosa Chemicals and Fibre Corporation, Idemitsu Kosan Co. Ltd., INEOS Styrolution Group GmbH, Lanxess AG, LG Electronics Inc., Lotte Chemical Corp., Mitsubishi Gas Chemical Co. Inc., Peerless Plastics and Coatings Limited, Rohm GmbH, RTP Co., Saudi Basic Industries Corp., Teijin Ltd., and Trinseo PLC
-
Market Research Insights
- The market encompasses the production, application, and innovation of this high-performance amorphous thermoplastic polymer. With a global market size projected to reach USD25 billion by 2026, polycarbonate's growth trajectory underscores its significance in various industries. In the automotive sector, polycarbonate parts account for over 10% of the total market share due to their lightweight and robust properties. Meanwhile, in the electronics industry, polycarbonate electronic components represent a growing segment, driven by their excellent chemical resistance and thermal properties. Despite regulatory compliance challenges and the need for waste management solutions, polycarbonate's versatility in mold design, part finishing, and recycling methods ensures its continued relevance.
- Its weathering resistance, scratch resistance, and optical properties further expand its applications in glazing, medical devices, and engineering plastics. The material's durability and mechanical properties make it an indispensable choice for numerous industries, fostering a dynamic and evolving market landscape.
We can help! Our analysts can customize this polycarbonate plastic market research report to meet your requirements.
 RIA -
RIA - 
