Physical AI And Robotics-as-a-service Market Analysis, Size, and Forecast 2026-2030: North America (US, Canada, and Mexico), APAC (China, Japan, and India), Europe (Germany, UK, and France), South America (Brazil, Argentina, and Colombia), Middle East and Africa (Saudi Arabia, UAE, and South Africa), and Rest of World (ROW)

Physical AI And Robotics-as-a-service Market Analysis, Size, and Forecast 2026-2030:
North America (US, Canada, and Mexico), APAC (China, Japan, and India), Europe (Germany, UK, and France), South America (Brazil, Argentina, and Colombia), Middle East and Africa (Saudi Arabia, UAE, and South Africa), and Rest of World (ROW)

Published: Mar 2026 291 Pages SKU: IRTNTR81358

Market Overview at a Glance

$21.24 B
Market Opportunity
30.8%
CAGR 2025 - 2030
35.2%
North America Growth
$3.99 B
Physical AI segment 2024

Physical AI And Robotics-as-a-service Market Size 2026-2030

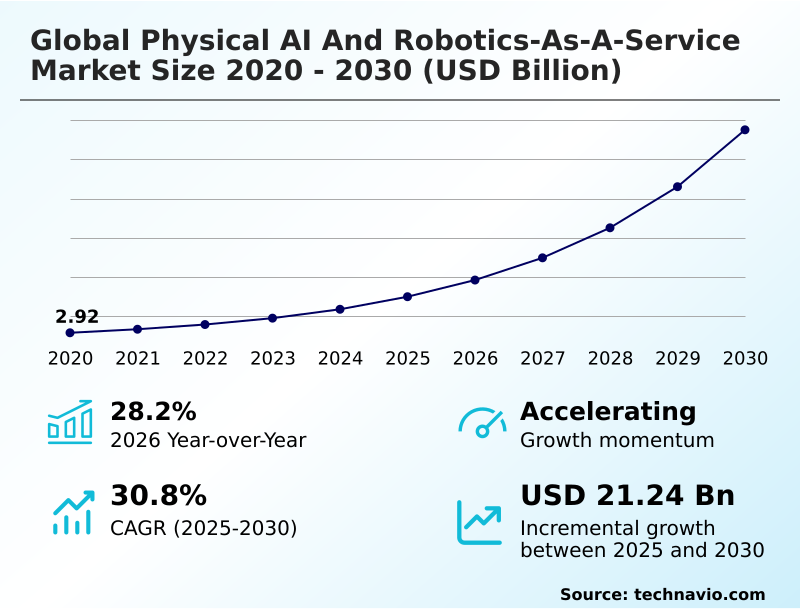
The physical ai and robotics-as-a-service market size is valued to increase by USD 21.24 billion, at a CAGR of 30.8% from 2025 to 2030. Proliferation of generative physical intelligence will drive the physical ai and robotics-as-a-service market.

Major Market Trends & Insights

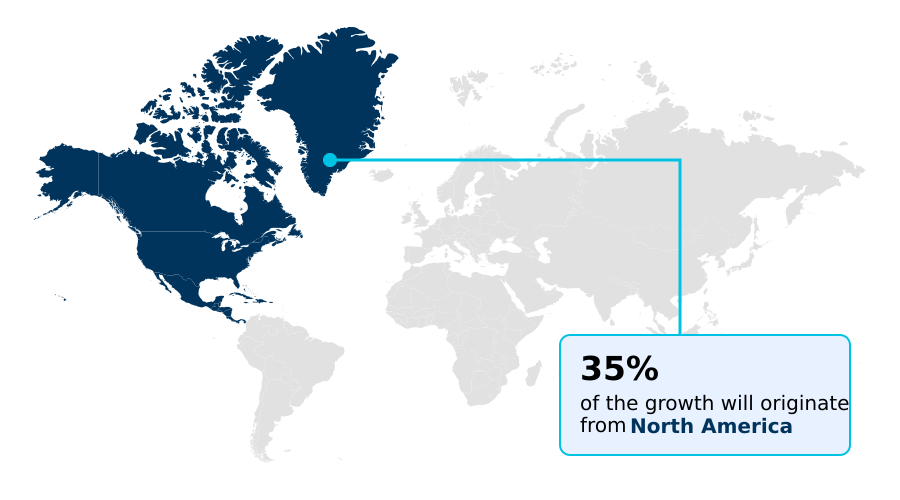
  • North America dominated the market and accounted for a 35.2% growth during the forecast period.
  • By Solution - Physical AI segment was valued at USD 3.99 billion in 2024
  • By Application - Logistics and warehousing segment accounted for the largest market revenue share in 2024

Market Size & Forecast

  • Market Opportunities: USD 25.83 billion
  • Market Future Opportunities: USD 21.24 billion
  • CAGR from 2025 to 2030 : 30.8%

Market Summary

  • The physical AI and robotics-as-a-service market is defined by the shift from capital-intensive hardware ownership to flexible, subscription-based robotics models. This evolution is propelled by the integration of advanced physical AI algorithms that enable autonomous mobile robots to perceive, learn, and navigate complex, real-world environments.
  • Key trends include the push for interoperability standards to allow for seamless human-robot collaboration and the use of AI for supply chain resilience. For instance, a logistics company can leverage robotics-as-a-service for SMEs to dynamically scale its fleet during peak seasons, deploying additional robotic picking and sorting units to meet demand without long-term capital commitment, thus improving operational efficiency.
  • However, the industry grapples with challenges such as high initial integration costs and a persistent talent deficit for managing these sophisticated systems. The convergence of cloud robotics platforms and edge computing is essential for enabling real-time decision-making, which is critical for applications in manufacturing and healthcare.

What will be the Size of the Physical AI And Robotics-as-a-service Market during the forecast period?

Get Key Insights on Market Forecast (PDF) Request Free Sample

How is the Physical AI And Robotics-as-a-service Market Segmented?

The physical ai and robotics-as-a-service industry research report provides comprehensive data (region-wise segment analysis), with forecasts and estimates in "USD million" for the period 2026-2030, as well as historical data from 2020-2024 for the following segments.

  • Solution
    • Physical AI
    • Robotics-as-a-Service
    • Integration and support services
  • Application
    • Logistics and warehousing
    • Manufacturing and assembly
    • Service and healthcare
  • End-user
    • Large enterprises
    • SMEs
  • Geography
    • North America
      • US
      • Canada
      • Mexico
    • APAC
      • China
      • Japan
      • India
    • Europe
      • Germany
      • UK
      • France
    • South America
      • Brazil
      • Argentina
      • Colombia
    • Middle East and Africa
      • Saudi Arabia
      • UAE
      • South Africa
    • Rest of World (ROW)

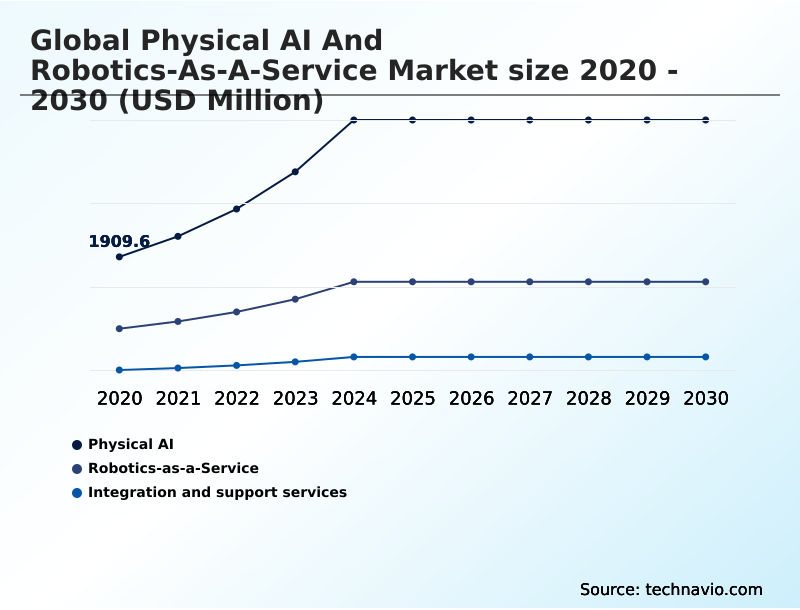
By Solution Insights

The physical ai segment is estimated to witness significant growth during the forecast period.

The physical AI segment is defined by the integration of advanced neural networks and proprietary physical ai algorithms directly into robotic hardware, creating intelligent hardware systems capable of autonomous operation.

This includes ai-enabled robotic solutions with sophisticated components such as high-performance neural processing units, advanced actuators, and specialized tactile sensing capabilities that facilitate real-time environmental perception.

The evolution of ai-orchestrated robotic systems is driven by the need for machines to navigate unstructured environments, using technologies like visual simultaneous localization and mapping to enable fluid interaction.

These collaborative robotic arms and mobile platforms utilize end-to-end neural network control for responsive decision-making.

As a result, deployments of this technology have demonstrated an 18% improvement in task completion rates in dynamic settings, pushing the boundaries of multi-robot fleet management and robotic perception technology.

Request Free Sample

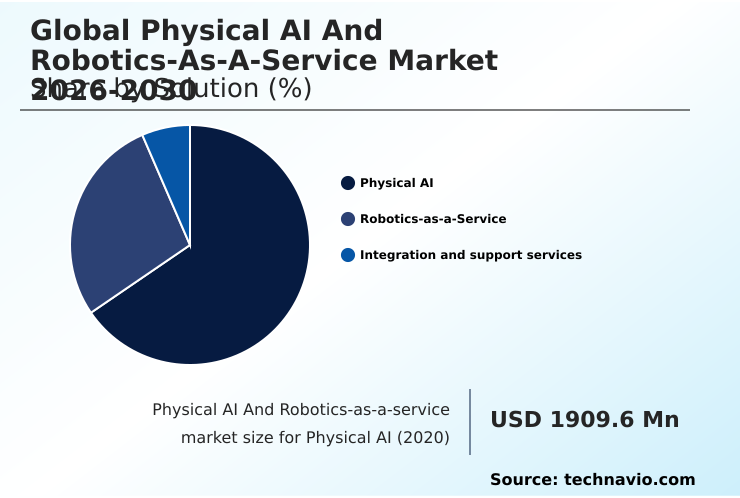
The Physical AI segment was valued at USD 3.99 billion in 2024 and showed a gradual increase during the forecast period.

Request Free Sample

Regional Analysis

North America is estimated to contribute 35.2% to the growth of the global market during the forecast period.Technavio’s analysts have elaborately explained the regional trends and drivers that shape the market during the forecast period.

See How Physical AI And Robotics-as-a-service Market Demand is Rising in North America Request Free Sample

The geographic landscape of the physical AI market is dynamic, with North America and APAC emerging as the two dominant regions, collectively accounting for nearly 70% of the market's incremental growth.

North America, contributing 35.2% of this growth, leverages its mature venture capital ecosystem to pioneer advanced applications. In contrast, APAC's expansion is fueled by large-scale manufacturing and government-led automation initiatives.

Key applications driving adoption include autonomous mobile robots and robotic piece-picking solutions in logistics, where cloud robotics platforms enable sophisticated robot fleet orchestration.

In healthcare, the use of raas in healthcare for tasks like autonomous cleaning machines is growing, improving sanitation efficiency by over 40%.

The deployment of autonomous service robots, supported by cobot integration services and advanced robotic manipulation systems, is becoming standard in high-growth areas, with physical intelligence systems providing the necessary adaptability.

Market Dynamics

Our researchers analyzed the data with 2025 as the base year, along with the key drivers, trends, and challenges. A holistic analysis of drivers will help companies refine their marketing strategies to gain a competitive advantage.

  • The practical implementation of robotics-as-a-service for warehouse fulfillment is revolutionizing logistics, where subscription-based automation for smes allows smaller players to compete with established giants. The benefits of raas in supply chain management are clear, though organizations must still analyze the total cost of robotics-as-a-service implementation.
  • For instance, deploying ai-driven inventory scanning robots and solutions for autonomous mobile picking and sorting can increase order accuracy by over 98%. In manufacturing, the use of ai-enabled robotic systems for manufacturing, particularly collaborative robots in assembly lines, enhances precision and throughput.
  • The development of physical ai for unstructured environments and physical ai for last-mile delivery is expanding the technology's reach beyond controlled settings. This expansion relies on robust cloud management for autonomous mobile robots and advanced edge computing in physical ai to ensure low-latency performance. Key challenges include addressing physical ai and robotics-as-a-service security and solving the interoperability of mixed-fleet robotics.
  • As the technology matures, general-purpose humanoid robot applications are moving from pilot stages to active deployment, especially with humanoid robots for logistics automation and robotics-as-a-service for healthcare logistics, driven by sophisticated end-to-end neural network for control and addressing robotics-as-a-service market challenges.

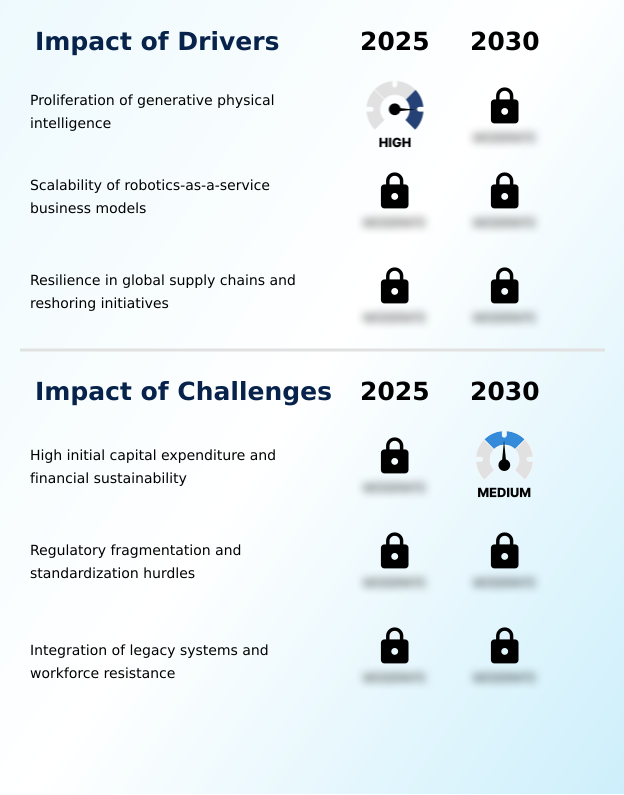
What are the key market drivers leading to the rise in the adoption of Physical AI And Robotics-as-a-service Industry?

  • The proliferation of generative physical intelligence, which enables machines to interpret and execute complex tasks in unstructured environments, is the primary driver for market growth.

  • The market's primary driver is the proliferation of generative physical intelligence, which enables embodied artificial intelligence to perform complex, non-repetitive tasks. This technological leap makes advanced physical AI applications viable across industries.
  • The robotics-as-a-service model is a powerful accelerator, as its subscription-based robotics framework and flexible raas business models can lower market entry costs by over 50% for SMEs.
  • This financial accessibility drives the adoption of ai-powered fulfillment solutions, autonomous warehouse automation, and specialized humanoid robots in manufacturing, where industrial robot subscriptions provide scalability. The ability of these systems to facilitate real-time decision-making allows for unprecedented operational agility.
  • As a result, companies leveraging raas for SMEs report productivity gains of up to 30% within the first year of deployment, cementing the model's role in democratizing access to high-end automation.

What are the market trends shaping the Physical AI And Robotics-as-a-service Industry?

  • The market is increasingly shaped by the emergence of edge-native orchestration, reflecting a broader trend toward decentralized robot intelligence.

  • Key trends are reshaping the market, led by the shift toward edge-native orchestration and decentralized robot intelligence. This move to edge AI for robotics addresses critical latency issues in high-speed environments, reducing data processing delays by over 60% compared to purely cloud-based systems.
  • Concurrently, the push for open-ecosystem orchestration and robust robotics middleware solutions is breaking down proprietary barriers, allowing for greater interoperability. This evolution toward software-defined manufacturing supports mixed-fleet deployments, which can improve overall operational efficiency by 20%. Furthermore, the integration of robot lifecycle management and stringent raas security frameworks is becoming standard.
  • Innovations in generative AI in robotics are enhancing human-robot interaction safety, while the use of AI for supply chain resilience and ai-driven data capture provides businesses with unprecedented visibility and predictive capabilities, ensuring more sustainable and secure automated operations.

What challenges does the Physical AI And Robotics-as-a-service Industry face during its growth?

  • High initial capital expenditure for advanced hardware and the challenge of ensuring long-term financial sustainability remain significant barriers to market adoption.

  • Despite strong drivers, the market faces significant challenges, primarily the high initial capital expenditure and raas deployment challenges associated with hardware and integration. Integrating new platforms with legacy systems often results in technical debt and requires extensive enterprise resource planning integration, which can increase project timelines by up to 40%. A growing talent deficit for robotics management further complicates adoption.
  • Another major hurdle is regulatory fragmentation; the lack of universal interoperability standards creates compliance burdens and hinders scalability, as providers must navigate disparate rules across key jurisdictions. This uncertainty, coupled with concerns over hardware obsolescence and the rapid cash-burn rates of startups, creates a challenging investment landscape that can slow the pace of innovation and widespread market adoption.

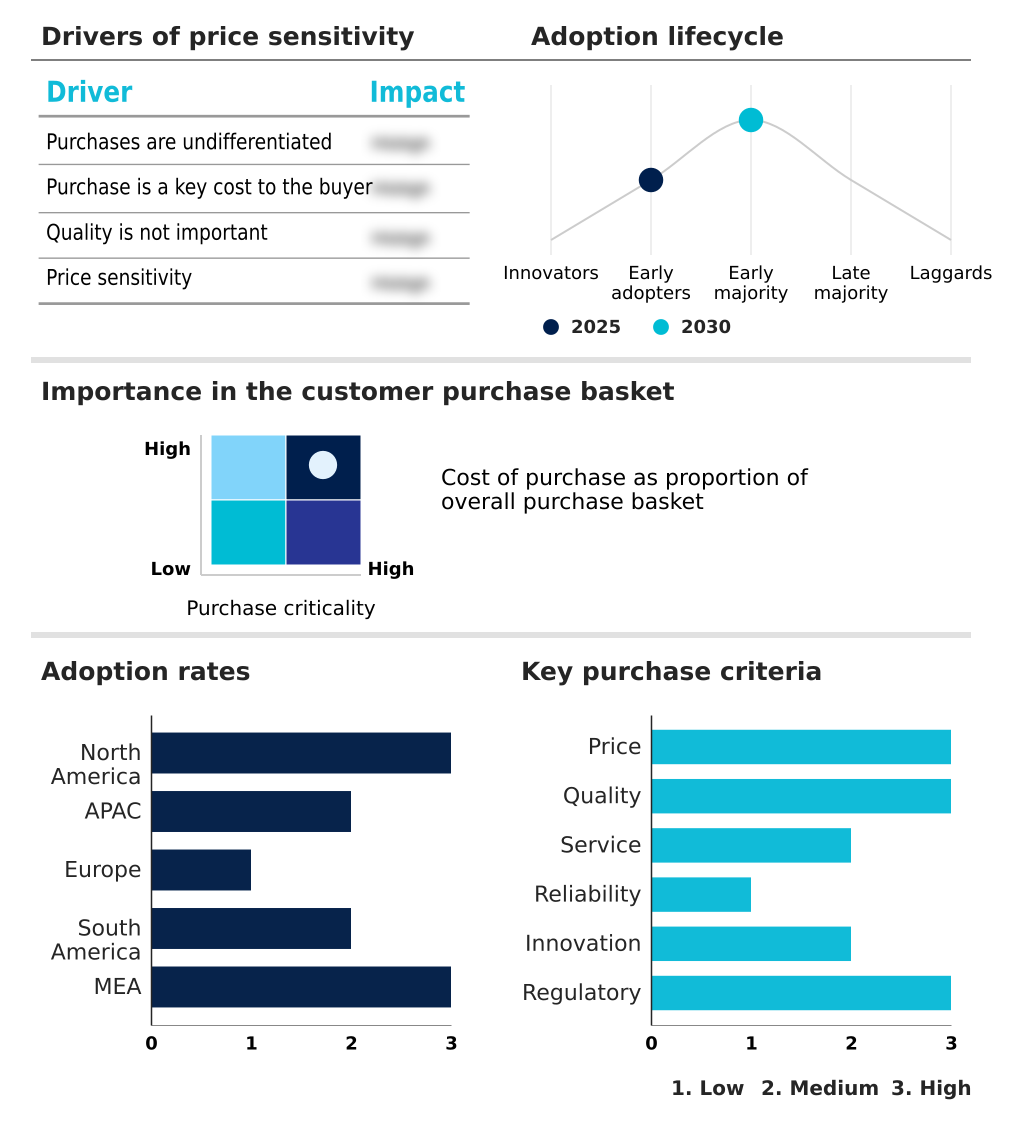
Exclusive Technavio Analysis on Customer Landscape

The physical ai and robotics-as-a-service market forecasting report includes the adoption lifecycle of the market, covering from the innovator’s stage to the laggard’s stage. It focuses on adoption rates in different regions based on penetration. Furthermore, the physical ai and robotics-as-a-service market report also includes key purchase criteria and drivers of price sensitivity to help companies evaluate and develop their market growth analysis strategies.

Customer Landscape of Physical AI And Robotics-as-a-service Industry

Competitive Landscape

Companies are implementing various strategies, such as strategic alliances, physical ai and robotics-as-a-service market forecast, partnerships, mergers and acquisitions, geographical expansion, and product/service launches, to enhance their presence in the industry.

Agility Robotics Inc. - Offers advanced Isaac simulation platforms and edge AI hardware to train embodied agents, accelerating development in physical AI and robotics-as-a-service.

The industry research and growth report includes detailed analyses of the competitive landscape of the market and information about key companies, including:

  • Agility Robotics Inc.
  • Bear Robotics, Inc.
  • Berkshire Grey
  • Boston Dynamics Inc.
  • Brain Corp.
  • Covariant
  • Figure AI
  • Formant
  • Geekplus Technology Co. Ltd.
  • IFS
  • inVia Robotics Inc.
  • Locus Robotics Corp.
  • NVIDIA Corp.
  • Qualcomm Inc.
  • RightHand Robotics Inc.
  • Symbotic Inc.
  • Tesla Inc.
  • UBTECH ROBOTICS CORP LTD
  • Universal Robots AS
  • Zebra Technologies Corp.

Qualitative and quantitative analysis of companies has been conducted to help clients understand the wider business environment as well as the strengths and weaknesses of key industry players. Data is qualitatively analyzed to categorize companies as pure play, category-focused, industry-focused, and diversified; it is quantitatively analyzed to categorize companies as dominant, leading, strong, tentative, and weak.

Recent Development and News in Physical ai and robotics-as-a-service market

  • In October 2024, SoftBank Group announced a definitive agreement to acquire the industrial robotics division of ABB for approximately USD 5.4 billion, signaling a major consolidation in the physical AI ecosystem.
  • In November 2024, CynLr, a robotics startup, successfully closed a USD 10 million Series A funding round to advance its visual object-intelligence systems for robotic perception and manipulation.
  • In February 2025, Apptronik secured USD 350 million in a funding round to scale up the production of its Apollo humanoid robot, designed for material handling and manufacturing assistance.
  • In March 2025, Dexterity AI raised approximately USD 95 million in funding to scale its robotic manipulation systems for complex warehouse automation tasks, reaching a valuation of nearly USD 1.65 billion.

Dive into Technavio’s robust research methodology, blending expert interviews, extensive data synthesis, and validated models for unparalleled Physical AI And Robotics-as-a-service Market insights. See full methodology.

Market Scope
Page number 291
Base year 2025
Historic period 2020-2024
Forecast period 2026-2030
Growth momentum & CAGR Accelerate at a CAGR of 30.8%
Market growth 2026-2030 USD 21239.5 million
Market structure Fragmented
YoY growth 2025-2026(%) 28.2%
Key countries US, Canada, Mexico, China, Japan, India, South Korea, Australia, Indonesia, Germany, UK, France, Italy, The Netherlands, Spain, Brazil, Argentina, Colombia, Saudi Arabia, UAE, South Africa, Israel and Turkey
Competitive landscape Leading Companies, Market Positioning of Companies, Competitive Strategies, and Industry Risks

Request Free Sample

Research Analyst Overview

  • The physical AI and robotics-as-a-service market is fundamentally reshaping industrial automation through embodied artificial intelligence. At its core, the robotics-as-a-service model leverages subscription-based robotics to deploy intelligent hardware systems powered by advanced physical ai algorithms. This is enabled by technologies like autonomous navigation software and cloud-based robot management, allowing for sophisticated multi-robot fleet management.
  • The hardware itself, from collaborative robotic arms to fully autonomous mobile robots and autonomous ground vehicles, relies on neural processing units and tactile sensing capabilities for real-time decision-making and human-robot collaboration. The trend toward open-ecosystem orchestration is a critical boardroom consideration, as it mitigates vendor lock-in and can improve integration efficiency by 40% when connecting heterogeneous robotic ecosystems.
  • Innovations in ai-enabled robotic solutions, including humanoid robot development and ai-orchestrated robotic systems, are driven by deep learning techniques such as sim-to-real transfer learning and reinforcement learning for robotics.
  • This convergence of software-defined manufacturing and advanced robotic perception technology, which uses visual simultaneous localization and mapping and proprioceptive feedback systems, is creating a new paradigm of operational efficiency, supported by ai-driven predictive maintenance and end-to-end neural network control.

What are the Key Data Covered in this Physical AI And Robotics-as-a-service Market Research and Growth Report?

  • What is the expected growth of the Physical AI And Robotics-as-a-service Market between 2026 and 2030?

    • USD 21.24 billion, at a CAGR of 30.8%

  • What segmentation does the market report cover?

    • The report is segmented by Solution (Physical AI, Robotics-as-a-Service, and Integration and support services), Application (Logistics and warehousing, Manufacturing and assembly, and Service and healthcare), End-user (Large enterprises, and SMEs) and Geography (North America, APAC, Europe, South America, Middle East and Africa)

  • Which regions are analyzed in the report?

    • North America, APAC, Europe, South America and Middle East and Africa

  • What are the key growth drivers and market challenges?

    • Proliferation of generative physical intelligence, High initial capital expenditure and financial sustainability

  • Who are the major players in the Physical AI And Robotics-as-a-service Market?

    • Agility Robotics Inc., Bear Robotics, Inc., Berkshire Grey, Boston Dynamics Inc., Brain Corp., Covariant, Figure AI, Formant, Geekplus Technology Co. Ltd., IFS, inVia Robotics Inc., Locus Robotics Corp., NVIDIA Corp., Qualcomm Inc., RightHand Robotics Inc., Symbotic Inc., Tesla Inc., UBTECH ROBOTICS CORP LTD, Universal Robots AS and Zebra Technologies Corp.

Market Research Insights

  • The physical AI and robotics-as-a-service market is driven by flexible raas business models that democratize access to advanced automation, with robotics-as-a-service pricing structures that reduce total cost of ownership by up to 35% for many organizations, especially raas for smes.
  • Key physical ai applications in logistics and autonomous warehouse automation are being transformed by ai-powered fulfillment solutions and specialized humanoid robots in manufacturing. The use of cobot integration services and advanced robotic manipulation systems enables ai-based quality control, which can decrease defect rates by over 50%.
  • The sector's expansion into raas in healthcare and industrial robot subscriptions is supported by developments in cloud robotics platforms, edge ai for robotics, and robust robot fleet orchestration. Managing raas deployment challenges and ensuring human-robot interaction safety are critical, as are innovations in robotic piece-picking solutions, autonomous cleaning machines, and comprehensive robot lifecycle management through sophisticated robotics middleware solutions.

We can help! Our analysts can customize this physical ai and robotics-as-a-service market research report to meet your requirements.

Get in touch

1. Executive Summary

1.1 Market overview

Executive Summary - Chart on Market Overview
Executive Summary - Data Table on Market Overview
Executive Summary - Chart on Global Market Characteristics
Executive Summary - Chart on Market by Geography
Executive Summary - Chart on Market Segmentation by Solution
Executive Summary - Chart on Market Segmentation by Application
Executive Summary - Chart on Market Segmentation by End-user
Executive Summary - Chart on Incremental Growth
Executive Summary - Data Table on Incremental Growth
Executive Summary - Chart on Company Market Positioning

2. Technavio Analysis

2.1 Analysis of price sensitivity, lifecycle, customer purchase basket, adoption rates, and purchase criteria

2.2 Criticality of inputs and Factors of differentiation

Chart on Overview on criticality of inputs and factors of differentiation

2.3 Factors of disruption

Chart on Overview on factors of disruption

2.4 Impact of drivers and challenges

Chart on Impact of drivers and challenges in 2025 and 2030

3. Market Landscape

3.1 Market ecosystem

Chart on Parent Market
Data Table on - Parent Market

3.2 Market characteristics

Chart on Market characteristics analysis

3.3 Value chain analysis

Chart on Value chain analysis

4. Market Sizing

4.1 Market definition

Data Table on Offerings of companies included in the market definition

4.2 Market segment analysis

Market segments

4.3 Market size 2025

4.4 Market outlook: Forecast for 2025-2030

Chart on Global - Market size and forecast 2025-2030 ($ million)
Data Table on Global - Market size and forecast 2025-2030 ($ million)
Chart on Global Market: Year-over-year growth 2025-2030 (%)
Data Table on Global Market: Year-over-year growth 2025-2030 (%)

5. Historic Market Size

5.1 Global Physical AI And Robotics-As-A-Service Market 2020 - 2024

Historic Market Size - Data Table on Global Physical AI And Robotics-As-A-Service Market 2020 - 2024 ($ million)

5.2 Solution segment analysis 2020 - 2024

Historic Market Size - Solution Segment 2020 - 2024 ($ million)

5.3 Application segment analysis 2020 - 2024

Historic Market Size - Application Segment 2020 - 2024 ($ million)

5.4 End-user segment analysis 2020 - 2024

Historic Market Size - End-user Segment 2020 - 2024 ($ million)

5.5 Geography segment analysis 2020 - 2024

Historic Market Size - Geography Segment 2020 - 2024 ($ million)

5.6 Country segment analysis 2020 - 2024

Historic Market Size - Country Segment 2020 - 2024 ($ million)

6. Qualitative Analysis

6.1 Impact of AI on Global Physical AI and Robotics-as-a-Service market

6.2 Impact of Geopolitical Conflicts on Global Physical AI and Robotics-as-a-Service Market

7. Five Forces Analysis

7.1 Five forces summary

Five forces analysis - Comparison between 2025 and 2030

7.2 Bargaining power of buyers

Bargaining power of buyers - Impact of key factors 2025 and 2030

7.3 Bargaining power of suppliers

Bargaining power of suppliers - Impact of key factors in 2025 and 2030

7.4 Threat of new entrants

Threat of new entrants - Impact of key factors in 2025 and 2030

7.5 Threat of substitutes

Threat of substitutes - Impact of key factors in 2025 and 2030

7.6 Threat of rivalry

Threat of rivalry - Impact of key factors in 2025 and 2030

7.7 Market condition

Chart on Market condition - Five forces 2025 and 2030

8. Market Segmentation by Solution

8.1 Market segments

Chart on Solution - Market share 2025-2030 (%)
Data Table on Solution - Market share 2025-2030 (%)

8.2 Comparison by Solution

Chart on Comparison by Solution
Data Table on Comparison by Solution

8.3 Physical AI - Market size and forecast 2025-2030

Chart on Physical AI - Market size and forecast 2025-2030 ($ million)
Data Table on Physical AI - Market size and forecast 2025-2030 ($ million)
Chart on Physical AI - Year-over-year growth 2025-2030 (%)
Data Table on Physical AI - Year-over-year growth 2025-2030 (%)

8.4 Robotics-as-a-Service - Market size and forecast 2025-2030

Chart on Robotics-as-a-Service - Market size and forecast 2025-2030 ($ million)
Data Table on Robotics-as-a-Service - Market size and forecast 2025-2030 ($ million)
Chart on Robotics-as-a-Service - Year-over-year growth 2025-2030 (%)
Data Table on Robotics-as-a-Service - Year-over-year growth 2025-2030 (%)

8.5 Integration and support services - Market size and forecast 2025-2030

Chart on Integration and support services - Market size and forecast 2025-2030 ($ million)
Data Table on Integration and support services - Market size and forecast 2025-2030 ($ million)
Chart on Integration and support services - Year-over-year growth 2025-2030 (%)
Data Table on Integration and support services - Year-over-year growth 2025-2030 (%)

8.6 Market opportunity by Solution

Market opportunity by Solution ($ million)
Data Table on Market opportunity by Solution ($ million)

9. Market Segmentation by Application

9.1 Market segments

Chart on Application - Market share 2025-2030 (%)
Data Table on Application - Market share 2025-2030 (%)

9.2 Comparison by Application

Chart on Comparison by Application
Data Table on Comparison by Application

9.3 Logistics and warehousing - Market size and forecast 2025-2030

Chart on Logistics and warehousing - Market size and forecast 2025-2030 ($ million)
Data Table on Logistics and warehousing - Market size and forecast 2025-2030 ($ million)
Chart on Logistics and warehousing - Year-over-year growth 2025-2030 (%)
Data Table on Logistics and warehousing - Year-over-year growth 2025-2030 (%)

9.4 Manufacturing and assembly - Market size and forecast 2025-2030

Chart on Manufacturing and assembly - Market size and forecast 2025-2030 ($ million)
Data Table on Manufacturing and assembly - Market size and forecast 2025-2030 ($ million)
Chart on Manufacturing and assembly - Year-over-year growth 2025-2030 (%)
Data Table on Manufacturing and assembly - Year-over-year growth 2025-2030 (%)

9.5 Service and healthcare - Market size and forecast 2025-2030

Chart on Service and healthcare - Market size and forecast 2025-2030 ($ million)
Data Table on Service and healthcare - Market size and forecast 2025-2030 ($ million)
Chart on Service and healthcare - Year-over-year growth 2025-2030 (%)
Data Table on Service and healthcare - Year-over-year growth 2025-2030 (%)

9.6 Market opportunity by Application

Market opportunity by Application ($ million)
Data Table on Market opportunity by Application ($ million)

10. Market Segmentation by End-user

10.1 Market segments

Chart on End-user - Market share 2025-2030 (%)
Data Table on End-user - Market share 2025-2030 (%)

10.2 Comparison by End-user

Chart on Comparison by End-user
Data Table on Comparison by End-user

10.3 Large enterprises - Market size and forecast 2025-2030

Chart on Large enterprises - Market size and forecast 2025-2030 ($ million)
Data Table on Large enterprises - Market size and forecast 2025-2030 ($ million)
Chart on Large enterprises - Year-over-year growth 2025-2030 (%)
Data Table on Large enterprises - Year-over-year growth 2025-2030 (%)

10.4 SMEs - Market size and forecast 2025-2030

Chart on SMEs - Market size and forecast 2025-2030 ($ million)
Data Table on SMEs - Market size and forecast 2025-2030 ($ million)
Chart on SMEs - Year-over-year growth 2025-2030 (%)
Data Table on SMEs - Year-over-year growth 2025-2030 (%)

10.5 Market opportunity by End-user

Market opportunity by End-user ($ million)
Data Table on Market opportunity by End-user ($ million)

11. Customer Landscape

11.1 Customer landscape overview

Analysis of price sensitivity, lifecycle, customer purchase basket, adoption rates, and purchase criteria

12. Geographic Landscape

12.1 Geographic segmentation

Chart on Market share by geography 2025-2030 (%)
Data Table on Market share by geography 2025-2030 (%)

12.2 Geographic comparison

Chart on Geographic comparison
Data Table on Geographic comparison

12.3 North America - Market size and forecast 2025-2030

Chart on North America - Market size and forecast 2025-2030 ($ million)
Data Table on North America - Market size and forecast 2025-2030 ($ million)
Chart on North America - Year-over-year growth 2025-2030 (%)
Data Table on North America - Year-over-year growth 2025-2030 (%)
Chart on Regional Comparison - North America
Data Table on Regional Comparison - North America

12.3.1 US - Market size and forecast 2025-2030

Chart on US - Market size and forecast 2025-2030 ($ million)
Data Table on US - Market size and forecast 2025-2030 ($ million)
Chart on US - Year-over-year growth 2025-2030 (%)
Data Table on US - Year-over-year growth 2025-2030 (%)

12.3.2 Canada - Market size and forecast 2025-2030

Chart on Canada - Market size and forecast 2025-2030 ($ million)
Data Table on Canada - Market size and forecast 2025-2030 ($ million)
Chart on Canada - Year-over-year growth 2025-2030 (%)
Data Table on Canada - Year-over-year growth 2025-2030 (%)

12.3.3 Mexico - Market size and forecast 2025-2030

Chart on Mexico - Market size and forecast 2025-2030 ($ million)
Data Table on Mexico - Market size and forecast 2025-2030 ($ million)
Chart on Mexico - Year-over-year growth 2025-2030 (%)
Data Table on Mexico - Year-over-year growth 2025-2030 (%)

12.4 APAC - Market size and forecast 2025-2030

Chart on APAC - Market size and forecast 2025-2030 ($ million)
Data Table on APAC - Market size and forecast 2025-2030 ($ million)
Chart on APAC - Year-over-year growth 2025-2030 (%)
Data Table on APAC - Year-over-year growth 2025-2030 (%)
Chart on Regional Comparison - APAC
Data Table on Regional Comparison - APAC

12.4.1 China - Market size and forecast 2025-2030

Chart on China - Market size and forecast 2025-2030 ($ million)
Data Table on China - Market size and forecast 2025-2030 ($ million)
Chart on China - Year-over-year growth 2025-2030 (%)
Data Table on China - Year-over-year growth 2025-2030 (%)

12.4.2 Japan - Market size and forecast 2025-2030

Chart on Japan - Market size and forecast 2025-2030 ($ million)
Data Table on Japan - Market size and forecast 2025-2030 ($ million)
Chart on Japan - Year-over-year growth 2025-2030 (%)
Data Table on Japan - Year-over-year growth 2025-2030 (%)

12.4.3 India - Market size and forecast 2025-2030

Chart on India - Market size and forecast 2025-2030 ($ million)
Data Table on India - Market size and forecast 2025-2030 ($ million)
Chart on India - Year-over-year growth 2025-2030 (%)
Data Table on India - Year-over-year growth 2025-2030 (%)

12.4.4 South Korea - Market size and forecast 2025-2030

Chart on South Korea - Market size and forecast 2025-2030 ($ million)
Data Table on South Korea - Market size and forecast 2025-2030 ($ million)
Chart on South Korea - Year-over-year growth 2025-2030 (%)
Data Table on South Korea - Year-over-year growth 2025-2030 (%)

12.4.5 Australia - Market size and forecast 2025-2030

Chart on Australia - Market size and forecast 2025-2030 ($ million)
Data Table on Australia - Market size and forecast 2025-2030 ($ million)
Chart on Australia - Year-over-year growth 2025-2030 (%)
Data Table on Australia - Year-over-year growth 2025-2030 (%)

12.4.6 Indonesia - Market size and forecast 2025-2030

Chart on Indonesia - Market size and forecast 2025-2030 ($ million)
Data Table on Indonesia - Market size and forecast 2025-2030 ($ million)
Chart on Indonesia - Year-over-year growth 2025-2030 (%)
Data Table on Indonesia - Year-over-year growth 2025-2030 (%)

12.5 Europe - Market size and forecast 2025-2030

Chart on Europe - Market size and forecast 2025-2030 ($ million)
Data Table on Europe - Market size and forecast 2025-2030 ($ million)
Chart on Europe - Year-over-year growth 2025-2030 (%)
Data Table on Europe - Year-over-year growth 2025-2030 (%)
Chart on Regional Comparison - Europe
Data Table on Regional Comparison - Europe

12.5.1 Germany - Market size and forecast 2025-2030

Chart on Germany - Market size and forecast 2025-2030 ($ million)
Data Table on Germany - Market size and forecast 2025-2030 ($ million)
Chart on Germany - Year-over-year growth 2025-2030 (%)
Data Table on Germany - Year-over-year growth 2025-2030 (%)

12.5.2 UK - Market size and forecast 2025-2030

Chart on UK - Market size and forecast 2025-2030 ($ million)
Data Table on UK - Market size and forecast 2025-2030 ($ million)
Chart on UK - Year-over-year growth 2025-2030 (%)
Data Table on UK - Year-over-year growth 2025-2030 (%)

12.5.3 France - Market size and forecast 2025-2030

Chart on France - Market size and forecast 2025-2030 ($ million)
Data Table on France - Market size and forecast 2025-2030 ($ million)
Chart on France - Year-over-year growth 2025-2030 (%)
Data Table on France - Year-over-year growth 2025-2030 (%)

12.5.4 Italy - Market size and forecast 2025-2030

Chart on Italy - Market size and forecast 2025-2030 ($ million)
Data Table on Italy - Market size and forecast 2025-2030 ($ million)
Chart on Italy - Year-over-year growth 2025-2030 (%)
Data Table on Italy - Year-over-year growth 2025-2030 (%)

12.5.5 The Netherlands - Market size and forecast 2025-2030

Chart on The Netherlands - Market size and forecast 2025-2030 ($ million)
Data Table on The Netherlands - Market size and forecast 2025-2030 ($ million)
Chart on The Netherlands - Year-over-year growth 2025-2030 (%)
Data Table on The Netherlands - Year-over-year growth 2025-2030 (%)

12.5.6 Spain - Market size and forecast 2025-2030

Chart on Spain - Market size and forecast 2025-2030 ($ million)
Data Table on Spain - Market size and forecast 2025-2030 ($ million)
Chart on Spain - Year-over-year growth 2025-2030 (%)
Data Table on Spain - Year-over-year growth 2025-2030 (%)

12.6 South America - Market size and forecast 2025-2030

Chart on South America - Market size and forecast 2025-2030 ($ million)
Data Table on South America - Market size and forecast 2025-2030 ($ million)
Chart on South America - Year-over-year growth 2025-2030 (%)
Data Table on South America - Year-over-year growth 2025-2030 (%)
Chart on Regional Comparison - South America
Data Table on Regional Comparison - South America

12.6.1 Brazil - Market size and forecast 2025-2030

Chart on Brazil - Market size and forecast 2025-2030 ($ million)
Data Table on Brazil - Market size and forecast 2025-2030 ($ million)
Chart on Brazil - Year-over-year growth 2025-2030 (%)
Data Table on Brazil - Year-over-year growth 2025-2030 (%)

12.6.2 Argentina - Market size and forecast 2025-2030

Chart on Argentina - Market size and forecast 2025-2030 ($ million)
Data Table on Argentina - Market size and forecast 2025-2030 ($ million)
Chart on Argentina - Year-over-year growth 2025-2030 (%)
Data Table on Argentina - Year-over-year growth 2025-2030 (%)

12.6.3 Colombia - Market size and forecast 2025-2030

Chart on Colombia - Market size and forecast 2025-2030 ($ million)
Data Table on Colombia - Market size and forecast 2025-2030 ($ million)
Chart on Colombia - Year-over-year growth 2025-2030 (%)
Data Table on Colombia - Year-over-year growth 2025-2030 (%)

12.7 Middle East and Africa - Market size and forecast 2025-2030

Chart on Middle East and Africa - Market size and forecast 2025-2030 ($ million)
Data Table on Middle East and Africa - Market size and forecast 2025-2030 ($ million)
Chart on Middle East and Africa - Year-over-year growth 2025-2030 (%)
Data Table on Middle East and Africa - Year-over-year growth 2025-2030 (%)
Chart on Regional Comparison - Middle East and Africa
Data Table on Regional Comparison - Middle East and Africa

12.7.1 Saudi Arabia - Market size and forecast 2025-2030

Chart on Saudi Arabia - Market size and forecast 2025-2030 ($ million)
Data Table on Saudi Arabia - Market size and forecast 2025-2030 ($ million)
Chart on Saudi Arabia - Year-over-year growth 2025-2030 (%)
Data Table on Saudi Arabia - Year-over-year growth 2025-2030 (%)

12.7.2 UAE - Market size and forecast 2025-2030

Chart on UAE - Market size and forecast 2025-2030 ($ million)
Data Table on UAE - Market size and forecast 2025-2030 ($ million)
Chart on UAE - Year-over-year growth 2025-2030 (%)
Data Table on UAE - Year-over-year growth 2025-2030 (%)

12.7.3 South Africa - Market size and forecast 2025-2030

Chart on South Africa - Market size and forecast 2025-2030 ($ million)
Data Table on South Africa - Market size and forecast 2025-2030 ($ million)
Chart on South Africa - Year-over-year growth 2025-2030 (%)
Data Table on South Africa - Year-over-year growth 2025-2030 (%)

12.7.4 Israel - Market size and forecast 2025-2030

Chart on Israel - Market size and forecast 2025-2030 ($ million)
Data Table on Israel - Market size and forecast 2025-2030 ($ million)
Chart on Israel - Year-over-year growth 2025-2030 (%)
Data Table on Israel - Year-over-year growth 2025-2030 (%)

12.7.5 Turkey - Market size and forecast 2025-2030

Chart on Turkey - Market size and forecast 2025-2030 ($ million)
Data Table on Turkey - Market size and forecast 2025-2030 ($ million)
Chart on Turkey - Year-over-year growth 2025-2030 (%)
Data Table on Turkey - Year-over-year growth 2025-2030 (%)

12.8 Market opportunity by geography

Market opportunity by geography ($ million)
Data Tables on Market opportunity by geography ($ million)

13. Drivers, Challenges, and Opportunity

13.1 Market drivers

Proliferation of generative physical intelligence
Scalability of robotics-as-a-service business models
Resilience in global supply chains and reshoring initiatives

13.2 Market challenges

High initial capital expenditure and financial sustainability
Regulatory fragmentation and standardization hurdles
Integration of legacy systems and workforce resistance

13.3 Impact of drivers and challenges

Impact of drivers and challenges in 2025 and 2030

13.4 Market opportunities

Emergence of edge-native orchestration and decentralized robot intelligence
Interoperability standards and rise of open-ecosystem orchestration
Integration of environmental, social, and governance metrics into robot lifecycle management

14. Competitive Landscape

14.1 Overview

14.2

Overview on criticality of inputs and factors of differentiation

14.3 Landscape disruption

Overview on factors of disruption

14.4 Industry risks

Impact of key risks on business

15. Competitive Analysis

15.1 Companies profiled

Companies covered

15.2 Company ranking index

15.3 Market positioning of companies

Matrix on companies position and classification

15.4 Agility Robotics Inc.

Agility Robotics Inc. - Overview
Agility Robotics Inc. - Product / Service
Agility Robotics Inc. - Key offerings
SWOT

15.5 Bear Robotics, Inc.

Bear Robotics, Inc. - Overview
Bear Robotics, Inc. - Product / Service
Bear Robotics, Inc. - Key offerings
SWOT

15.6 Berkshire Grey

Berkshire Grey - Overview
Berkshire Grey - Product / Service
Berkshire Grey - Key offerings
SWOT

15.7 Brain Corp.

Brain Corp. - Overview
Brain Corp. - Product / Service
Brain Corp. - Key offerings
SWOT

15.8 Figure AI

Figure AI - Overview
Figure AI - Product / Service
Figure AI - Key offerings
SWOT

15.9 Formant

Formant - Overview
Formant - Product / Service
Formant - Key offerings
SWOT

15.10 Geekplus Technology Co. Ltd.

Geekplus Technology Co. Ltd. - Overview
Geekplus Technology Co. Ltd. - Product / Service
Geekplus Technology Co. Ltd. - Key offerings
SWOT

15.11 inVia Robotics Inc.

inVia Robotics Inc. - Overview
inVia Robotics Inc. - Product / Service
inVia Robotics Inc. - Key offerings
SWOT

15.12 Locus Robotics Corp.

Locus Robotics Corp. - Overview
Locus Robotics Corp. - Product / Service
Locus Robotics Corp. - Key offerings
SWOT

15.13 NVIDIA Corp.

NVIDIA Corp. - Overview
NVIDIA Corp. - Business segments
NVIDIA Corp. - Key news
NVIDIA Corp. - Key offerings
NVIDIA Corp. - Segment focus
SWOT

15.14 RightHand Robotics Inc.

RightHand Robotics Inc. - Overview
RightHand Robotics Inc. - Product / Service
RightHand Robotics Inc. - Key offerings
SWOT

15.15 Tesla Inc.

Tesla Inc. - Overview
Tesla Inc. - Business segments
Tesla Inc. - Key news
Tesla Inc. - Key offerings
Tesla Inc. - Segment focus
SWOT

15.16 UBTECH ROBOTICS CORP LTD

UBTECH ROBOTICS CORP LTD - Overview
UBTECH ROBOTICS CORP LTD - Product / Service
UBTECH ROBOTICS CORP LTD - Key offerings
SWOT

15.17 Universal Robots AS

Universal Robots AS - Overview
Universal Robots AS - Product / Service
Universal Robots AS - Key offerings
SWOT

15.18 Zebra Technologies Corp.

Zebra Technologies Corp. - Overview
Zebra Technologies Corp. - Business segments
Zebra Technologies Corp. - Key news
Zebra Technologies Corp. - Key offerings
Zebra Technologies Corp. - Segment focus
SWOT

16. Appendix

16.1 Scope of the report

Market definition
Objectives
Notes and caveats

16.2 Inclusions and exclusions checklist

Inclusions checklist
Exclusions checklist

16.3 Currency conversion rates for US$

16.4 Research methodology

16.5 Data procurement

Information sources

16.6 Data validation

16.7 Validation techniques employed for market sizing

16.8 Data synthesis

16.9 360 degree market analysis

16.10 List of abbreviations

Research Methodology

Technavio presents a detailed picture of the market by way of study, synthesis, and summation of data from multiple sources. The analysts have presented the various facets of the market with a particular focus on identifying the key industry influencers. The data thus presented is comprehensive, reliable, and the result of extensive research, both primary and secondary.

INFORMATION SOURCES

Primary sources

  • Manufacturers and suppliers
  • Channel partners
  • Industry experts
  • Strategic decision makers

Secondary sources

  • Industry journals and periodicals
  • Government data
  • Financial reports of key industry players
  • Historical data
  • Press releases

DATA ANALYSIS

Data Synthesis

  • Collation of data
  • Estimation of key figures
  • Analysis of derived insights

Data Validation

  • Triangulation with data models
  • Reference against proprietary databases
  • Corroboration with industry experts

REPORT WRITING

Qualitative

  • Market drivers
  • Market challenges
  • Market trends
  • Five forces analysis

Quantitative

  • Market size and forecast
  • Market segmentation
  • Geographical insights
  • Competitive landscape

Interested in this report?

Get your sample now to see our research methodology and insights!

Download Now

Frequently Asked Questions

Physical AI And Robotics-as-a-service market growth will increase by USD 21239.5 million during 2026-2030.

The Physical AI And Robotics-as-a-service market is expected to grow at a CAGR of 30.8% during 2026-2030.

Physical AI And Robotics-as-a-service market is segmented by Solution (Physical AI, Robotics-as-a-Service, Integration and support services) Application (Logistics and warehousing, Manufacturing and assembly, Service and healthcare) End-user (Large enterprises, SMEs)

Agility Robotics Inc., Bear Robotics, Inc., Berkshire Grey, Boston Dynamics Inc., Brain Corp., Covariant, Figure AI, Formant, Geekplus Technology Co. Ltd., IFS, inVia Robotics Inc., Locus Robotics Corp., NVIDIA Corp., Qualcomm Inc., RightHand Robotics Inc., Symbotic Inc., Tesla Inc., UBTECH ROBOTICS CORP LTD, Universal Robots AS, Zebra Technologies Corp. are a few of the key vendors in the Physical AI And Robotics-as-a-service market.

North America will register the highest growth rate of 35.2% among the other regions. Therefore, the Physical AI And Robotics-as-a-service market in North America is expected to garner significant business opportunities for the vendors during the forecast period.

US, Canada, Mexico, China, Japan, India, South Korea, Australia, Indonesia, Germany, UK, France, Italy, The Netherlands, Spain, Brazil, Argentina, Colombia, Saudi Arabia, UAE, South Africa, Israel, Turkey

  • Proliferation of generative physical intelligence is the driving factor this market.

The Physical AI And Robotics-as-a-service market vendors should focus on grabbing business opportunities from the Solution segment as it accounted for the largest market share in the base year.
RIA - Research AI Assistant
Ask RIA