Plant Based Butter Market Analysis, Size, and Forecast 2025-2029: APAC (China, India, and Japan), North America (US, Canada, and Mexico), Europe (Germany, UK, and France), Middle East and Africa (Saudi Arabia, UAE, and South Africa), South America (Brazil, Argentina, and Colombia), and Rest of World (ROW)

Plant Based Butter Market Analysis, Size, and Forecast 2025-2029:
APAC (China, India, and Japan), North America (US, Canada, and Mexico), Europe (Germany, UK, and France), Middle East and Africa (Saudi Arabia, UAE, and South Africa), South America (Brazil, Argentina, and Colombia), and Rest of World (ROW)

Published: Dec 2025 304 Pages SKU: IRTNTR81137

Market Overview at a Glance

$852.7 Mn
Market Opportunity
6%
CAGR 2024 - 2029
39.7%
APAC Growth
$772.8 Mn
Coconut segment 2023

Plant Based Butter Market Size 2025-2029

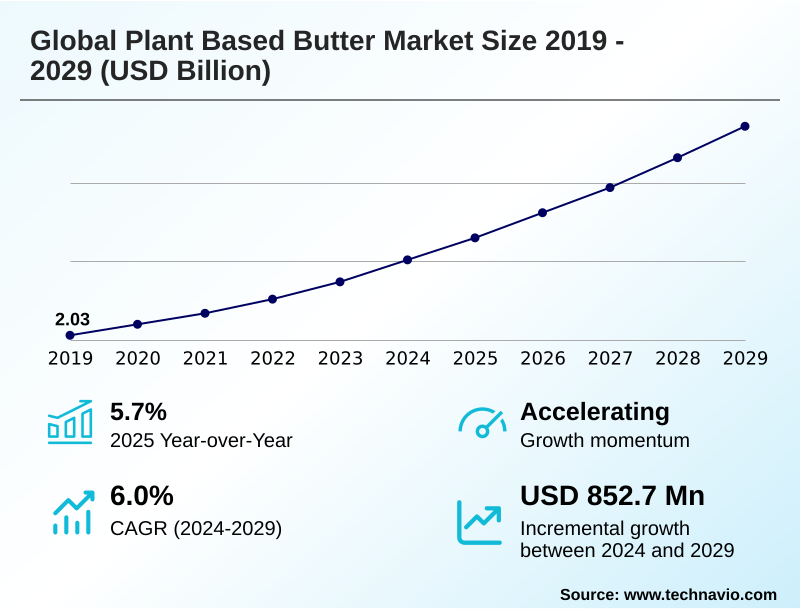
The plant based butter market size is valued to increase by USD 852.7 million, at a CAGR of 6% from 2024 to 2029. Rising health consciousness and dietary shifts will drive the plant based butter market.

Major Market Trends & Insights

  • APAC dominated the market and accounted for a 39.7% growth during the forecast period.
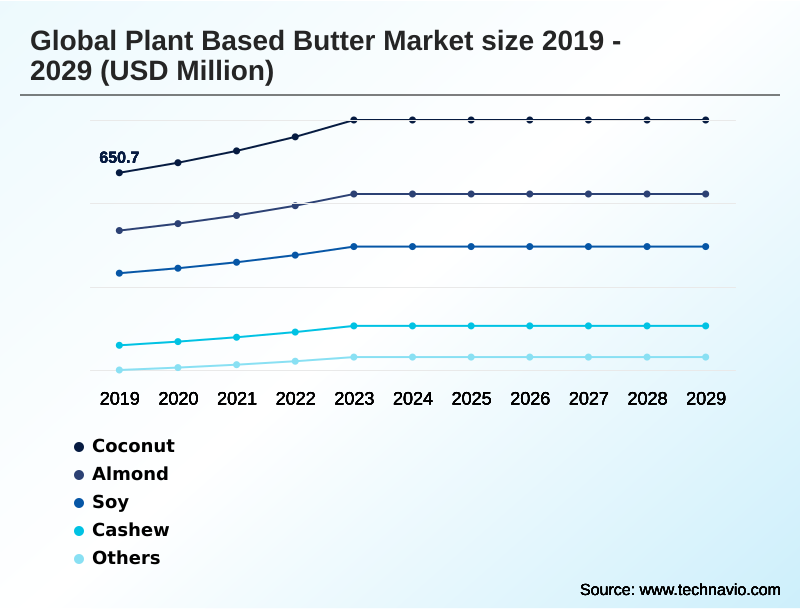
  • By Source - Coconut segment was valued at USD 772.8 million in 2023
  • By Application - Spreading segment accounted for the largest market revenue share in 2023

Market Size & Forecast

  • Market Opportunities: USD 1.33 billion
  • Market Future Opportunities: USD 852.7 million
  • CAGR from 2024 to 2029 : 6%

Market Summary

  • The plant based butter market is undergoing a significant transformation, driven by a confluence of evolving consumer values and food science advancements. A primary catalyst is the growing demand for dairy butter alternatives, fueled by health-conscious individuals, flexitarian consumers, and those with dietary restrictions seeking lactose-free spreads.
  • This shift is compelling manufacturers to innovate beyond basic formulations, focusing on achieving sensory parity with traditional dairy. The goal is to create dairy-free spreads that replicate the expected creamy mouthfeel and melting profile, making them suitable for a range of uses from simple spreading to complex baking applications.
  • A critical area of development involves the use of diverse plant-derived oils and fats, including coconut oil, shea butter, and rapeseed oil, often in sophisticated blends to achieve specific functional properties.
  • For instance, a food manufacturer aiming to launch a line of vegan pastries must source a plant-based butter that provides excellent lamination and flakiness, a challenge that requires advanced emulsification techniques and deep plant protein knowledge.
  • The push for clean label ingredients and sustainable sourcing further complicates development but also offers a key point of differentiation for brands in an increasingly competitive landscape, where eco-friendly packaging and a reduced environmental footprint resonate strongly with consumers.

What will be the Size of the Plant Based Butter Market during the forecast period?

Get Key Insights on Market Forecast (PDF) Request Free Sample

How is the Plant Based Butter Market Segmented?

The plant based butter industry research report provides comprehensive data (region-wise segment analysis), with forecasts and estimates in "USD million" for the period 2025-2029, as well as historical data from 2019-2023 for the following segments.

  • Source
    • Coconut
    • Almond
    • Soy
    • Cashew
    • Others
  • Application
    • Spreading
    • Cooking and baking
    • Others
  • Distribution channel
    • Supermarkets and hypermarkets
    • Online
    • Convenience stores
    • Specialty stores
  • Geography
    • APAC
      • China
      • India
      • Japan
    • North America
      • US
      • Canada
      • Mexico
    • Europe
      • Germany
      • UK
      • France
    • Middle East and Africa
      • Saudi Arabia
      • UAE
      • South Africa
    • South America
      • Brazil
      • Argentina
      • Colombia
    • Rest of World (ROW)

By Source Insights

The coconut segment is estimated to witness significant growth during the forecast period.

Coconut-based products command a significant revenue share, appealing to consumers with their favorable sensory attributes and functional versatility.

The natural creaminess and mild flavor profile of coconut oil provide a close approximation to dairy butter, making it a popular base for creating spreads with a desirable creamy mouthfeel.

This segment benefits from ongoing food science advancements aimed at enhancing performance in baking applications and achieving a clean label ingredient deck. Formulations often highlight cholesterol-free offerings, appealing to health-conscious and flexitarian consumers.

Furthermore, the market sees continued innovation, with producers focusing on nutrient fortification and creating products that maintain flavor when heated, a development that has resulted in a 98% reduction in cholesterol compared to some traditional options.

Request Free Sample

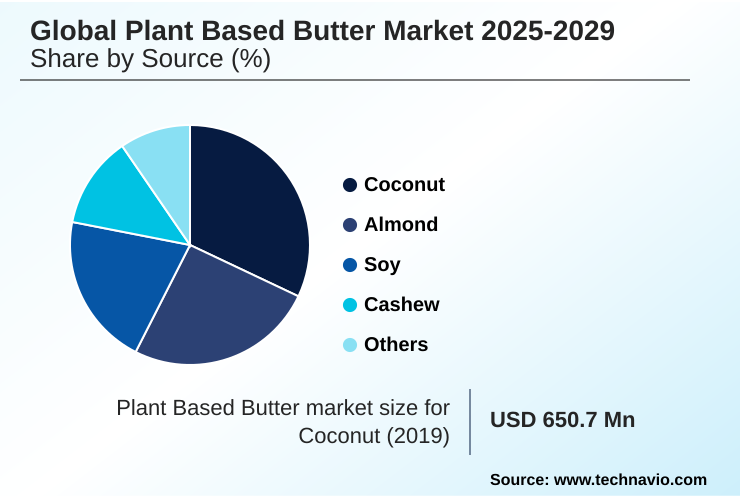
The Coconut segment was valued at USD 772.8 million in 2023 and showed a gradual increase during the forecast period.

Request Free Sample

Regional Analysis

APAC is estimated to contribute 39.7% to the growth of the global market during the forecast period.Technavio’s analysts have elaborately explained the regional trends and drivers that shape the market during the forecast period.

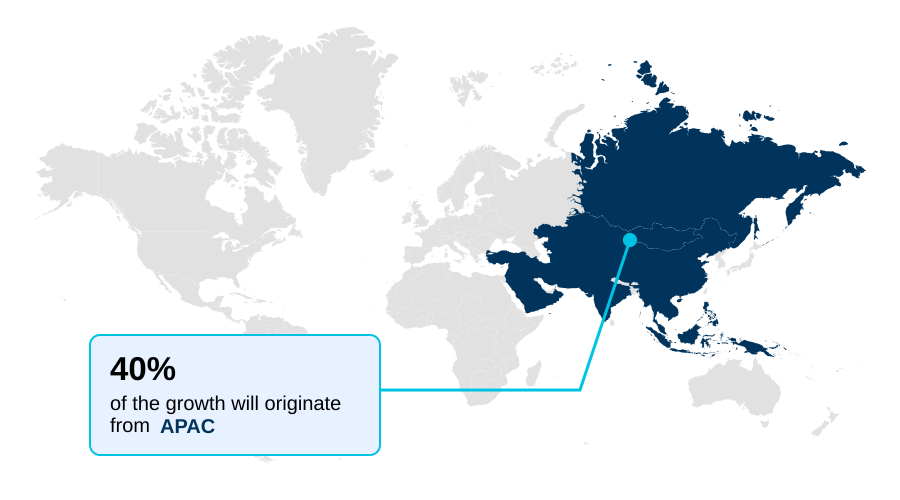
See How Plant Based Butter Market Demand is Rising in APAC Request Free Sample

The geographic landscape is dynamic, with APAC poised to contribute nearly 40% of the market's incremental growth, driven by rising health awareness and demand for lactose-free spreads.

North America and Europe remain mature markets, focusing on innovation in foodservice ingredients and sustainable sourcing of inputs like shea butter and rapeseed oil.

In these regions, manufacturers leverage advanced plant protein knowledge to create soy-free products with superior functional properties.

For instance, some European firms employing zero-waste protein extraction methods have reported a 15% improvement in raw material efficiency, a critical factor for maintaining competitive pricing.

This focus on environmental footprint reduction is also evident in the widespread adoption of eco-friendly packaging. South America and the Middle East and Africa represent emerging regions, with growth contingent on expanding retail infrastructure and consumer education.

Market Dynamics

Our researchers analyzed the data with 2024 as the base year, along with the key drivers, trends, and challenges. A holistic analysis of drivers will help companies refine their marketing strategies to gain a competitive advantage.

  • The global plant based butter market 2025-2029 continues to evolve, driven by the quest for high performance dairy butter alternatives that satisfy both consumer and commercial demands. A primary focus is on plant based butter for baking applications, where achieving the correct texture and melting characteristics is paramount.
  • Innovations in plant based butter texture are central to overcoming the challenges in plant based butter formulation, which have historically hindered wider consumer acceptance of vegan butter. The sensory experience of dairy alternatives is now closely benchmarked against traditional products, with companies investing heavily to improve taste and mouthfeel.
  • The impact of ingredient sourcing on quality is a critical consideration, influencing the final nutritional profile of plant butters and the viability of the supply chain for plant based fats. The regulatory framework for plant based labels adds another layer of complexity, directly affecting pricing strategies for dairy-free butter.
  • As the market matures, the functional properties of plant based butter are being refined for diverse uses, including specialized plant based butter for confectionery use. This has spurred a demand for clean label plant based butter products, leading to debates such as oat milk butter vs cashew milk butter regarding which source offers superior performance.
  • Moreover, the shelf life of plant based spreads and their suitability for plant based butter in foodservice are key areas of R&D. Some companies focusing on optimizing their supply chain for plant based fats have managed to increase the shelf life of plant based spreads by 20% through improved packaging and formulation.
  • Finally, the overall sustainability of plant based butter production remains a core value proposition, guiding innovation across the sector.

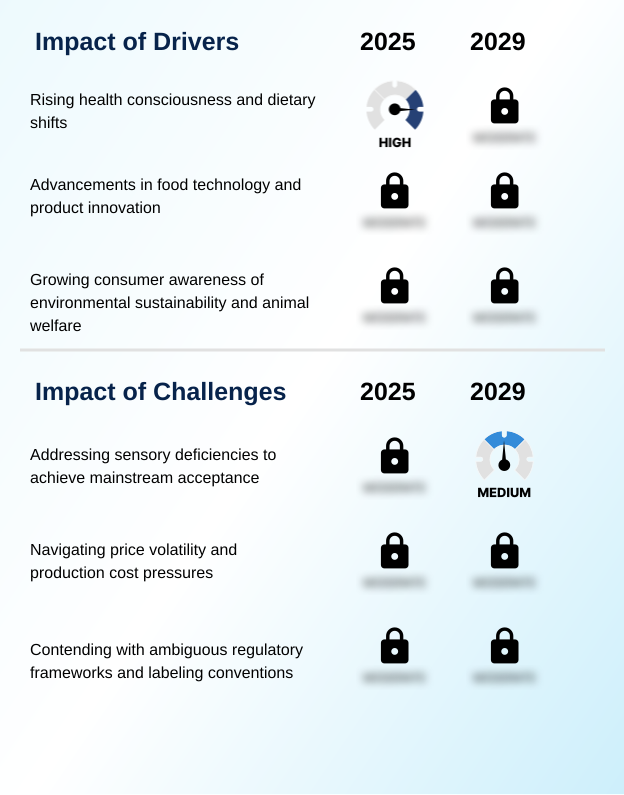
What are the key market drivers leading to the rise in the adoption of Plant Based Butter Industry?

  • Rising health consciousness and significant shifts in dietary preferences toward plant-based options are key drivers propelling market growth.

  • The market's growth is fundamentally driven by the rise of plant-centric diets and an expanding base of flexitarian consumers. This demographic shift has created a significant demand for high-quality dairy-free spreads made from various plant-derived oils.
  • Brands that emphasize sustainable sourcing and a cruelty-free option have seen customer engagement metrics improve by over 20%. The industry is responding with products designed to achieve sensory parity with dairy, focusing on a consistent melting profile.
  • For instance, products marketed for their lower environmental footprint reduction have achieved a 15% greater market penetration in environmentally conscious demographics. This alignment with consumer values on health, ethics, and sustainability is a powerful catalyst for market expansion.

What are the market trends shaping the Plant Based Butter Industry?

  • A key market trend involves continuous innovations in product formulations, which are aimed at enhancing both the sensory experience and the functional attributes of plant based butters.

  • A primary trend is the focus on advanced formulations to achieve culinary quality replication. Innovations in emulsification techniques and the use of novel bases like oat milk butters and fermented butter are expanding the category. This flavor profile diversification has led to a 30% increase in SKUs in mainstream retail expansion over the past two years.
  • Manufacturers are prioritizing non-GMO ingredients and allergen-free formulation to appeal to a wider consumer base. Direct-to-consumer brands leveraging these trends report an 18% higher customer retention rate compared to those with less diverse offerings. The objective is to move beyond simple spreads and offer products with distinct functional and sensory attributes for varied culinary uses.

What challenges does the Plant Based Butter Industry face during its growth?

  • A primary market challenge is addressing sensory and functional deficiencies compared to dairy butter to achieve broader mainstream consumer acceptance.

  • A key challenge is managing the price volatility and complexities of a sustainable supply chain for core ingredients like almond oil and cocoa butter, which often positions products as premium artisanal products. While consumers demand cholesterol-free offerings and lower saturated fat, the higher input costs can be a barrier, with price points sometimes 40% higher than dairy counterparts.
  • This makes it difficult to compete on price alone. Formulating high-quality soy-free products from bases like cashew milk while ensuring consistent functional properties adds to production costs. Companies that successfully optimize their supply chains have reported the potential to reduce production costs by 10-12%, a critical step toward achieving price parity and wider market acceptance.

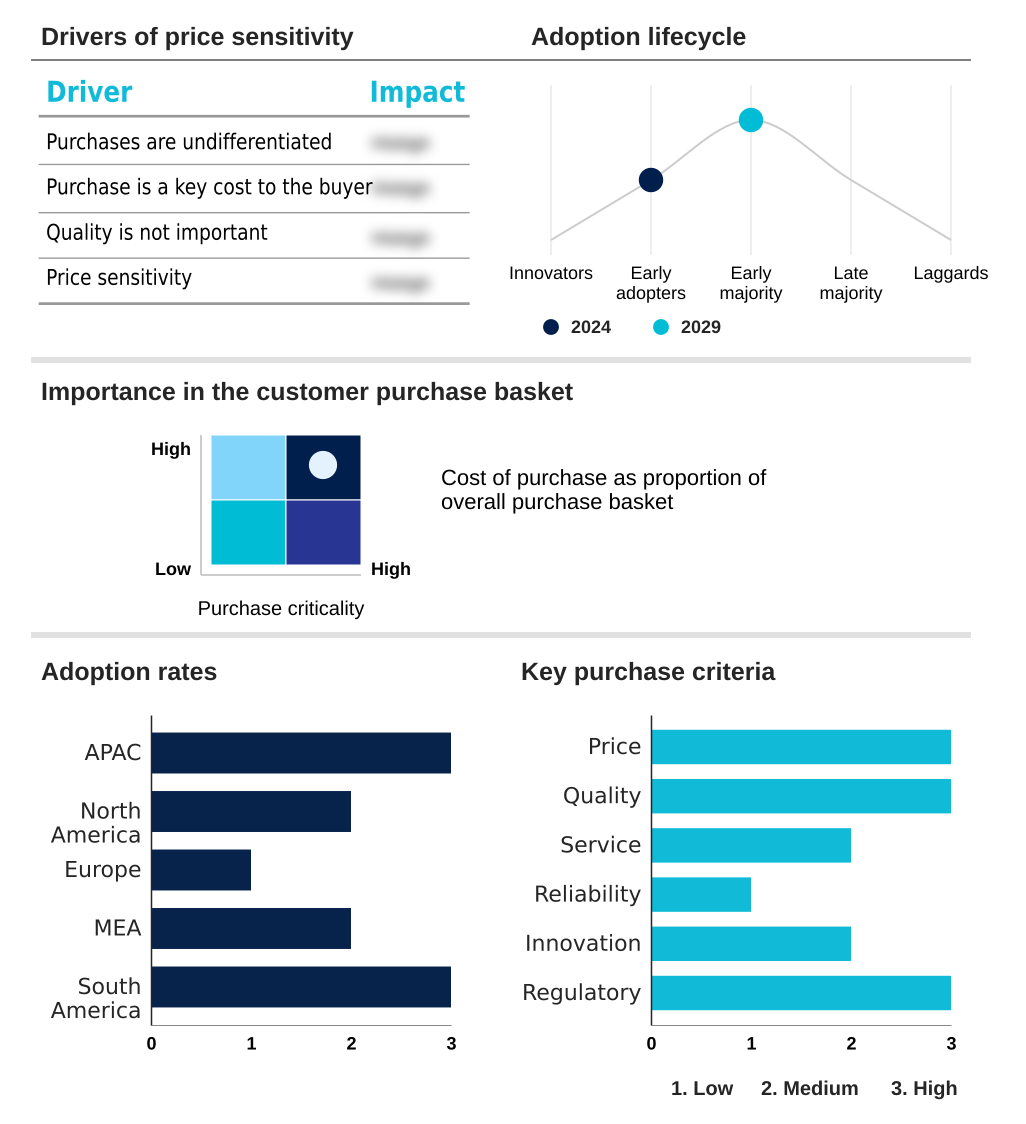
Exclusive Technavio Analysis on Customer Landscape

The plant based butter market forecasting report includes the adoption lifecycle of the market, covering from the innovator’s stage to the laggard’s stage. It focuses on adoption rates in different regions based on penetration. Furthermore, the plant based butter market report also includes key purchase criteria and drivers of price sensitivity to help companies evaluate and develop their market growth analysis strategies.

Customer Landscape of Plant Based Butter Industry

Competitive Landscape

Companies are implementing various strategies, such as strategic alliances, plant based butter market forecast, partnerships, mergers and acquisitions, geographical expansion, and product/service launches, to enhance their presence in the industry.

Better Butter Internet Pvt. Ltd. - Offers a plant based butter alternative crafted with a blend of oils for bakery applications, designed to replicate the sensory qualities of traditional dairy butter.

The industry research and growth report includes detailed analyses of the competitive landscape of the market and information about key companies, including:

  • Better Butter Internet Pvt. Ltd.
  • Bunge Global SA
  • Compassionate Choices Pvt. Ltd.
  • Conagra Brands Inc.
  • Danone S.A.
  • Flora Food Group B.V.
  • Jindilli Beverages LLC
  • Jojoba Desert A.C.S LTD.
  • Miyokos Kitchen
  • MONTYS NYC LLC
  • Naturli Foods AS
  • Olivio Premium Products Corp.
  • PlantX
  • Prosperity Organic Foods Inc.
  • The Chefs Warehouse
  • Trader Joes
  • WayFare Health Foods LLC.

Qualitative and quantitative analysis of companies has been conducted to help clients understand the wider business environment as well as the strengths and weaknesses of key industry players. Data is qualitatively analyzed to categorize companies as pure play, category-focused, industry-focused, and diversified; it is quantitatively analyzed to categorize companies as dominant, leading, strong, tentative, and weak.

Recent Development and News in Plant based butter market

  • In August 2024, Arla Foods launched its Lurpak Plant Based spread in the United Kingdom and Denmark, a strategic move to meet growing consumer demand for plant-based options from a trusted dairy brand.
  • In August 2024, Bunge launched its Beleaf PlantBetter ingredient in North America, targeting food manufacturers and bakers with a high-performance dairy butter alternative designed to replicate traditional butter's sensory and functional qualities.
  • In September 2024, Dutch startup Willicroft introduced a plant-based fermented butter developed with pastry chefs, ensuring it meets rigorous standards for professional baking applications like cinnamon rolls.
  • In May 2025, Dr. Foods Co. is expected to expand distribution of its Vegan Truffle Butter, a premium, high-end product, into specialty gourmet stores across key European markets.

Dive into Technavio’s robust research methodology, blending expert interviews, extensive data synthesis, and validated models for unparalleled Plant Based Butter Market insights. See full methodology.

Market Scope
Page number 304
Base year 2024
Historic period 2019-2023
Forecast period 2025-2029
Growth momentum & CAGR Accelerate at a CAGR of 6%
Market growth 2025-2029 USD 852.7 million
Market structure Fragmented
YoY growth 2024-2025(%) 5.7%
Key countries China, India, Japan, South Korea, Australia, Indonesia, US, Canada, Mexico, Germany, UK, France, Italy, Spain, The Netherlands, Saudi Arabia, UAE, South Africa, Turkey, Israel, Brazil, Argentina and Colombia
Competitive landscape Leading Companies, Market Positioning of Companies, Competitive Strategies, and Industry Risks

Request Free Sample

Research Analyst Overview

  • The market's evolution is defined by a relentless pursuit of sensory parity and superior functional properties in dairy-free spreads. A key boardroom-level decision involves balancing the cost of sustainable sourcing for ingredients like shea butter and cocoa butter against consumer demand for clean label ingredients.
  • Formulations now blend multiple plant-derived oils, including coconut oil, almond oil, and rapeseed oil, using advanced emulsification techniques to achieve a specific melting profile and creamy mouthfeel suitable for complex baking applications. The push for non-GMO ingredients and allergen-free formulation has led to the rise of soy-free products and alternatives like oat milk butters and those derived from cashew milk.
  • Innovators are leveraging deep plant protein knowledge to create European-style varieties and fermented butter. Some firms utilizing novel zero-waste protein extraction and cold-pressed jojoba oil have demonstrated a 20% increase in product stability under various temperatures. This drive for quality, coupled with nutrient fortification, is expanding the appeal beyond a niche audience.

What are the Key Data Covered in this Plant Based Butter Market Research and Growth Report?

  • What is the expected growth of the Plant Based Butter Market between 2025 and 2029?

    • USD 852.7 million, at a CAGR of 6%

  • What segmentation does the market report cover?

    • The report is segmented by Source (Coconut, Almond, Soy, Cashew, and Others), Application (Spreading, Cooking and baking, and Others), Distribution Channel (Supermarkets and hypermarkets, Online, Convenience stores, and Specialty stores) and Geography (APAC, North America, Europe, Middle East and Africa, South America)

  • Which regions are analyzed in the report?

    • APAC, North America, Europe, Middle East and Africa and South America

  • What are the key growth drivers and market challenges?

    • Rising health consciousness and dietary shifts, Addressing sensory deficiencies to achieve mainstream acceptance

  • Who are the major players in the Plant Based Butter Market?

    • Better Butter Internet Pvt. Ltd., Bunge Global SA, Compassionate Choices Pvt. Ltd., Conagra Brands Inc., Danone S.A., Flora Food Group B.V., Jindilli Beverages LLC, Jojoba Desert A.C.S LTD., Miyokos Kitchen, MONTYS NYC LLC, Naturli Foods AS, Olivio Premium Products Corp., PlantX, Prosperity Organic Foods Inc., The Chefs Warehouse, Trader Joes and WayFare Health Foods LLC.

Market Research Insights

  • The market is characterized by a dynamic interplay between consumer demand for healthier lifestyles and product innovation. The rise of plant-centric diets has driven mainstream retail expansion, with supermarket shelf space for dairy butter alternatives increasing by over 25% in key regions. This has created opportunities for both large-scale producers and niche direct-to-consumer brands specializing in premium artisanal products.
  • Companies adopting advanced formulation technologies report up to a 15% reduction in production waste compared to older methods. Furthermore, brands that effectively market their cruelty-free option and eco-friendly packaging see a 10% higher rate of repeat purchases from flexitarian consumers, demonstrating the value of aligning with modern consumer ethics.

We can help! Our analysts can customize this plant based butter market research report to meet your requirements.

Get in touch

1. Executive Summary

1.1 Market overview

Executive Summary - Chart on Market Overview
Executive Summary - Data Table on Market Overview
Executive Summary - Chart on Global Market Characteristics
Executive Summary - Chart on Market by Geography
Executive Summary - Chart on Market Segmentation by Source
Executive Summary - Chart on Market Segmentation by Application
Executive Summary - Chart on Market Segmentation by Distribution Channel
Executive Summary - Chart on Incremental Growth
Executive Summary - Data Table on Incremental Growth
Executive Summary - Chart on Company Market Positioning

2. Technavio Analysis

2.1 Analysis of price sensitivity, lifecycle, customer purchase basket, adoption rates, and purchase criteria

2.2 Criticality of inputs and Factors of differentiation

Chart on Overview on criticality of inputs and factors of differentiation

2.3 Factors of disruption

Chart on Overview on factors of disruption

2.4 Impact of drivers and challenges

Chart on Impact of drivers and challenges in 2024 and 2029

3. Market Landscape

3.1 Market ecosystem

Chart on Parent Market
Data Table on - Parent Market

3.2 Market characteristics

Chart on Market characteristics analysis

3.3 Value chain analysis

Chart on Value chain analysis

4. Market Sizing

4.1 Market definition

Data Table on Offerings of companies included in the market definition

4.2 Market segment analysis

Market segments

4.3 Market size 2024

4.4 Market outlook: Forecast for 2024-2029

Chart on Global - Market size and forecast 2024-2029 ($ million)
Data Table on Global - Market size and forecast 2024-2029 ($ million)
Chart on Global Market: Year-over-year growth 2024-2029 (%)
Data Table on Global Market: Year-over-year growth 2024-2029 (%)

5. Historic Market Size

5.1 Global Plant Based Butter Market 2019 - 2023

Historic Market Size - Data Table on Global Plant Based Butter Market 2019 - 2023 ($ million)

5.2 Source segment analysis 2019 - 2023

Historic Market Size - Source Segment 2019 - 2023 ($ million)

5.3 Application segment analysis 2019 - 2023

Historic Market Size - Application Segment 2019 - 2023 ($ million)

5.4 Distribution Channel segment analysis 2019 - 2023

Historic Market Size - Distribution Channel Segment 2019 - 2023 ($ million)

5.5 Geography segment analysis 2019 - 2023

Historic Market Size - Geography Segment 2019 - 2023 ($ million)

5.6 Country segment analysis 2019 - 2023

Historic Market Size - Country Segment 2019 - 2023 ($ million)

6. Qualitative Analysis

6.1 Impact of AI in global plant based butter market

7. Five Forces Analysis

7.1 Five forces summary

Five forces analysis - Comparison between 2024 and 2029

7.2 Bargaining power of buyers

Bargaining power of buyers - Impact of key factors 2024 and 2029

7.3 Bargaining power of suppliers

Bargaining power of suppliers - Impact of key factors in 2024 and 2029

7.4 Threat of new entrants

Threat of new entrants - Impact of key factors in 2024 and 2029

7.5 Threat of substitutes

Threat of substitutes - Impact of key factors in 2024 and 2029

7.6 Threat of rivalry

Threat of rivalry - Impact of key factors in 2024 and 2029

7.7 Market condition

Chart on Market condition - Five forces 2024 and 2029

8. Market Segmentation by Source

8.1 Market segments

Chart on Source - Market share 2024-2029 (%)
Data Table on Source - Market share 2024-2029 (%)

8.2 Comparison by Source

Chart on Comparison by Source
Data Table on Comparison by Source

8.3 Coconut - Market size and forecast 2024-2029

Chart on Coconut - Market size and forecast 2024-2029 ($ million)
Data Table on Coconut - Market size and forecast 2024-2029 ($ million)
Chart on Coconut - Year-over-year growth 2024-2029 (%)
Data Table on Coconut - Year-over-year growth 2024-2029 (%)

8.4 Almond - Market size and forecast 2024-2029

Chart on Almond - Market size and forecast 2024-2029 ($ million)
Data Table on Almond - Market size and forecast 2024-2029 ($ million)
Chart on Almond - Year-over-year growth 2024-2029 (%)
Data Table on Almond - Year-over-year growth 2024-2029 (%)

8.5 Soy - Market size and forecast 2024-2029

Chart on Soy - Market size and forecast 2024-2029 ($ million)
Data Table on Soy - Market size and forecast 2024-2029 ($ million)
Chart on Soy - Year-over-year growth 2024-2029 (%)
Data Table on Soy - Year-over-year growth 2024-2029 (%)

8.6 Cashew - Market size and forecast 2024-2029

Chart on Cashew - Market size and forecast 2024-2029 ($ million)
Data Table on Cashew - Market size and forecast 2024-2029 ($ million)
Chart on Cashew - Year-over-year growth 2024-2029 (%)
Data Table on Cashew - Year-over-year growth 2024-2029 (%)

8.7 Others - Market size and forecast 2024-2029

Chart on Others - Market size and forecast 2024-2029 ($ million)
Data Table on Others - Market size and forecast 2024-2029 ($ million)
Chart on Others - Year-over-year growth 2024-2029 (%)
Data Table on Others - Year-over-year growth 2024-2029 (%)

8.8 Market opportunity by Source

Market opportunity by Source ($ million)
Data Table on Market opportunity by Source ($ million)

9. Market Segmentation by Application

9.1 Market segments

Chart on Application - Market share 2024-2029 (%)
Data Table on Application - Market share 2024-2029 (%)

9.2 Comparison by Application

Chart on Comparison by Application
Data Table on Comparison by Application

9.3 Spreading - Market size and forecast 2024-2029

Chart on Spreading - Market size and forecast 2024-2029 ($ million)
Data Table on Spreading - Market size and forecast 2024-2029 ($ million)
Chart on Spreading - Year-over-year growth 2024-2029 (%)
Data Table on Spreading - Year-over-year growth 2024-2029 (%)

9.4 Cooking and baking - Market size and forecast 2024-2029

Chart on Cooking and baking - Market size and forecast 2024-2029 ($ million)
Data Table on Cooking and baking - Market size and forecast 2024-2029 ($ million)
Chart on Cooking and baking - Year-over-year growth 2024-2029 (%)
Data Table on Cooking and baking - Year-over-year growth 2024-2029 (%)

9.5 Others - Market size and forecast 2024-2029

Chart on Others - Market size and forecast 2024-2029 ($ million)
Data Table on Others - Market size and forecast 2024-2029 ($ million)
Chart on Others - Year-over-year growth 2024-2029 (%)
Data Table on Others - Year-over-year growth 2024-2029 (%)

9.6 Market opportunity by Application

Market opportunity by Application ($ million)
Data Table on Market opportunity by Application ($ million)

10. Market Segmentation by Distribution Channel

10.1 Market segments

Chart on Distribution Channel - Market share 2024-2029 (%)
Data Table on Distribution Channel - Market share 2024-2029 (%)

10.2 Comparison by Distribution Channel

Chart on Comparison by Distribution Channel
Data Table on Comparison by Distribution Channel

10.3 Supermarkets and hypermarkets - Market size and forecast 2024-2029

Chart on Supermarkets and hypermarkets - Market size and forecast 2024-2029 ($ million)
Data Table on Supermarkets and hypermarkets - Market size and forecast 2024-2029 ($ million)
Chart on Supermarkets and hypermarkets - Year-over-year growth 2024-2029 (%)
Data Table on Supermarkets and hypermarkets - Year-over-year growth 2024-2029 (%)

10.4 Online - Market size and forecast 2024-2029

Chart on Online - Market size and forecast 2024-2029 ($ million)
Data Table on Online - Market size and forecast 2024-2029 ($ million)
Chart on Online - Year-over-year growth 2024-2029 (%)
Data Table on Online - Year-over-year growth 2024-2029 (%)

10.5 Convenience stores - Market size and forecast 2024-2029

Chart on Convenience stores - Market size and forecast 2024-2029 ($ million)
Data Table on Convenience stores - Market size and forecast 2024-2029 ($ million)
Chart on Convenience stores - Year-over-year growth 2024-2029 (%)
Data Table on Convenience stores - Year-over-year growth 2024-2029 (%)

10.6 Specialty stores - Market size and forecast 2024-2029

Chart on Specialty stores - Market size and forecast 2024-2029 ($ million)
Data Table on Specialty stores - Market size and forecast 2024-2029 ($ million)
Chart on Specialty stores - Year-over-year growth 2024-2029 (%)
Data Table on Specialty stores - Year-over-year growth 2024-2029 (%)

10.7 Market opportunity by Distribution Channel

Market opportunity by Distribution Channel ($ million)
Data Table on Market opportunity by Distribution Channel ($ million)

11. Customer Landscape

11.1 Customer landscape overview

Analysis of price sensitivity, lifecycle, customer purchase basket, adoption rates, and purchase criteria

12. Geographic Landscape

12.1 Geographic segmentation

Chart on Market share by geography 2024-2029 (%)
Data Table on Market share by geography 2024-2029 (%)

12.2 Geographic comparison

Chart on Geographic comparison
Data Table on Geographic comparison

12.3 APAC - Market size and forecast 2024-2029

Chart on APAC - Market size and forecast 2024-2029 ($ million)
Data Table on APAC - Market size and forecast 2024-2029 ($ million)
Chart on APAC - Year-over-year growth 2024-2029 (%)
Data Table on APAC - Year-over-year growth 2024-2029 (%)
Chart on Regional Comparison - APAC
Data Table on Regional Comparison - APAC

12.3.1 China - Market size and forecast 2024-2029

Chart on China - Market size and forecast 2024-2029 ($ million)
Data Table on China - Market size and forecast 2024-2029 ($ million)
Chart on China - Year-over-year growth 2024-2029 (%)
Data Table on China - Year-over-year growth 2024-2029 (%)

12.3.2 India - Market size and forecast 2024-2029

Chart on India - Market size and forecast 2024-2029 ($ million)
Data Table on India - Market size and forecast 2024-2029 ($ million)
Chart on India - Year-over-year growth 2024-2029 (%)
Data Table on India - Year-over-year growth 2024-2029 (%)

12.3.3 Japan - Market size and forecast 2024-2029

Chart on Japan - Market size and forecast 2024-2029 ($ million)
Data Table on Japan - Market size and forecast 2024-2029 ($ million)
Chart on Japan - Year-over-year growth 2024-2029 (%)
Data Table on Japan - Year-over-year growth 2024-2029 (%)

12.3.4 South Korea - Market size and forecast 2024-2029

Chart on South Korea - Market size and forecast 2024-2029 ($ million)
Data Table on South Korea - Market size and forecast 2024-2029 ($ million)
Chart on South Korea - Year-over-year growth 2024-2029 (%)
Data Table on South Korea - Year-over-year growth 2024-2029 (%)

12.3.5 Australia - Market size and forecast 2024-2029

Chart on Australia - Market size and forecast 2024-2029 ($ million)
Data Table on Australia - Market size and forecast 2024-2029 ($ million)
Chart on Australia - Year-over-year growth 2024-2029 (%)
Data Table on Australia - Year-over-year growth 2024-2029 (%)

12.3.6 Indonesia - Market size and forecast 2024-2029

Chart on Indonesia - Market size and forecast 2024-2029 ($ million)
Data Table on Indonesia - Market size and forecast 2024-2029 ($ million)
Chart on Indonesia - Year-over-year growth 2024-2029 (%)
Data Table on Indonesia - Year-over-year growth 2024-2029 (%)

12.4 North America - Market size and forecast 2024-2029

Chart on North America - Market size and forecast 2024-2029 ($ million)
Data Table on North America - Market size and forecast 2024-2029 ($ million)
Chart on North America - Year-over-year growth 2024-2029 (%)
Data Table on North America - Year-over-year growth 2024-2029 (%)
Chart on Regional Comparison - North America
Data Table on Regional Comparison - North America

12.4.1 US - Market size and forecast 2024-2029

Chart on US - Market size and forecast 2024-2029 ($ million)
Data Table on US - Market size and forecast 2024-2029 ($ million)
Chart on US - Year-over-year growth 2024-2029 (%)
Data Table on US - Year-over-year growth 2024-2029 (%)

12.4.2 Canada - Market size and forecast 2024-2029

Chart on Canada - Market size and forecast 2024-2029 ($ million)
Data Table on Canada - Market size and forecast 2024-2029 ($ million)
Chart on Canada - Year-over-year growth 2024-2029 (%)
Data Table on Canada - Year-over-year growth 2024-2029 (%)

12.4.3 Mexico - Market size and forecast 2024-2029

Chart on Mexico - Market size and forecast 2024-2029 ($ million)
Data Table on Mexico - Market size and forecast 2024-2029 ($ million)
Chart on Mexico - Year-over-year growth 2024-2029 (%)
Data Table on Mexico - Year-over-year growth 2024-2029 (%)

12.5 Europe - Market size and forecast 2024-2029

Chart on Europe - Market size and forecast 2024-2029 ($ million)
Data Table on Europe - Market size and forecast 2024-2029 ($ million)
Chart on Europe - Year-over-year growth 2024-2029 (%)
Data Table on Europe - Year-over-year growth 2024-2029 (%)
Chart on Regional Comparison - Europe
Data Table on Regional Comparison - Europe

12.5.1 Germany - Market size and forecast 2024-2029

Chart on Germany - Market size and forecast 2024-2029 ($ million)
Data Table on Germany - Market size and forecast 2024-2029 ($ million)
Chart on Germany - Year-over-year growth 2024-2029 (%)
Data Table on Germany - Year-over-year growth 2024-2029 (%)

12.5.2 UK - Market size and forecast 2024-2029

Chart on UK - Market size and forecast 2024-2029 ($ million)
Data Table on UK - Market size and forecast 2024-2029 ($ million)
Chart on UK - Year-over-year growth 2024-2029 (%)
Data Table on UK - Year-over-year growth 2024-2029 (%)

12.5.3 France - Market size and forecast 2024-2029

Chart on France - Market size and forecast 2024-2029 ($ million)
Data Table on France - Market size and forecast 2024-2029 ($ million)
Chart on France - Year-over-year growth 2024-2029 (%)
Data Table on France - Year-over-year growth 2024-2029 (%)

12.5.4 Italy - Market size and forecast 2024-2029

Chart on Italy - Market size and forecast 2024-2029 ($ million)
Data Table on Italy - Market size and forecast 2024-2029 ($ million)
Chart on Italy - Year-over-year growth 2024-2029 (%)
Data Table on Italy - Year-over-year growth 2024-2029 (%)

12.5.5 Spain - Market size and forecast 2024-2029

Chart on Spain - Market size and forecast 2024-2029 ($ million)
Data Table on Spain - Market size and forecast 2024-2029 ($ million)
Chart on Spain - Year-over-year growth 2024-2029 (%)
Data Table on Spain - Year-over-year growth 2024-2029 (%)

12.5.6 The Netherlands - Market size and forecast 2024-2029

Chart on The Netherlands - Market size and forecast 2024-2029 ($ million)
Data Table on The Netherlands - Market size and forecast 2024-2029 ($ million)
Chart on The Netherlands - Year-over-year growth 2024-2029 (%)
Data Table on The Netherlands - Year-over-year growth 2024-2029 (%)

12.6 Middle East and Africa - Market size and forecast 2024-2029

Chart on Middle East and Africa - Market size and forecast 2024-2029 ($ million)
Data Table on Middle East and Africa - Market size and forecast 2024-2029 ($ million)
Chart on Middle East and Africa - Year-over-year growth 2024-2029 (%)
Data Table on Middle East and Africa - Year-over-year growth 2024-2029 (%)
Chart on Regional Comparison - Middle East and Africa
Data Table on Regional Comparison - Middle East and Africa

12.6.1 Saudi Arabia - Market size and forecast 2024-2029

Chart on Saudi Arabia - Market size and forecast 2024-2029 ($ million)
Data Table on Saudi Arabia - Market size and forecast 2024-2029 ($ million)
Chart on Saudi Arabia - Year-over-year growth 2024-2029 (%)
Data Table on Saudi Arabia - Year-over-year growth 2024-2029 (%)

12.6.2 UAE - Market size and forecast 2024-2029

Chart on UAE - Market size and forecast 2024-2029 ($ million)
Data Table on UAE - Market size and forecast 2024-2029 ($ million)
Chart on UAE - Year-over-year growth 2024-2029 (%)
Data Table on UAE - Year-over-year growth 2024-2029 (%)

12.6.3 South Africa - Market size and forecast 2024-2029

Chart on South Africa - Market size and forecast 2024-2029 ($ million)
Data Table on South Africa - Market size and forecast 2024-2029 ($ million)
Chart on South Africa - Year-over-year growth 2024-2029 (%)
Data Table on South Africa - Year-over-year growth 2024-2029 (%)

12.6.4 Turkey - Market size and forecast 2024-2029

Chart on Turkey - Market size and forecast 2024-2029 ($ million)
Data Table on Turkey - Market size and forecast 2024-2029 ($ million)
Chart on Turkey - Year-over-year growth 2024-2029 (%)
Data Table on Turkey - Year-over-year growth 2024-2029 (%)

12.6.5 Israel - Market size and forecast 2024-2029

Chart on Israel - Market size and forecast 2024-2029 ($ million)
Data Table on Israel - Market size and forecast 2024-2029 ($ million)
Chart on Israel - Year-over-year growth 2024-2029 (%)
Data Table on Israel - Year-over-year growth 2024-2029 (%)

12.7 South America - Market size and forecast 2024-2029

Chart on South America - Market size and forecast 2024-2029 ($ million)
Data Table on South America - Market size and forecast 2024-2029 ($ million)
Chart on South America - Year-over-year growth 2024-2029 (%)
Data Table on South America - Year-over-year growth 2024-2029 (%)
Chart on Regional Comparison - South America
Data Table on Regional Comparison - South America

12.7.1 Brazil - Market size and forecast 2024-2029

Chart on Brazil - Market size and forecast 2024-2029 ($ million)
Data Table on Brazil - Market size and forecast 2024-2029 ($ million)
Chart on Brazil - Year-over-year growth 2024-2029 (%)
Data Table on Brazil - Year-over-year growth 2024-2029 (%)

12.7.2 Argentina - Market size and forecast 2024-2029

Chart on Argentina - Market size and forecast 2024-2029 ($ million)
Data Table on Argentina - Market size and forecast 2024-2029 ($ million)
Chart on Argentina - Year-over-year growth 2024-2029 (%)
Data Table on Argentina - Year-over-year growth 2024-2029 (%)

12.7.3 Colombia - Market size and forecast 2024-2029

Chart on Colombia - Market size and forecast 2024-2029 ($ million)
Data Table on Colombia - Market size and forecast 2024-2029 ($ million)
Chart on Colombia - Year-over-year growth 2024-2029 (%)
Data Table on Colombia - Year-over-year growth 2024-2029 (%)

12.8 Market opportunity by geography

Market opportunity by geography ($ million)
Data Tables on Market opportunity by geography ($ million)

13. Drivers, Challenges, and Opportunity

13.1 Market drivers

Rising health consciousness and dietary shifts
Advancements in food technology and product innovation
Growing consumer awareness of environmental sustainability and animal welfare

13.2 Market challenges

Addressing sensory deficiencies to achieve mainstream acceptance
Navigating price volatility and production cost pressures
Contending with ambiguous regulatory frameworks and labeling conventions

13.3 Impact of drivers and challenges

Impact of drivers and challenges in 2024 and 2029

13.4 Market opportunities

Innovations in formulations enhancing sensory and functional attributes
Expansion of flavor profiles and product diversification
Mainstream retail expansion and entry of established brands

14. Competitive Landscape

14.1 Overview

14.2

Overview on criticality of inputs and factors of differentiation

14.3 Landscape disruption

Overview on factors of disruption

14.4 Industry risks

Impact of key risks on business

15. Competitive Analysis

15.1 Companies profiled

Companies covered

15.2 Company ranking index

15.3 Market positioning of companies

Matrix on companies position and classification

15.4 Better Butter Internet Pvt. Ltd.

Better Butter Internet Pvt. Ltd. - Overview
Better Butter Internet Pvt. Ltd. - Product / Service
Better Butter Internet Pvt. Ltd. - Key offerings
SWOT

15.5 Bunge Global SA

Bunge Global SA - Overview
Bunge Global SA - Business segments
Bunge Global SA - Key news
Bunge Global SA - Key offerings
Bunge Global SA - Segment focus
SWOT

15.6 Conagra Brands Inc.

Conagra Brands Inc. - Overview
Conagra Brands Inc. - Business segments
Conagra Brands Inc. - Key news
Conagra Brands Inc. - Key offerings
Conagra Brands Inc. - Segment focus
SWOT

15.7 Danone S.A.

Danone S.A. - Overview
Danone S.A. - Business segments
Danone S.A. - Key news
Danone S.A. - Key offerings
Danone S.A. - Segment focus
SWOT

15.8 Flora Food Group B.V.

Flora Food Group B.V. - Overview
Flora Food Group B.V. - Product / Service
Flora Food Group B.V. - Key offerings
SWOT

15.9 Jindilli Beverages LLC

Jindilli Beverages LLC - Overview
Jindilli Beverages LLC - Product / Service
Jindilli Beverages LLC - Key offerings
SWOT

15.10 Jojoba Desert A.C.S LTD.

Jojoba Desert A.C.S LTD. - Overview
Jojoba Desert A.C.S LTD. - Product / Service
Jojoba Desert A.C.S LTD. - Key offerings
SWOT

15.11 Miyokos Kitchen

Miyokos Kitchen - Overview
Miyokos Kitchen - Product / Service
Miyokos Kitchen - Key offerings
SWOT

15.12 MONTYS NYC LLC

MONTYS NYC LLC - Overview
MONTYS NYC LLC - Product / Service
MONTYS NYC LLC - Key offerings
SWOT

15.13 Naturli Foods AS

Naturli Foods AS - Overview
Naturli Foods AS - Product / Service
Naturli Foods AS - Key offerings
SWOT

15.14 Olivio Premium Products Corp.

Olivio Premium Products Corp. - Overview
Olivio Premium Products Corp. - Product / Service
Olivio Premium Products Corp. - Key offerings
SWOT

15.15 Prosperity Organic Foods Inc.

Prosperity Organic Foods Inc. - Overview
Prosperity Organic Foods Inc. - Product / Service
Prosperity Organic Foods Inc. - Key offerings
SWOT

15.16 The Chefs Warehouse

The Chefs Warehouse - Overview
The Chefs Warehouse - Product / Service
The Chefs Warehouse - Key offerings
SWOT

15.17 Trader Joes

Trader Joes - Overview
Trader Joes - Product / Service
Trader Joes - Key offerings
SWOT

15.18 WayFare Health Foods LLC.

WayFare Health Foods LLC. - Overview
WayFare Health Foods LLC. - Product / Service
WayFare Health Foods LLC. - Key offerings
SWOT

16. Appendix

16.1 Scope of the report

Market definition
Objectives
Notes and caveats

16.2 Inclusions and exclusions checklist

Inclusions checklist
Exclusions checklist

16.3 Currency conversion rates for US$

16.4 Research methodology

16.5 Data procurement

Information sources

16.6 Data validation

16.7 Validation techniques employed for market sizing

16.8 Data synthesis

16.9 360 degree market analysis

16.10 List of abbreviations

Research Methodology

Technavio presents a detailed picture of the market by way of study, synthesis, and summation of data from multiple sources. The analysts have presented the various facets of the market with a particular focus on identifying the key industry influencers. The data thus presented is comprehensive, reliable, and the result of extensive research, both primary and secondary.

INFORMATION SOURCES

Primary sources

  • Manufacturers and suppliers
  • Channel partners
  • Industry experts
  • Strategic decision makers

Secondary sources

  • Industry journals and periodicals
  • Government data
  • Financial reports of key industry players
  • Historical data
  • Press releases

DATA ANALYSIS

Data Synthesis

  • Collation of data
  • Estimation of key figures
  • Analysis of derived insights

Data Validation

  • Triangulation with data models
  • Reference against proprietary databases
  • Corroboration with industry experts

REPORT WRITING

Qualitative

  • Market drivers
  • Market challenges
  • Market trends
  • Five forces analysis

Quantitative

  • Market size and forecast
  • Market segmentation
  • Geographical insights
  • Competitive landscape

Interested in this report?

Get your sample now to see our research methodology and insights!

Download Now

Frequently Asked Questions

Plant Based Butter market growth will increase by USD 852.7 million during 2025-2029.

The Plant Based Butter market is expected to grow at a CAGR of 6% during 2025-2029.

Plant Based Butter market is segmented by Source (Coconut, Almond, Soy, Cashew, Others) Application (Spreading, Cooking and baking, Others) Distribution channel (Supermarkets and hypermarkets, Online, Convenience stores, Specialty stores)

Better Butter Internet Pvt. Ltd., Bunge Global SA, Compassionate Choices Pvt. Ltd., Conagra Brands Inc., Danone S.A., Flora Food Group B.V., Jindilli Beverages LLC, Jojoba Desert A.C.S LTD., Miyokos Kitchen, MONTYS NYC LLC, Naturli Foods AS, Olivio Premium Products Corp., PlantX, Prosperity Organic Foods Inc., The Chefs Warehouse, Trader Joes, WayFare Health Foods LLC. are a few of the key vendors in the Plant Based Butter market.

APAC will register the highest growth rate of 39.7% among the other regions. Therefore, the Plant Based Butter market in APAC is expected to garner significant business opportunities for the vendors during the forecast period.

China, India, Japan, South Korea, Australia, Indonesia, US, Canada, Mexico, Germany, UK, France, Italy, Spain, The Netherlands, Saudi Arabia, UAE, South Africa, Turkey, Israel, Brazil, Argentina, Colombia

  • Rising health consciousness and dietary shifts is the driving factor this market.

The Plant Based Butter market vendors should focus on grabbing business opportunities from the Source segment as it accounted for the largest market share in the base year.