Shea Butter Market Size 2025-2029
The shea butter market size is forecast to increase by USD 1.07 billion, at a CAGR of 7.4% between 2024 and 2029.
- The market is experiencing significant growth due to several key factors. One of the primary drivers is the increasing prevalence of lactose intolerance, leading to a rise in demand for dairy-free alternatives for skincare and cosmetic products. Another trend influencing the market is the introduction of shea butter-based products in various industries, including food, pharmaceuticals, and personal care. Regulatory requirements also play a crucial role in market growth, as governments and organizations enforce stricter regulations on the production and labeling of shea butter products. These factors contribute to the market's continued expansion and make it an attractive investment opportunity for businesses in the US and globally. The market analysis report provides a comprehensive overview of these trends and their impact on the shea butter industry.
What will be the Size of the Shea Butter Market During the Forecast Period?

- The market continues to experience strong growth, driven by increasing consumer demand for natural, eco-friendly, and ethically-sourced ingredients. Shea butter, derived from the nuts of the Shea tree, is renowned for its antioxidant properties and skin-nourishing benefits, making it a popular ingredient in various industries. In the cosmetics sector, shea butter is used in shampoos, hair care products, moisturizers, and cosmetics due to its therapeutic benefits. In the culinary world, shea butter is gaining traction as a novel food ingredient, finding applications in baked goods, chocolates, ice cream, and baby food. Shea butter production is undergoing significant transformations, with an emphasis on economic empowerment, sustainable practices, and truthful labeling.
- The supply chain is becoming more transparent, with companies like Sundial Brands leading the charge in promoting fair trade and ethical sourcing. Shea butter is increasingly being used as a substitute for chemical additives, such as potassium hydroxide, in various industries. Overall, the market is expected to continue its growth trajectory, driven by its versatility, health benefits, and consumer demand for natural and sustainable ingredients.
How is this Shea Butter Industry segmented and which is the largest segment?
The shea butter industry research report provides comprehensive data (region-wise segment analysis), with forecasts and estimates in "USD billion" for the period 2025-2029, as well as historical data from 2019-2023 for the following segments.
- Product
- Unrefined
- Refined
- Application
- Personal care
- Food
- Pharmaceuticals
- Geography
- Europe
- Germany
- UK
- France
- Italy
- Spain
- North America
- Canada
- US
- APAC
- China
- India
- Middle East and Africa
- South America
- Europe
By Product Insights
- The unrefined segment is estimated to witness significant growth during the forecast period.
Unrefined shea butter, sourced from West Africa using traditional methods without heat or chemicals, is a key component of The market. Its natural composition, rich in vitamins A, E, and F, makes it an effective emollient for improving skin clarity and health. The product's moisturizing, circulation-boosting, and anti-inflammatory properties make it a popular ingredient in various skincare products addressing issues such as dryness, wrinkles, dark spots, discolorations, stretch marks, and blemishes. Unrefined shea butter's benefits extend to hair growth and acne treatment, further increasing its demand in the market. Its natural properties make it a suitable alternative to chemically-laden products for individuals with conditions like psoriasis and dry skin.
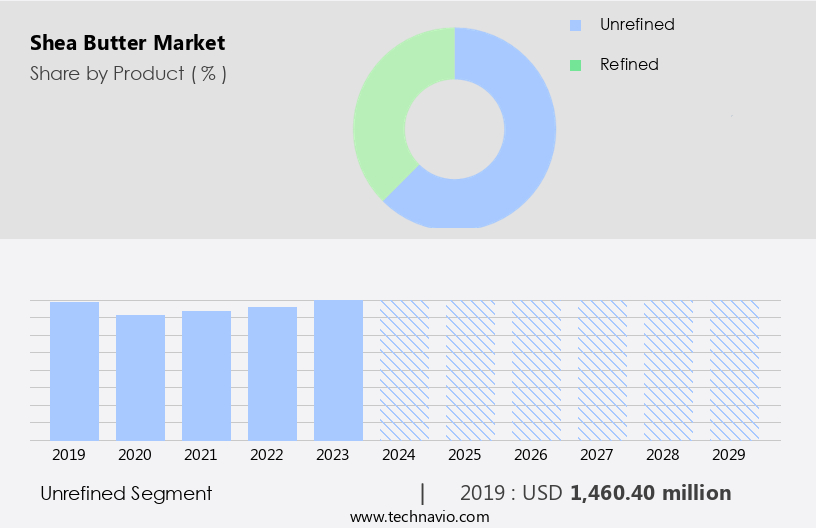
Get a glance at the Shea Butter Industry report of share of various segments Request Free Sample
The unrefined segment was valued at USD 1.46 billion in 2019 and showed a gradual increase during the forecast period.
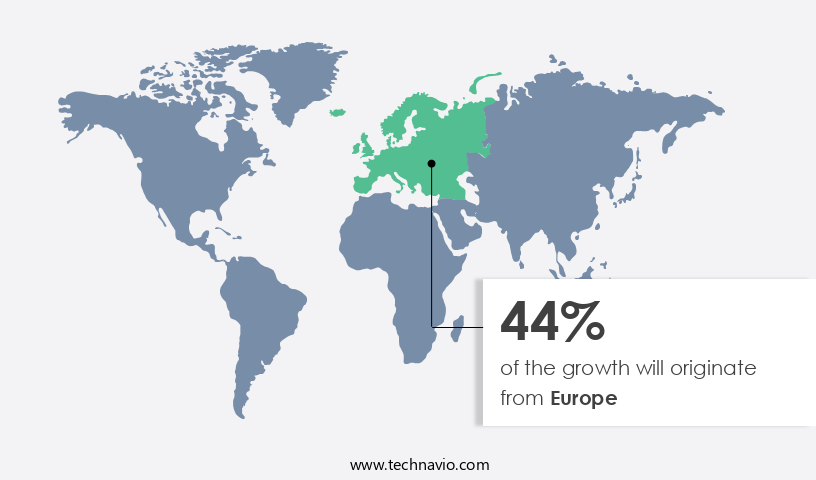
Regional Analysis
- Europe is estimated to contribute 44% to the growth of the global market during the forecast period.
Technavio's analysts have elaborately explained the regional trends and drivers that shape the market during the forecast period.
For more insights on the market share of various regions, Request Free Sample
The European market holds a significant position in the global shea butter industry, with Germany and France being key contributors. Germany, the largest cosmetics market in Europe, had a valuation of over USD14 billion in 2023, making it a significant player in the natural and organic cosmetics sector, which holds the largest market share in Europe. With a 6.2% share of global beauty product exports, Germany's influence in the regional market is substantial, driven by increasing consumer preference for natural and organic products. France, the second-largest cosmetics market in Europe, was valued at over USD 12 billion in 2023, further bolstering the regional market due to its large consumer base and high demand for natural ingredients.
Market Dynamics
Our shea butter market researchers analyzed the data with 2024 as the base year, along with the key drivers, trends, and challenges. A holistic analysis of drivers will help companies refine their marketing strategies to gain a competitive advantage.
What are the key market drivers leading to the rise in the adoption of the Shea Butter Industry?
Increasing prevalence of lactose intolerance is the key driver of the market.
- The market is experiencing significant growth due to the increasing consumer acceptance of natural skincare and hair products. Shea butter, derived from the nuts of the Shea tree, is known for its numerous health benefits for both skin and hair. This butter is rich in vitamins A and E, making it an effective moisturizer and anti-aging agent. It is also known for its anti-inflammatory properties, making it an excellent choice for individuals with conditions such as eczema, psoriasis, and acne. Shea butter is versatile and has various uses. It can be used as a hair conditioner for detangling and reducing hair frizz, a lip balm for softening and protecting lips, and a massage oil for relaxing muscles. It is also used in cosmetics, lotions, soaps, and creams, and as an alternative to cocoa butter in confectionery.
- Shea butter is also used in skincare for treating sunburn, dry skin, stretch marks, dark circles, and scars. Sustainability and ethical considerations are essential factors in the market. Consumers are increasingly demanding sustainable and ethically sourced shea butter. Many suppliers are now offering certified organic and fair trade shea butter to meet this demand. The processing of shea butter involves removing the impurities and extracting the butter from the nuts, which can be done using traditional methods or modern processing techniques. Shea butter is used in various applications, including food, where it is used as an ingredient in baking and cooking. It is also used in body care products, color cosmetics, and even in the production of raw shea butter for DIY recipes. The benefits of shea butter for hair care, including hair growth, are also gaining popularity.
What are the market trends shaping the Shea Butter Industry?
The introduction of shea butter-based products is the upcoming trend in the market.
- The market is experiencing significant growth due to the increasing consumer acceptance of natural skincare products. Shea Butter, a natural ingredient derived from the nuts of the Shea Tree, is renowned for its numerous health benefits for both hair and skin. This butter, which comes in various classes, including raw, unrefined, and refined, is used in a multitude of applications, from lotions and creams to cosmetics, soaps, and even baked goods. Shea Butter is rich in Vitamins E and A, making it an excellent choice for anti-aging, moisturizing, and healing various skin conditions such as eczema, psoriasis, sunburn, and stretch marks. It also helps in hair detangling, reducing hair frizz, and promoting hair growth.
- Furthermore, it is a popular ingredient in natural skin care recipes for lip balms, massage oils, and even nail care. The demand for sustainable Shea Butter is on the rise, with consumers increasingly seeking ethically sourced and certified Shea Butter from suppliers who prioritize sustainability and fair trade practices. Shea Butter is also used in the food industry, particularly in West African cuisine, and as an alternative to Cocoa Butter in confectionery. In summary, the market is witnessing a rise in demand due to its versatile uses, health benefits, and consumer preference for natural and sustainable ingredients. From hair care to skincare, cosmetics, and even food, Shea Butter continues to be a popular choice for consumers seeking effective and natural solutions for their daily needs.
What challenges does the Shea Butter Industry face during its growth?
Regulatory requirements is a key challenge affecting the industry growth.
- The market is driven by the increasing consumer acceptance of natural skincare and hair products. Shea Butter, a natural ingredient rich in vitamins E and A, offers numerous health benefits for hair and skin. The butter is available in various classes, including raw, unrefined, refined, and organic, catering to diverse consumer preferences. Shea Butter's uses extend beyond cosmetics and lotions, with applications in food, baking, and even confectionery. In natural skin care, Shea Butter is known for its moisturizing properties, making it an ideal ingredient for products targeting dry skin, eczema, psoriasis, and wrinkles. It is also used for hair care, including detangling, hair growth, and reducing frizz.
- However, the market faces challenges due to regulatory requirements. In the US, food product manufacturers must comply with the Food and Drug Administration (FDA) guidelines. These regulations cover ingredient safety, labeling, and manufacturing practices. Compliance is crucial for market entry and continued operation but can be resource-intensive and time-consuming. Sustainability is another critical factor in the market. Consumers are increasingly demanding sustainable and ethically sourced Shea Butter. Certifications such as Fair Trade and USDA Organic can help ensure the sustainability and ethical sourcing of Shea Butter.
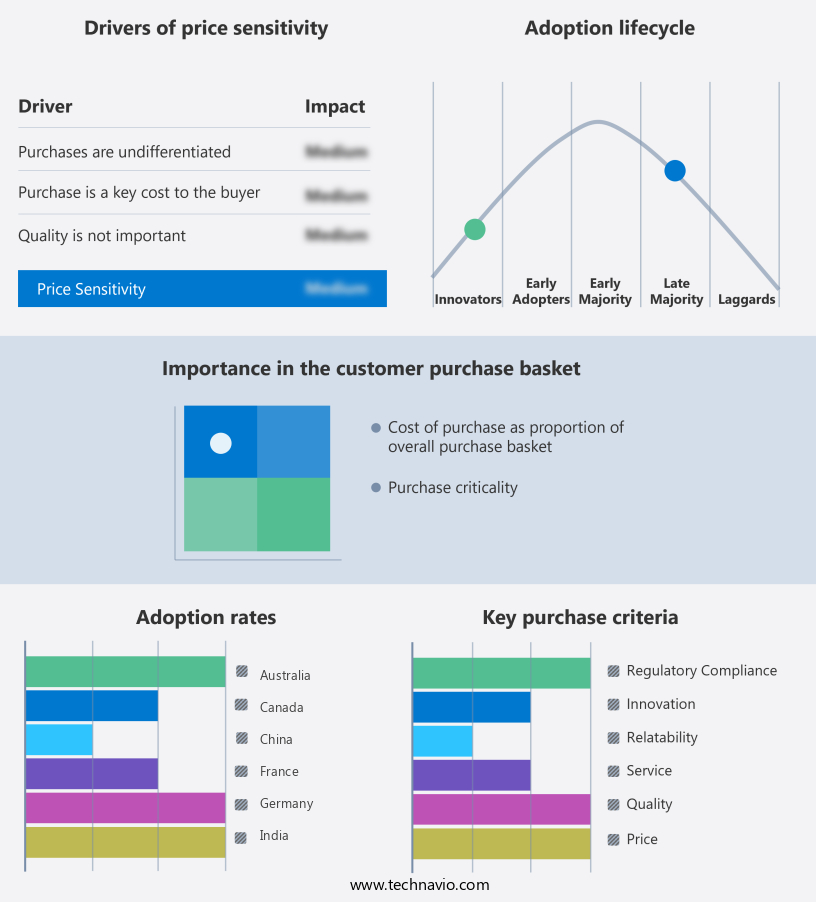
Exclusive Customer Landscape
The shea butter market forecasting report includes the adoption lifecycle of the market, covering from the innovator's stage to the laggard's stage. It focuses on adoption rates in different regions based on penetration. Furthermore, the market report also includes key purchase criteria and drivers of price sensitivity to help companies evaluate and develop their market growth analysis strategies.
Customer Landscape
Key Companies & Market Insights
Companies are implementing various strategies, such as strategic alliances, market forecast, partnerships, mergers and acquisitions, geographical expansion, and product/service launches, to enhance their presence in the industry.
AAK AB - The company offers shea butter such as Lipex Shea which is a climate-compensated, optimized pure shea butter with a superior crystallization profile and high oxidative stability.
The shea butter industry research and growth report includes detailed analyses of the competitive landscape of the market and information about key companies, including:
- Baraka Impact
- BASF SE
- Bunge Ltd.
- Cargill Inc.
- Clariant International Ltd.
- Cornelius
- Croda International Plc
- Enkay Indo Nigerian Ind. Ltd.
- Ghana Nuts Co. Ltd.
- Manorama Industries Ltd.
- Mary Tylor Naturals LLC
- Medikonda Nutrients
- OLVEA
- Pameri Organic US
- Sekaf Ghana Ltd.
- Shearadiance
- SOPHIM IBERIA S.L.
- Suru Chemicals and Pharmaceuticals Pvt. Ltd.
- The Savannah Fruits Co.
- Unilever PLC
- VedaOils
Qualitative and quantitative analysis of companies has been conducted to help clients understand the wider business environment as well as the strengths and weaknesses of key industry players. Data is qualitatively analyzed to categorize companies as pure play, category-focused, industry-focused, and diversified; it is quantitatively analyzed to categorize companies as dominant, leading, strong, tentative, and weak.
Research Analyst Overview
Shea butter, a natural fat extracted from the nuts of the Shea tree, has gained significant attention in various industries due to its numerous health benefits and versatile uses. This article provides an in-depth analysis of the market, focusing on consumer acceptance, processing techniques, sustainability, and applications. The global demand for shea butter continues to grow as consumers increasingly seek natural and ethical beauty ingredients. The natural skincare market, in particular, has seen a rise in demand for shea butter due to its moisturizing properties and ability to improve skin health. Consumers appreciate its benefits for various skin concerns, such as dryness, eczema, acne, and wrinkles.
Moreover, the versatility of shea butter extends to hair care, where it is used for detangling, frizz control, and hair growth. Shea butter processing involves several stages, including farming, collection, and refining. Farming is a crucial aspect of the market, as the quality of the raw material significantly impacts the final product. Traditional methods of processing shea butter include sun drying and manual extraction, while modern techniques include hydraulic pressing and solvent extraction. The choice of processing method can influence the butter's color, texture, and aroma. Sustainability is a critical concern in the market, as the industry has faced challenges related to deforestation and fair labor practices.
In addition, several organizations offer certifications to ensure the ethical and sustainable production of shea butter. These certifications include Fair Trade, UTZ, and Rainforest Alliance. Consumers are increasingly seeking out these certified products to support sustainable farming practices and fair labor conditions. Shea butter has a wide range of applications, including cosmetics, food, and confectionery. In the cosmetics industry, shea butter is used in lotions, creams, body butters, soaps, and color cosmetics. Its benefits extend to skincare, where it is used for moisturizing, anti-aging, and sunburn relief.
|
Shea Butter Market Scope |
|
|
Report Coverage |
Details |
|
Page number |
201 |
|
Base year |
2024 |
|
Historic period |
2019-2023 |
|
Forecast period |
2025-2029 |
|
Growth momentum & CAGR |
Accelerate at a CAGR of 7.4% |
|
Market Growth 2025-2029 |
USD 1.07 billion |
|
Market structure |
Fragmented |
|
YoY growth 2024-2025(%) |
6.0 |
|
Key countries |
US, UK, China, Germany, France, Italy, India, Spain, Canada, and Australia |
|
Competitive landscape |
Leading Companies, Market Positioning of Companies, Competitive Strategies, and Industry Risks |
What are the Key Data Covered in this Market Research and Growth Report?
- CAGR of the Shea Butter industry during the forecast period
- Detailed information on factors that will drive the market growth and forecasting between 2025 and 2029
- Precise estimation of the size of the market and its contribution of the industry in focus to the parent market
- Accurate predictions about upcoming market growth and trends and changes in consumer behaviour
- Growth of the market across Europe, North America, APAC, Middle East and Africa, and South America
- Thorough analysis of the market's competitive landscape and detailed information about companies
- Comprehensive analysis of factors that will challenge the growth of industry companies
We can help! Our analysts can customize this market research report to meet your requirements.
 RIA -
RIA - 
