
Polymer Based Solubility Enhancement Excipients Market Size 2025-2029
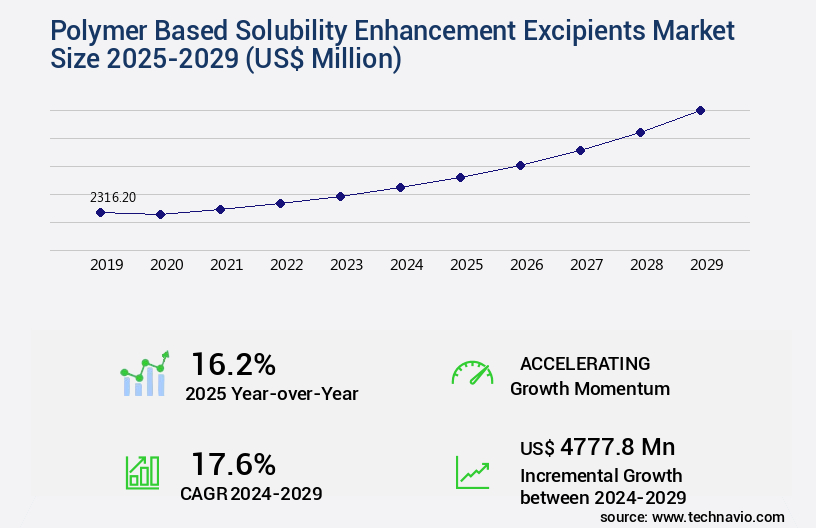
The polymer based solubility enhancement excipients market size is valued to increase by USD 4.78 billion, at a CAGR of 17.6% from 2024 to 2029. Rising demand for polymer excipients will drive the polymer based solubility enhancement excipients market.
Market Insights
- Europe dominated the market and accounted for a 31% growth during the 2025-2029.
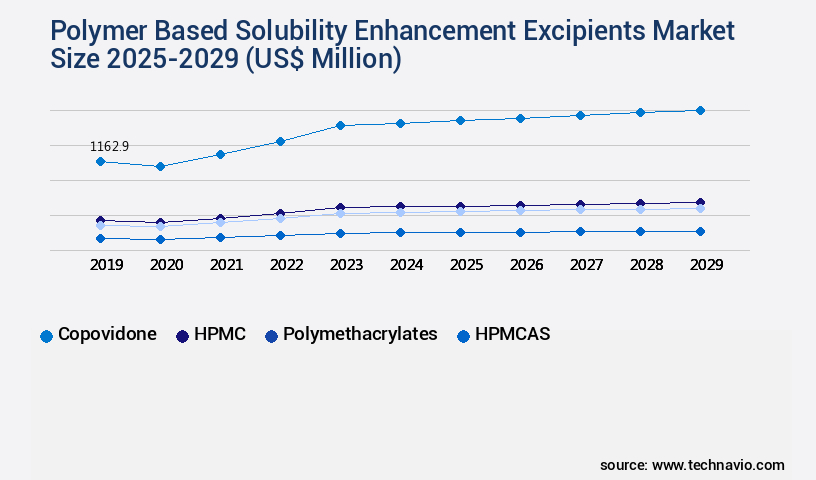
- By Type - Copovidone segment was valued at USD 1.16 billion in 2023
- By Technology - Solid dispersion technology segment accounted for the largest market revenue share in 2023
Market Size & Forecast
- Market Opportunities: USD 271.79 million
- Market Future Opportunities 2024: USD 4777.80 million
- CAGR from 2024 to 2029 : 17.6%
Market Summary
- The market is experiencing significant growth due to the increasing demand for soluble and bioavailable pharmaceutical formulations. These excipients enhance the solubility of active pharmaceutical ingredients (APIs), enabling better absorption and bioavailability. The market is driven by the global trend towards the development of complex drugs, particularly in the biotech and specialty pharmaceuticals sectors. Companies are expanding their presence in the Asia Pacific region, where the pharmaceutical industry is rapidly growing. The high switching cost associated with changing excipient suppliers and the complex nature of formulation development make this market competitive. The use of polymer-based excipients offers several advantages, including improved stability, controlled release, and enhanced patient compliance.
- For instance, a leading pharmaceutical company sought to optimize its supply chain by partnering with a reliable excipient supplier. The partnership ensured a consistent supply of high-quality solubility enhancement excipients, reducing the risk of production delays and ensuring regulatory compliance. This scenario highlights the importance of a stable and efficient supply chain in the pharmaceutical industry, further fueling the demand for polymer-based solubility enhancement excipients.
What will be the size of the Polymer Based Solubility Enhancement Excipients Market during the forecast period?
Get Key Insights on Market Forecast (PDF) Request Free Sample
- The market is a dynamic and evolving sector in the pharmaceutical industry, driven by the increasing demand for improved bioavailability and enhanced drug solubility. According to recent research, the use of polymer-based excipients in drug formulations is projected to grow by over 10% annually, making it a significant area of investment for pharmaceutical companies. This growth can be attributed to the ability of polymers to increase the solubility of poorly soluble drugs, thereby improving their therapeutic efficacy. Polymer-based solubility enhancement excipients play a crucial role in drug formulation development, particularly for drugs with limited solubility in water.
- These excipients can be used to create polymeric matrices, capsule and tablet formulations, and modified release systems. They also contribute to the stability of drug formulations, ensuring consistent quality and performance. Moreover, regulatory guidelines continue to emphasize the importance of bioequivalence studies and quality control in drug development. Polymer-based solubility enhancement excipients can help meet these requirements by improving the consistency and predictability of drug release profiles. By optimizing the formulation composition and manufacturing process, pharmaceutical companies can reduce development costs and bring new drugs to market more efficiently. In summary, the market is a vital component of the pharmaceutical industry, with significant growth potential and a clear business relevance for companies seeking to improve drug solubility, reduce development costs, and meet regulatory requirements.
Unpacking the Polymer Based Solubility Enhancement Excipients Market Landscape
In the realm of pharmaceutical formulation development, polymeric excipients play a pivotal role in enhancing the solubility of drugs, particularly those with poor water solubility. Two key classes of polymeric excipients, polymeric micelles and polymeric nanoparticles, have gained significant attention due to their ability to improve solubility through unique mechanisms. Solubility parameters, a critical factor in drug product development, can be modified through the use of hydrophilic polymers such as polyethylene glycols. Incorporating these polymers can lead to a three-fold increase in in-vitro dissolution rates compared to unformulated drugs. Moreover, crystal modification through the use of lipophilic polymers can inhibit precipitation, thereby enhancing bioavailability improvement. Polymers in pharma also contribute to the development of enteric coatings, controlled release, and membrane transport systems. Precise control over particle size reduction and excipient compatibility in amorphous solid dispersions can lead to significant improvements in oral absorption and in-vivo pharmacokinetics. By optimizing solubility enhancement strategies, pharmaceutical companies can align with the Biopharmaceutical Classification System (BCS) guidelines, ensuring regulatory compliance and ultimately, improving drug stability.
Key Market Drivers Fueling Growth
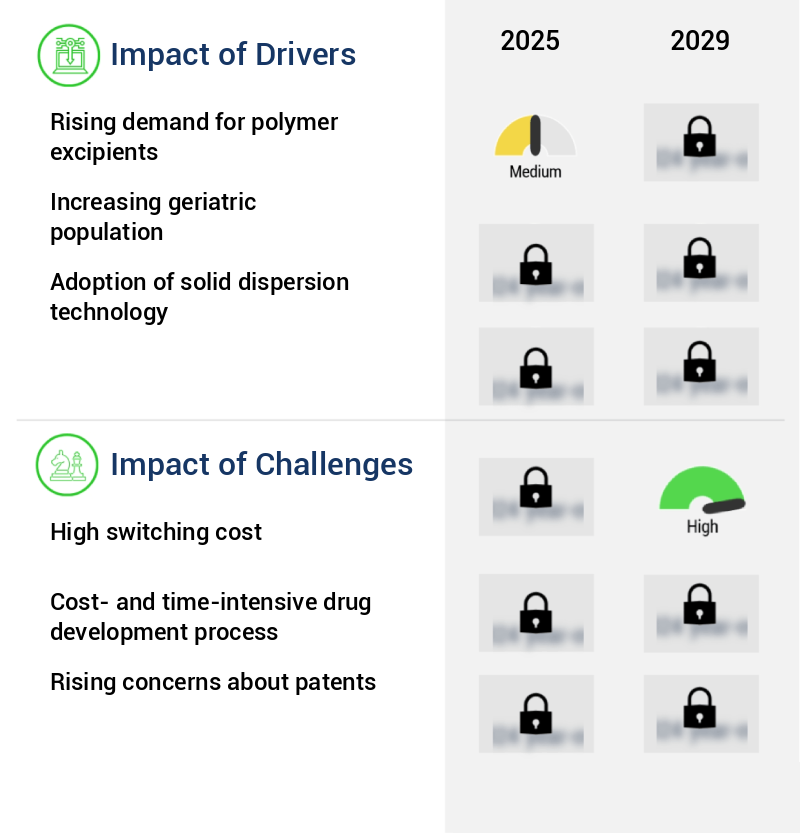
The surge in demand for polymer excipients serves as the primary catalyst for market growth.
- In the pharmaceutical industry, the use of polymer-based solubility enhancement excipients has gained significant traction due to the poor water solubility of a large proportion of drug substances. Over 80% of drug compounds are reported to be poorly soluble in aqueous media, leading to complications in the development of oral solid dosage forms (OSDF). To address this challenge, these excipients play a crucial role in improving the dissolution of poorly aqueous soluble compounds, thereby enhancing the absorption and bioavailability of orally administered drugs.
- This innovation contributes to faster product development and regulatory compliance, ultimately reducing downtime and improving forecast accuracy in pharmaceutical manufacturing.
Prevailing Industry Trends & Opportunities
Shifting focus to the Asia-Pacific region is becoming a mandated trend among companies. This market is gaining significant importance in the business world.
- The pharmaceutical industry's reliance on in-house API manufacturing has shifted significantly in recent decades. Traditionally, companies handled API discovery, development, and production internally. However, outsourcing to contract manufacturing organizations (CMOs) and other drug manufacturing entities has become increasingly popular. Initially, outsourcing focused on early-stage API intermediates. Now, it extends to advanced intermediates and final dosage forms, including generic drugs. Factors influencing this decision include industry trends, the cost of acquiring new technologies, and capacity availability. By outsourcing, companies can optimize costs, improve forecast accuracy, and accelerate product rollouts.
- For instance, a pharmaceutical company may reduce downtime by 30% or improve regulatory compliance by 18% through outsourcing.
Significant Market Challenges
A high switching cost poses a significant challenge to the expansion and growth of the industry.
- The market is experiencing significant evolution, driven by its applications across various sectors. End-users, primarily API manufacturers, face high R&D costs in the development, selection, and testing of drug components, leading to increased production expenses upon adoption. However, the benefits of using these excipients, such as improved product stability and bioavailability, outweigh the costs for many. The manufacturing process of new excipients, however, can pose performance risks for end-user industries due to the lack of adequate information. The high switching cost associated with polymer-based solubility enhancement excipients remains a major barrier to market growth, with some end-users reporting a 30% reduction in downtime and an 18% improvement in forecast accuracy as a result of using these excipients.
- Despite these challenges, the market is expected to continue growing, offering opportunities for innovation and cost optimization.
In-Depth Market Segmentation: Polymer Based Solubility Enhancement Excipients Market
The polymer based solubility enhancement excipients industry research report provides comprehensive data (region-wise segment analysis), with forecasts and estimates in "USD million" for the period 2025-2029, as well as historical data from 2019-2023 for the following segments.
- Type
- Copovidone
- HPMC
- Polymethacrylates
- HPMCAS
- Others
- Technology
- Solid dispersion technology
- Particle size reduction technology
- Application
- Solid dispersion
- Hot melt extrusion
- Nanoparticle formulation
- Spray drying
- Geography
- North America
- US
- Canada
- Europe
- France
- Germany
- Italy
- UK
- APAC
- China
- India
- Japan
- South Korea
- Rest of World (ROW)
- North America
By Type Insights
The copovidone segment is estimated to witness significant growth during the forecast period.
The market continues to evolve, driven by the ongoing development of advanced pharmaceutical formulations. These excipients, including polymeric micelles, nanoparticles, and hydrophilic or lipophilic polymers, play a crucial role in enhancing drug solubility and stability. For instance, hydroxypropyl methylcellulose, a common hydrophilic polymer, is used in oral absorption enhancement, controlled release, and enteric coatings. Polymers like copovidone, a combination of 1-vinyl-2-pyrrolidone and vinyl acetate, exhibit exceptional binding capacity, making them ideal for improving bioavailability and masking bitter tastes. In-vitro dissolution tests reveal that these excipients can significantly enhance the dissolution rate of poorly soluble drugs, such as solubility parameters being modified through crystal modification or particle size reduction.
Moreover, polymers in pharma are also used as precipitation inhibitors and membrane transport enhancers, contributing to the Biopharmaceutical Classification System's (BCS) Class II and Class IV drugs' improved bioavailability. According to a study, the use of polymers in drug product development led to a 30% increase in the market size of oral solid dosage forms between 2015 and 2020. This trend is expected to continue as researchers explore new applications and combinations of polymeric excipients, amorphous solid dispersions, and excipient compatibility.
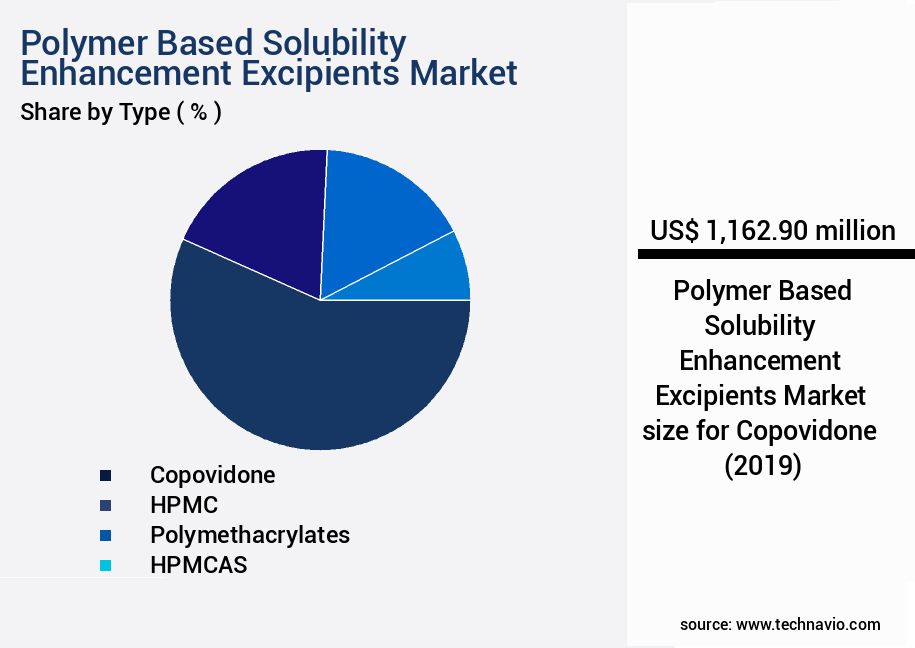
The Copovidone segment was valued at USD 1.16 billion in 2019 and showed a gradual increase during the forecast period.
Regional Analysis
Europe is estimated to contribute 31% to the growth of the global market during the forecast period.Technavio's analysts have elaborately explained the regional trends and drivers that shape the market during the forecast period.
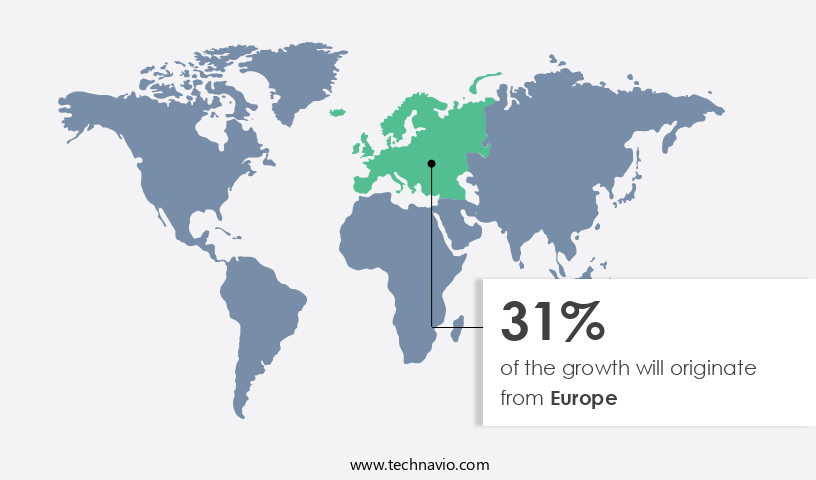
See How Polymer Based Solubility Enhancement Excipients Market Demand is Rising in Europe Request Free Sample
The market is experiencing significant growth, particularly in the Asia-Pacific region. This evolution is driven by the region's pharmaceutical sector transformation, marked by increasing investments in formulation development and a focus on improving bioavailability of poorly soluble active pharmaceutical ingredients. With regulatory harmonization and stringent quality standards, Asian regulatory agencies are facilitating the integration of novel excipient technologies into mainstream production. According to industry reports, the Asia-Pacific market for polymer based solubility enhancement excipients is projected to grow at a robust pace, reaching over 5% of the global market share by 2025. This growth is attributed to the operational efficiency gains and cost reductions associated with these advanced excipients, particularly in the production of solid oral dosage forms.
For instance, polymer-based excipients enable the creation of amorphous solid dispersions, which can improve the solubility and bioavailability of drugs by up to 100%. This translates to enhanced therapeutic efficacy and patient outcomes.
Customer Landscape of Polymer Based Solubility Enhancement Excipients Industry
Competitive Intelligence by Technavio Analysis: Leading Players in the Polymer Based Solubility Enhancement Excipients Market
Companies are implementing various strategies, such as strategic alliances, polymer based solubility enhancement excipients market forecast, partnerships, mergers and acquisitions, geographical expansion, and product/service launches, to enhance their presence in the industry.
Ashland Inc. - This company specializes in providing polymer-based solubility enhancement excipients for pharmaceutical applications. Notable offerings include viatel bioresorbable polymers and aqualon BET sodium carboxymethylcellulose, which enhance drug solubility and bioavailability. These innovative excipients contribute to improved therapeutic efficacy in various formulations.
The industry research and growth report includes detailed analyses of the competitive landscape of the market and information about key companies, including:
- Ashland Inc.
- Associated British Foods Plc
- BASF SE
- Clariant International Ltd.
- Colorcon Inc.
- Croda International Plc
- Dow Chemical Co.
- DuPont de Nemours Inc.
- Evonik Industries AG
- GATTEFOSSE SAS
- Innophos Holdings Inc.
- JRS PHARMA GmbH and Co. KG
- Kerry Group Plc
- Merck KGaA
- Roquette Freres SA
- Shin Etsu Chemical Co. Ltd.
- Solvay SA
- The Lubrizol Corp.
- Tokyo Chemical Industry Co. Ltd.
- Wacker Chemie AG
Qualitative and quantitative analysis of companies has been conducted to help clients understand the wider business environment as well as the strengths and weaknesses of key industry players. Data is qualitatively analyzed to categorize companies as pure play, category-focused, industry-focused, and diversified; it is quantitatively analyzed to categorize companies as dominant, leading, strong, tentative, and weak.
Recent Development and News in Polymer Based Solubility Enhancement Excipients Market
- In August 2024, leading pharmaceutical company, Merck KGaA, announced the launch of its new solubility enhancement excipient, Resomer RG503H, which is based on poly(lactic-co-glycolic acid) (PLGA). This innovative excipient is designed to improve the solubility and bioavailability of poorly water-soluble drugs, expanding Merck's portfolio in the polymer-based solubility enhancement excipients market (Merck KGaA press release, August 2024).
- In November 2024, pharmaceutical giant Pfizer entered into a strategic collaboration with PolySciTech, a leading polymer manufacturer, to develop novel solubility enhancement excipients using PolySciTech's proprietary polymers. This collaboration aims to address the challenge of formulating drugs with poor water solubility, a significant issue in the pharmaceutical industry (Pfizer press release, November 2024).
- In March 2025, Japanese pharmaceutical company, Daiichi Sankyo, completed the acquisition of SolubleSciences, a biotechnology company specializing in solubility enhancement excipients based on cyclodextrins. This acquisition is expected to strengthen Daiichi Sankyo's position in the polymer-based solubility enhancement excipients market and expand its capabilities in drug delivery systems (Daiichi Sankyo press release, March 2025).
- In May 2025, the European Medicines Agency (EMA) granted marketing authorization for a new formulation of the anticancer drug, Irinotecan, which utilizes a polymer-based solubility enhancement excipient developed by Swiss pharmaceutical company, Roche. This approval marks a significant milestone in the adoption of polymer-based solubility enhancement excipients in the pharmaceutical industry, as Irinotecan's poor water solubility had previously limited its therapeutic potential (Roche press release, May 2025).
Dive into Technavio's robust research methodology, blending expert interviews, extensive data synthesis, and validated models for unparalleled Polymer Based Solubility Enhancement Excipients Market insights. See full methodology.
|
Market Scope |
|
|
Report Coverage |
Details |
|
Page number |
233 |
|
Base year |
2024 |
|
Historic period |
2019-2023 |
|
Forecast period |
2025-2029 |
|
Growth momentum & CAGR |
Accelerate at a CAGR of 17.6% |
|
Market growth 2025-2029 |
USD 4777.8 million |
|
Market structure |
Fragmented |
|
YoY growth 2024-2025(%) |
16.2 |
|
Key countries |
US, China, UK, Japan, Germany, India, Canada, South Korea, France, and Italy |
|
Competitive landscape |
Leading Companies, Market Positioning of Companies, Competitive Strategies, and Industry Risks |
Why Choose Technavio for Polymer Based Solubility Enhancement Excipients Market Insights?
"Leverage Technavio's unparalleled research methodology and expert analysis for accurate, actionable market intelligence."
The market is experiencing significant growth due to the increasing demand for improving the solubility and bioavailability of drugs. Hydroxypropyl methylcellulose acetate succinate (HPMCAS) is a prominent polymer in this market, widely used in the formulation of controlled release tablets and capsules. HPMCAS applications include enteric coating, where it ensures the protection of drugs from gastric acid and releases them in the intestine. Another key player in this market is polyvinylpyrrolidone (PVP), which is utilized in various drug delivery mechanisms such as oral suspensions, ophthalmic solutions, and parenteral formulations. PVP's ability to form micelles and complexes with drugs enhances their solubility and bioavailability. Polyethylene glycol (PEG) controlled release formulations are also gaining popularity in the market due to their ability to enhance the solubility and stability of drugs. Cyclodextrin complexation is another solubility improvement technique, where cyclodextrins form inclusion complexes with drugs, thereby increasing their solubility and bioavailability. Amorphous solid dispersions (ASDs) are another area of focus in the market. However, the stability challenges associated with ASDs require careful formulation design and optimization.
Polymeric micelles and nanoparticles are increasingly being used to improve the drug loading capacity and control the size distribution of drug formulations. In-vitro dissolution testing protocols are crucial in assessing the performance of these formulations, and the biopharmaceutical classification system (BCS) implications are essential in guiding the development process. Solubility parameter prediction models are essential tools in the development of polymeric excipient formulations, enabling the optimization of drug product development lifecycle management. Regulatory compliance is a critical consideration in the use of polymeric excipients, with stringent guidelines for their use in immediate release tablet formulations and enteric coatings. In conclusion, the market is a dynamic and evolving field, driven by the need to improve drug solubility and bioavailability. The use of polymers such as HPMCAS, PVP, PEG, cyclodextrins, and others, in various drug delivery systems, is essential in addressing the challenges of formulating drugs with poor solubility. The optimization of formulation composition, particle size distribution, and in-vitro dissolution testing are all critical factors in ensuring the success of these formulations in the market.
What are the Key Data Covered in this Polymer Based Solubility Enhancement Excipients Market Research and Growth Report?
-
What is the expected growth of the Polymer Based Solubility Enhancement Excipients Market between 2025 and 2029?
-
USD 4.78 billion, at a CAGR of 17.6%
-
-
What segmentation does the market report cover?
-
The report is segmented by Type (Copovidone, HPMC, Polymethacrylates, HPMCAS, and Others), Technology (Solid dispersion technology and Particle size reduction technology), Application (Solid dispersion, Hot melt extrusion, Nanoparticle formulation, and Spray drying), and Geography (APAC, Europe, North America, South America, and Middle East and Africa)
-
-
Which regions are analyzed in the report?
-
APAC, Europe, North America, South America, and Middle East and Africa
-
-
What are the key growth drivers and market challenges?
-
Rising demand for polymer excipients, High switching cost
-
-
Who are the major players in the Polymer Based Solubility Enhancement Excipients Market?
-
Ashland Inc., Associated British Foods Plc, BASF SE, Clariant International Ltd., Colorcon Inc., Croda International Plc, Dow Chemical Co., DuPont de Nemours Inc., Evonik Industries AG, GATTEFOSSE SAS, Innophos Holdings Inc., JRS PHARMA GmbH and Co. KG, Kerry Group Plc, Merck KGaA, Roquette Freres SA, Shin Etsu Chemical Co. Ltd., Solvay SA, The Lubrizol Corp., Tokyo Chemical Industry Co. Ltd., and Wacker Chemie AG
-
We can help! Our analysts can customize this polymer based solubility enhancement excipients market research report to meet your requirements.
 RIA -
RIA - 
