
Port Wine Market Size 2025-2029
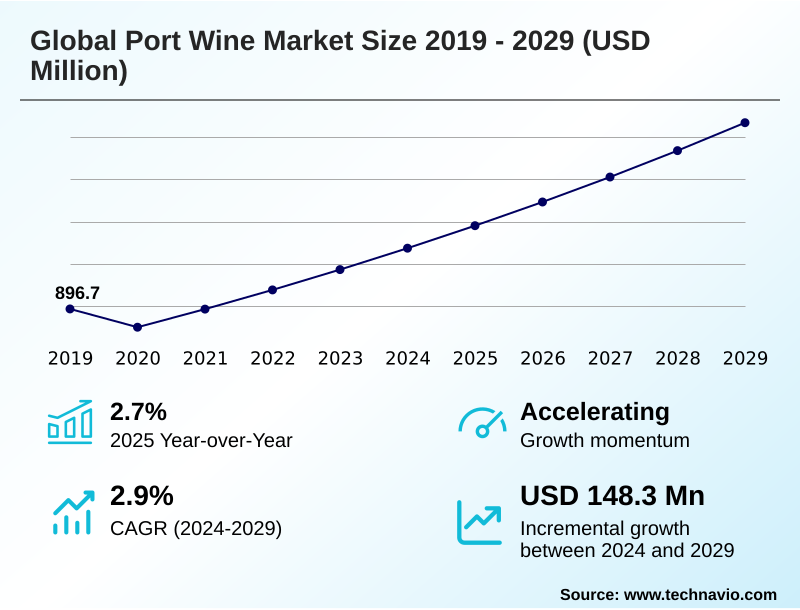
The port wine market size is valued to increase by USD 148.3 million, at a CAGR of 2.9% from 2024 to 2029. Enduring trend of premiumization and pursuit of affordable luxury will drive the port wine market.
Major Market Trends & Insights
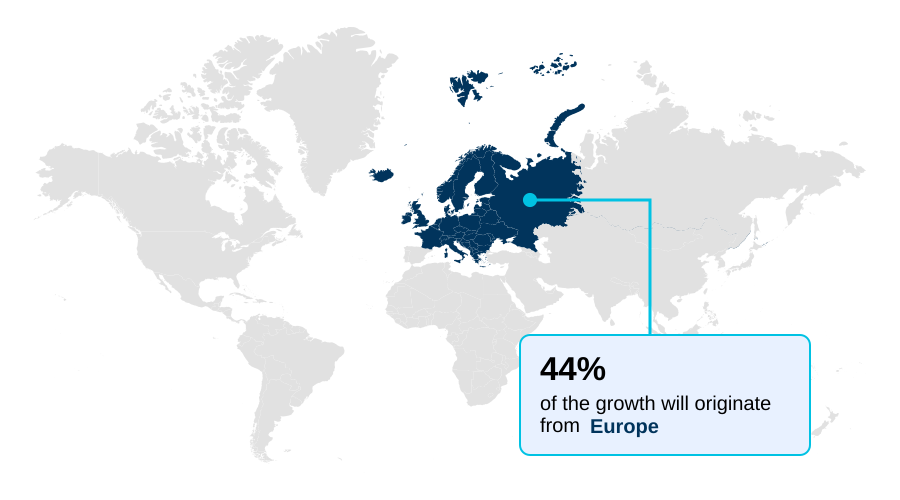
- Europe dominated the market and accounted for a 44.1% growth during the forecast period.
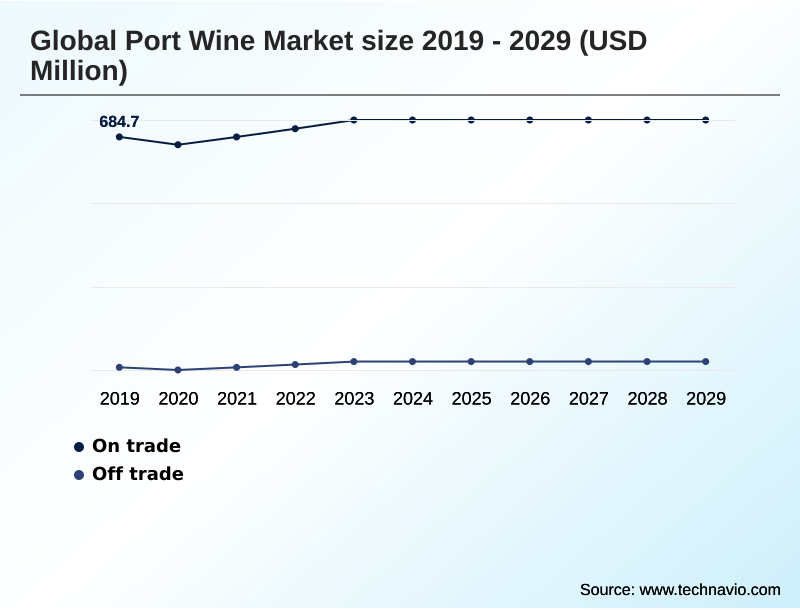
- By Distribution Channel - On trade segment was valued at USD 719.4 million in 2023
- By Type - Ruby segment accounted for the largest market revenue share in 2023
Market Size & Forecast
- Market Opportunities: USD 220.1 million
- Market Future Opportunities: USD 148.3 million
- CAGR from 2024 to 2029 : 2.9%
Market Summary
- The port wine market is navigating a period of nuanced growth, shaped by a confluence of evolving consumer behaviors and environmental factors. A significant driver is the enduring trend of premiumization, with consumers increasingly prioritizing quality, craftsmanship, and the superior taste experience offered by aged expressions like aged tawny port and single quinta vintage.
- This shift supports the fortified wine market dynamics, encouraging an emphasis on provenance and heritage. However, the industry confronts the formidable challenge of climate change in the douro valley wine region, which threatens the unique douro valley terroir and traditional grape varietals. In response, a key operational focus involves leveraging data to optimize viticulture.
- For instance, producers are implementing advanced soil moisture monitoring systems to inform precision irrigation, a strategy that has demonstrated a capacity to reduce water consumption by over 15% without compromising grape quality. This proactive adaptation is essential for ensuring the long-term sustainability of the wine fortification process and maintaining the complex organoleptic profile prized by connoisseurs.
- The market is also diversifying through the rise of port wine cocktail recipes, making the category more accessible to a broader demographic.
What will be the Size of the Port Wine Market during the forecast period?
Get Key Insights on Market Forecast (PDF) Get Free Sample
How is the Port Wine Market Segmented?
The port wine industry research report provides comprehensive data (region-wise segment analysis), with forecasts and estimates in "USD million" for the period 2025-2029, as well as historical data from 2019-2023 for the following segments.
- Distribution channel
- On trade
- Off trade
- Type
- Ruby
- Tawny
- Vintage
- Packaging
- Bottles
- Box
- Bulk
- Geography
- Europe
- Germany
- UK
- France
- North America
- US
- Canada
- Mexico
- APAC
- China
- Japan
- India
- South America
- Brazil
- Argentina
- Middle East and Africa
- Saudi Arabia
- UAE
- South Africa
- Rest of World (ROW)
- Europe
By Distribution Channel Insights
The on trade segment is estimated to witness significant growth during the forecast period.
The on-trade channel, encompassing restaurants and bars, is a critical arena for brand building, where strategic placements can increase visibility by over 30%.
This segment capitalizes on experiential wine tourism and premiumization in wine, with sommeliers pivotal in shaping consumer choice. Establishments leverage unique organoleptic properties and offer diverse port wine styles to attract discerning clientele.
The on-trade wine sales environment fosters exploration of aged tawny port and other premium offerings, influenced by sommelier recommendations. Effective digital consumer engagement and a focus on the organoleptic profile are key.
The wine fortification process and details of the vineyard terroir are narratives that resonate here, driving value beyond the liquid itself, supported by robust direct-to-consumer wine sales strategies.
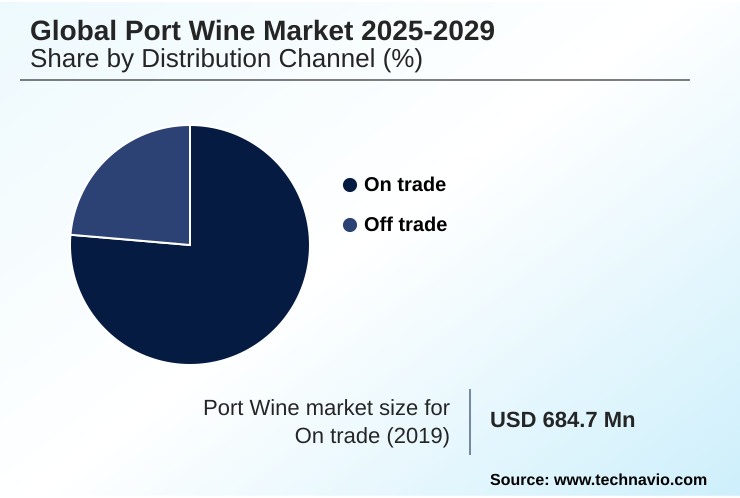
The On trade segment was valued at USD 719.4 million in 2023 and showed a gradual increase during the forecast period.
Regional Analysis
Europe is estimated to contribute 44.1% to the growth of the global market during the forecast period.Technavio’s analysts have elaborately explained the regional trends and drivers that shape the market during the forecast period.
See How Port Wine Market Demand is Rising in Europe Get Free Sample
While Europe remains the traditional heartland, the geographic landscape is evolving, with North America and APAC emerging as high-growth regions for premium offerings.
Europe is projected to contribute over 44% of the market's incremental growth, driven by established consumer loyalty and a robust on-trade wine sales culture.
In contrast, North America's market is expanding at a rate approximately 1.4 times faster than South America's, fueled by a growing connoisseur base seeking out late bottled vintage (lbv) and crusted port.
In APAC, importers leveraging wine traceability technology have cut customs clearance times by an average of 25%.
This market is showing a strong appetite for wine tourism development and products with clear terroir expression, including those made with tinta cão grape, while also navigating complex international trade tariffs.
Market Dynamics
Our researchers analyzed the data with 2024 as the base year, along with the key drivers, trends, and challenges. A holistic analysis of drivers will help companies refine their marketing strategies to gain a competitive advantage.
- Understanding the port wine market requires delving into its nuances, from the fundamental difference between ruby and tawny port to the intricate process of how is vintage port made. Consumer education is pivotal, as enthusiasts seek knowledge on topics like the best food pairing for LBV port and the distinct aging potential of colheita port.
- The category is also expanding beyond traditional consumption, evidenced by the rising popularity of serving white port and tonic and the evolution of port wine cocktails. For connoisseurs, understanding crusted port designation and the impact of oak on tawny port flavor is essential. Simultaneously, producers face pressing industry-level concerns.
- Implementing sustainability practices in Douro Valley is no longer optional, and navigating international port wine regulations presents ongoing complexities. Marketing heritage wine brands effectively while managing the challenges of international wine shipping are key business functions.
- This focus on quality and authenticity is critical for those investing in vintage port futures, as the role of fortification in wine preservation remains central. The industry is also seeing technological innovations in winemaking that improve consistency; some producers report achieving final product specifications with 99% accuracy, a marked improvement over less controlled methods.
- To support this, sommelier training for fortified wines and optimizing cellar conditions for aging are crucial for delivering the expected quality, which is intrinsically linked to the terroir influence on port wine style and managing vineyard yields for quality.
What are the key market drivers leading to the rise in the adoption of Port Wine Industry?
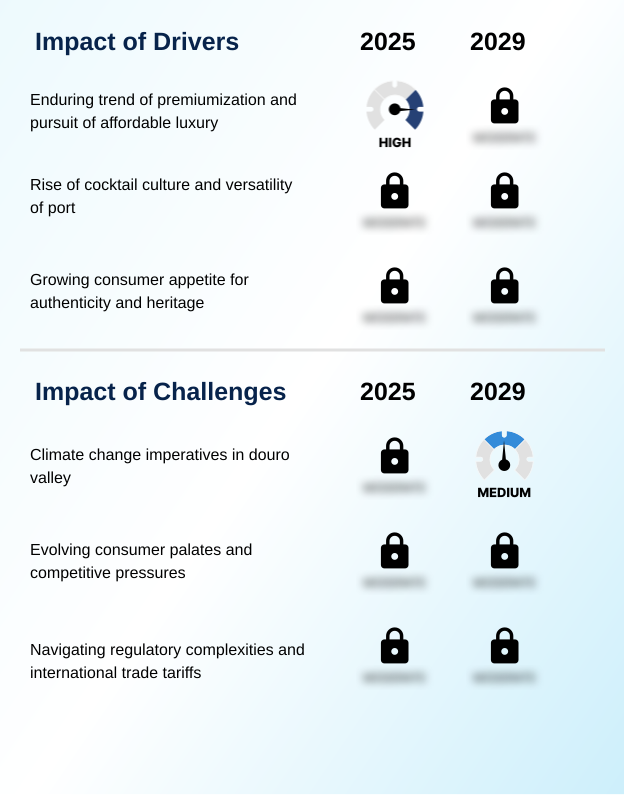
- The market is primarily driven by the enduring trend of premiumization and the consistent consumer pursuit of affordable luxury.
- The market is propelled by the enduring trend of premiumization and the consumer pursuit of affordable luxury, which elevates products with rich heritage and clear provenance.
- The rigorous port wine classification system underpins consumer confidence, with analysis showing a willingness to pay a 25% premium for bottles with documented age statements and strong vintage character.
- In the off-trade wine market, premium categories are outperforming standard ruby port characteristics in value growth by a ratio of nearly 2:1. This dynamic directly benefits offerings like colheita port and supports investment in longer barrel aging techniques.
- The driver is not merely about price but about the perceived value derived from the intricate autovinification process, careful grape selection like tinta barroca grape, and the narrative of the region, resonating with consumer palate evolution.
What are the market trends shaping the Port Wine Industry?
- A primary trend influencing the market is the ascent of premiumization. This is coupled with a growing consumer demand for experiential consumption opportunities.
- Key trends are reshaping the market, driven by the ascent of premiumization in wine and a demand for experiential consumption. This is evidenced by a shift toward high-value offerings such as vintage port, where a vintage port declaration creates significant market excitement. Consumers are increasingly engaging in experiential wine tourism, seeking authentic connections to the douro valley wine region.
- Brands offering immersive cellar tours report a 40% higher rate of repeat purchases from attendees. The trend extends to consumption occasions, with the growing popularity of port wine cocktail recipes broadening the category's appeal.
- The inclusion of premium white port production styles on cocktail menus has been shown to increase average check value by up to 10% in on-trade establishments, demonstrating the commercial impact of innovative consumer engagement.
What challenges does the Port Wine Industry face during its growth?
- A key challenge affecting industry growth stems from the imperatives of addressing climate change within the Douro Valley.
- The primary challenge confronting the market is the impact of climate change on viticulture, threatening the delicate balance of the Douro's ecosystem. Rising temperatures and erratic weather have led to harvest yield fluctuations of up to 20% in recent seasons, creating significant supply chain volatility.
- These conditions directly affect the phenolic compounds in wine and strain the viability of historic socalcos stone walls. Producers are actively investing in adaptive strategies; research into drought-resistant varietals shows a potential for 15% better water efficiency. Navigating regulatory compliance in wine production is becoming more complex, especially concerning water rights and land use.
- The challenge is to maintain the quality associated with traditional oxidative aging and reductive aging processes while mitigating environmental risks and adapting to new operational realities.
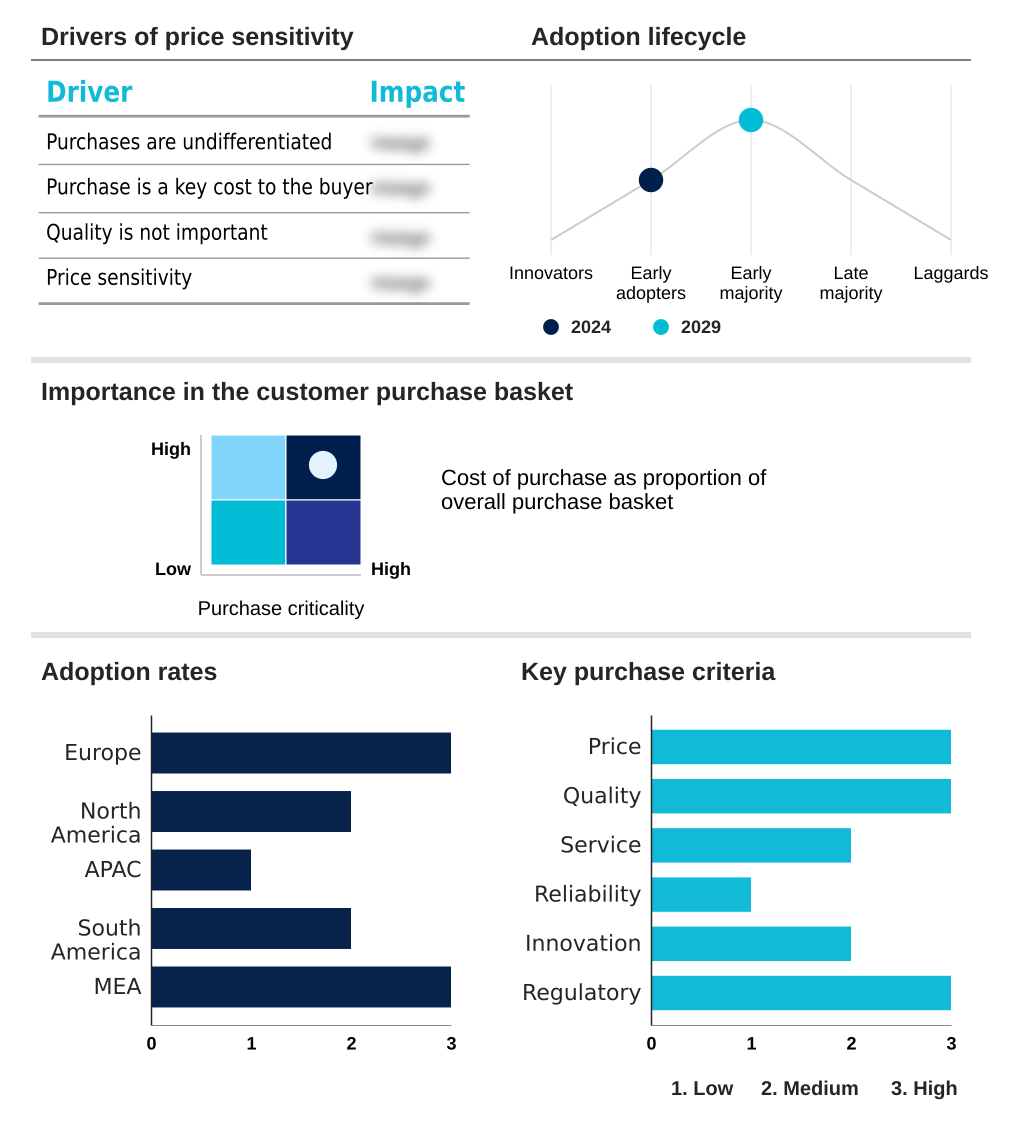
Exclusive Technavio Analysis on Customer Landscape
The port wine market forecasting report includes the adoption lifecycle of the market, covering from the innovator’s stage to the laggard’s stage. It focuses on adoption rates in different regions based on penetration. Furthermore, the port wine market report also includes key purchase criteria and drivers of price sensitivity to help companies evaluate and develop their market growth analysis strategies.
Customer Landscape of Port Wine Industry
Competitive Landscape
Companies are implementing various strategies, such as strategic alliances, port wine market forecast, partnerships, mergers and acquisitions, geographical expansion, and product/service launches, to enhance their presence in the industry.
Calabria Family Wines - Analysis indicates a portfolio centered on tawny port offerings, including grand reserve and fortified expressions, demonstrating a focus on aged fortified wine styles.
The industry research and growth report includes detailed analyses of the competitive landscape of the market and information about key companies, including:
- Calabria Family Wines
- Davy and Co. Ltd.
- DOWS Port
- Fonseca Port Wine
- Mazurans Vineyards Ltd.
- Niepoort Vinhos S.A.
- Quinta do Crasto SA
- Quinta do Noval
- Ramos Pinto
- sandeman and co. ltd.
- SOGEVINUS FINE WINES SA
- Sogrape SGPS SA
- Symington Family Estates Vinhos S.A.
- Taylors Port
- THE FLADGATE PARTNERSHIP
- Van Zellers and Co.
- Vinoquel Vinhos Oscar Quevedo Lda
Qualitative and quantitative analysis of companies has been conducted to help clients understand the wider business environment as well as the strengths and weaknesses of key industry players. Data is qualitatively analyzed to categorize companies as pure play, category-focused, industry-focused, and diversified; it is quantitatively analyzed to categorize companies as dominant, leading, strong, tentative, and weak.
Recent Development and News in Port wine market
- In May 2025, SOGEVINUS FINE WINES SA announced its rebranding to Kopke Group to leverage the brand recognition of its oldest port house, a move that includes a new corporate identity and investment in wine tourism.
- In March 2025, Quinta do Noval formally declared three exceptional vintage ports from the 2023 harvest, signaling a strong focus on the super-premium segment of the market and confidence in the vintage character.
- In January 2025, Fonseca Port Wine launched an enhanced visitor experience, introducing a new guided tour and dinner program featuring Fado entertainment to deepen consumer engagement and brand loyalty.
- In November 2024, Symington Family Estates Vinhos S.A. initiated a major sustainability program aimed at reducing water usage by 15% across its Douro Valley vineyards through the implementation of advanced precision irrigation technology.
Dive into Technavio’s robust research methodology, blending expert interviews, extensive data synthesis, and validated models for unparalleled Port Wine Market insights. See full methodology.
| Market Scope | |
|---|---|
| Page number | 276 |
| Base year | 2024 |
| Historic period | 2019-2023 |
| Forecast period | 2025-2029 |
| Growth momentum & CAGR | Accelerate at a CAGR of 2.9% |
| Market growth 2025-2029 | USD 148.3 million |
| Market structure | Fragmented |
| YoY growth 2024-2025(%) | 2.7% |
| Key countries | Germany, UK, France, Italy, Spain, The Netherlands, US, Canada, Mexico, China, Japan, India, South Korea, Australia, Indonesia, Brazil, Argentina, Chile, Saudi Arabia, UAE, South Africa, Israel and Turkey |
| Competitive landscape | Leading Companies, Market Positioning of Companies, Competitive Strategies, and Industry Risks |
Research Analyst Overview
- The port wine market is anchored in its unique douro valley terroir, with its value chain deeply rooted in heritage and the strictures of a designated origin. Boardroom decisions are increasingly centered on portfolio premiumization, influencing investment in extended cellar maturation for products like aged tawny port and single quinta vintage.
- The meticulous wine fortification process, choice of fortification spirit selection, and specific enological parameters are critical to defining quality. Traditional methods such as pipe-treading fermentation and lagar fermentation are balanced with modern techniques to enhance terroir expression and the final organoleptic profile.
- Grape varietal selection, featuring the touriga nacional grape, touriga franca grape, and tinta roriz grape, remains fundamental to achieving the desired vintage character. Producers investing in advanced barrel aging techniques have demonstrated the ability to reduce maturation losses by up to 5%, directly impacting inventory value.
- Challenges persist, particularly concerning the maintenance of historic socalcos stone walls amid changing environmental conditions. The focus remains on perfecting lees aging, the racking process, and bottle maturation to deliver products of exceptional quality.
What are the Key Data Covered in this Port Wine Market Research and Growth Report?
-
What is the expected growth of the Port Wine Market between 2025 and 2029?
-
USD 148.3 million, at a CAGR of 2.9%
-
-
What segmentation does the market report cover?
-
The report is segmented by Distribution Channel (On trade, and Off trade), Type (Ruby, Tawny, and Vintage), Packaging (Bottles, Box, and Bulk) and Geography (Europe, North America, APAC, South America, Middle East and Africa)
-
-
Which regions are analyzed in the report?
-
Europe, North America, APAC, South America and Middle East and Africa
-
-
What are the key growth drivers and market challenges?
-
Enduring trend of premiumization and pursuit of affordable luxury, Climate change imperatives in douro valley
-
-
Who are the major players in the Port Wine Market?
-
Calabria Family Wines, Davy and Co. Ltd., DOWS Port, Fonseca Port Wine, Mazurans Vineyards Ltd., Niepoort Vinhos S.A., Quinta do Crasto SA, Quinta do Noval, Ramos Pinto, sandeman and co. ltd., SOGEVINUS FINE WINES SA, Sogrape SGPS SA, Symington Family Estates Vinhos S.A., Taylors Port, THE FLADGATE PARTNERSHIP, Van Zellers and Co. and Vinoquel Vinhos Oscar Quevedo Lda
-
Market Research Insights
- The market's dynamics are increasingly shaped by strategic shifts in distribution and consumer engagement. The adoption of direct-to-consumer wine sales models has empowered producers, with early adopters reporting an average margin improvement of 20% compared to legacy wholesale channels. This move aligns with the trend of wine heritage branding, allowing for more direct storytelling.
- Furthermore, the imperative for sustainability in viticulture is driving innovation; firms implementing precision viticulture techniques have reduced water usage by up to 15%, enhancing both ecological credentials and operational resilience.
- The evolution of the consumer palate is also a key factor, with a growing interest in diverse port wine classification, compelling producers to innovate beyond traditional offerings and embrace new market opportunities through enhanced digital consumer engagement.
We can help! Our analysts can customize this port wine market research report to meet your requirements.
 RIA -
RIA - 
