
Wine E-Commerce Market Size 2025-2029
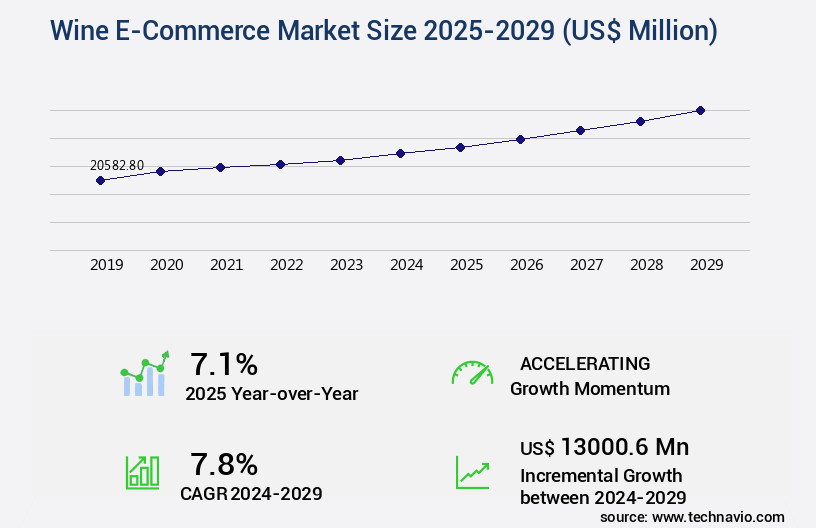
The wine e-commerce market size is valued to increase USD 13 billion, at a CAGR of 7.8% from 2024 to 2029. Increasing preference for online shopping will drive the wine e-commerce market.
Major Market Trends & Insights
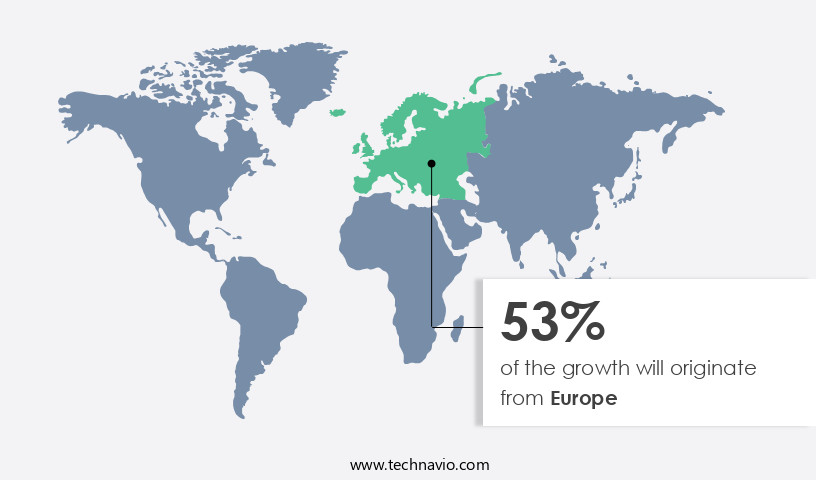
- Europe dominated the market and accounted for a 53% growth during the forecast period.
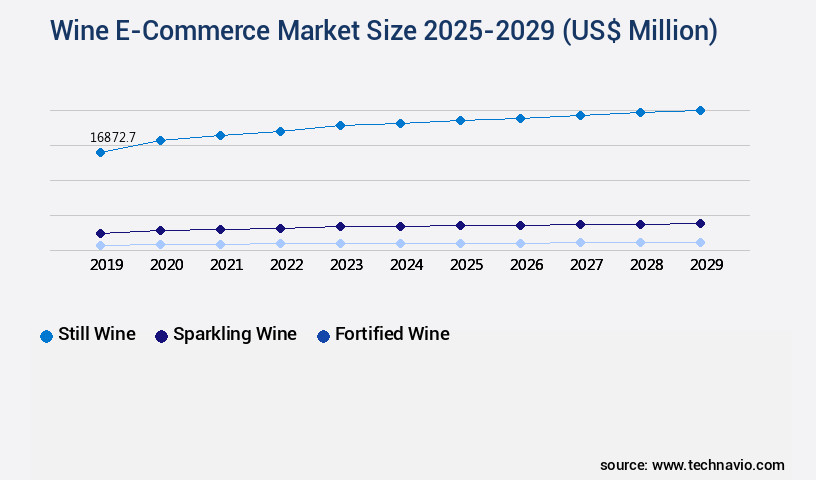
- By Product Type - Still wine segment was valued at USD 16.87 billion in 2023
- By Flavor - Red wine segment accounted for the largest market revenue share in 2023
Market Size & Forecast
- Market Opportunities: USD 101.04 million
- Market Future Opportunities: USD 13000.60 million
- CAGR : 7.8%
- Europe: Largest market in 2023
Market Summary
- The market represents a significant and continuously evolving sector, characterized by the increasing preference for online shopping and the rise in purchases of alcoholic beverages. According to Statista, global e-commerce wine sales are projected to reach USD15.3 billion by 2024, reflecting a substantial growth trajectory. Core technologies, such as artificial intelligence and machine learning, are revolutionizing the market by enhancing customer experiences through personalized recommendations and seamless transactions. Service types, including home delivery and subscription services, are gaining popularity, catering to consumers' convenience and flexibility.
- However, the market faces challenges from complex regulatory environments, particularly regarding the sale and delivery of alcoholic beverages to minors. Despite these hurdles, opportunities abound, including the expansion into emerging markets and the integration of advanced technologies to streamline operations and enhance customer engagement.
What will be the Size of the Wine E-Commerce Market during the forecast period?
Get Key Insights on Market Forecast (PDF) Request Free Sample
How is the Wine E-Commerce Market Segmented and what are the key trends of market segmentation?
The wine e-commerce industry research report provides comprehensive data (region-wise segment analysis), with forecasts and estimates in "USD million" for the period 2025-2029, as well as historical data from 2019-2023 for the following segments.
- Product Type
- Still wine
- Sparkling wine
- Fortified wine
- Flavor
- Red wine
- White wine
- Rose wine
- Distribution Platform
- Dedicated Wine Platforms
- General E-Commerce
- Winery Direct
- End-User
- Individual Consumers
- Restaurants
- Retail Stores
- Geography
- North America
- US
- Canada
- Europe
- France
- Germany
- Italy
- UK
- Middle East and Africa
- Egypt
- KSA
- Oman
- UAE
- APAC
- China
- India
- Japan
- South America
- Argentina
- Brazil
- Rest of World (ROW)
- North America
By Product Type Insights
The still wine segment is estimated to witness significant growth during the forecast period.
In the dynamic and evolving the market, still wine holds a significant share, accounting for approximately 85% of total sales. This segment encompasses the online purchase of non-carbonated wines, including red, white, and rose varieties. E-commerce platforms provide consumers with an extensive range of still wines, sourced from diverse regions and grape varieties, catering to various preferences and budgets. The integration of wine reviews and ratings aggregation enhances the consumer experience, enabling informed purchasing decisions. Data-driven wine selling and upselling techniques based on past purchases and preferences further boost sales. Wine e-commerce platforms prioritize efficient wine delivery logistics and order fulfillment processes to ensure timely and secure transactions.
Ecommerce wine analytics and inventory management systems facilitate effective stock control and customer retention strategies. Wine subscription services and online wine auctions cater to diverse consumer needs, while age verification systems and secure online transactions maintain regulatory compliance and consumer trust. Email marketing and digital wine marketing strategies, along with payment gateway integration, ensure seamless user experiences. Wine storage solutions and cross-selling wine strategies further enhance the value proposition. Responsive website design, loyalty program design, and fraud prevention systems address the evolving consumer demands and market trends. According to recent studies, the still wine segment in The market is projected to expand by 15% in the upcoming year.
Furthermore, industry experts anticipate a 20% increase in online wine sales over the next five years, driven by the convenience, accessibility, and personalized experiences offered by e-commerce platforms.
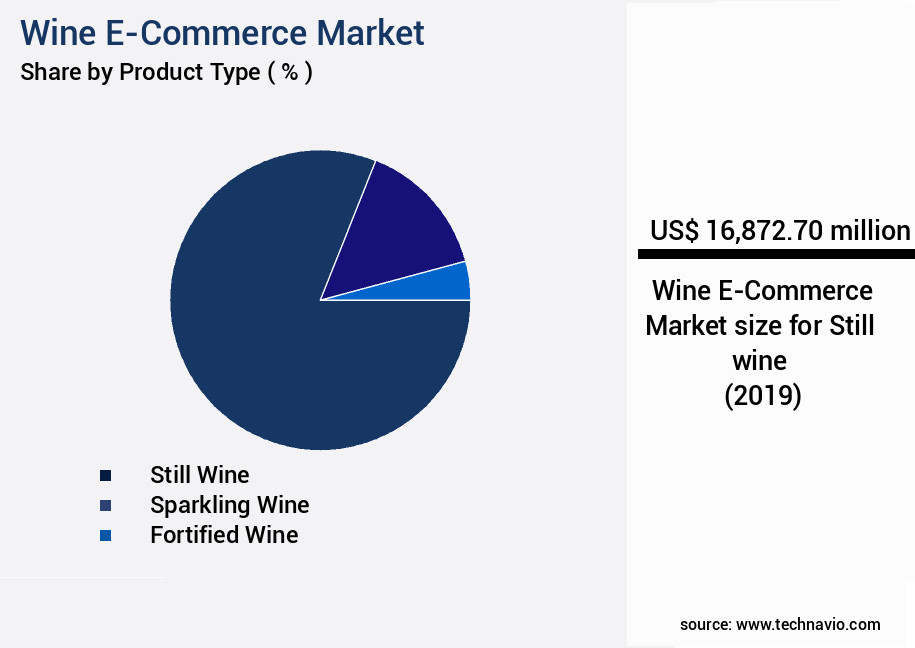
The Still wine segment was valued at USD 16.87 billion in 2019 and showed a gradual increase during the forecast period.
Regional Analysis
Europe is estimated to contribute 53% to the growth of the global market during the forecast period.Technavio's analysts have elaborately explained the regional trends and drivers that shape the market during the forecast period.
See How Wine E-Commerce Market Demand is Rising in Europe Request Free Sample
Europe, home to some of the world's largest wine producers like France, Italy, and Spain, is a significant market for wine e-commerce. With Europe being the largest producer of wine globally, the increasing area under organic grape cultivation further bolsters its position. Sparkling wine, a popular beverage in the region, has contributed to the growth of the European wine e-commerce sector. Major importers of sparkling wine in Europe include Norway, Sweden, Finland, Denmark, Germany, the UK, Switzerland, and Austria.
Established e-commerce platforms such as Vinatis and Wine in Black (Viva Wine and Spirits Ab) cater to the region's growing demand for online wine sales.
Market Dynamics
Our researchers analyzed the data with 2024 as the base year, along with the key drivers, trends, and challenges. A holistic analysis of drivers will help companies refine their marketing strategies to gain a competitive advantage.
In the Wine E-Commerce Market, optimizing wine ecommerce conversion rates and implementing a robust wine inventory system are key to boosting sales. Building a user-friendly wine ecommerce website and designing an accessible wine ecommerce website improve navigation, while improving the mobile user experience for online wine sales ensures customers can shop anytime. Strategies for effective wine digital marketing and utilizing social media for wine marketing help attract new customers, and creating effective wine content marketing builds trust. Managing customer relationships in wine e-commerce, creating a personalized wine recommendation system, and implementing a successful wine loyalty program enhance engagement. Businesses also focus on leveraging data analytics for wine sales, measuring key performance indicators in wine ecommerce, and managing fraud prevention in online wine sales to ensure sustainable growth.
The market is experiencing robust growth as consumers increasingly turn to online platforms for convenience and personalized experiences. Optimizing conversion rates is a top priority, requiring the implementation of a robust wine inventory system and effective digital marketing strategies. Building a user-friendly website is essential, with a focus on enhancing the customer experience through personalized recommendations and upselling opportunities. Data analytics plays a crucial role in driving sales, allowing retailers to measure key performance indicators and manage online reviews and ratings. Customer relationships are managed through effective communication and fraud prevention measures. Integrating a secure payment gateway and optimizing logistics and delivery are also key considerations.
The importance of social media for wine marketing cannot be overlooked, with more than 70% of new customer acquisitions coming from social media channels. Utilizing a successful loyalty program and designing an accessible website are additional strategies for building a strong online community. Compared to traditional brick-and-mortar wine sales, the digital channel accounts for a significantly smaller share. However, the industrial application segment, which includes B2B sales, accounts for a larger proportion of overall e-commerce revenue. A minority of players, less than 15%, dominate the high-end wine market, highlighting the importance of differentiation and effective content marketing. Improving the mobile user experience is crucial, as mobile devices account for over half of all e-commerce traffic.
Effective strategies for managing online wine reviews and ratings, building a user-friendly website, and implementing a successful loyalty program are all critical components of a successful wine e-commerce business.
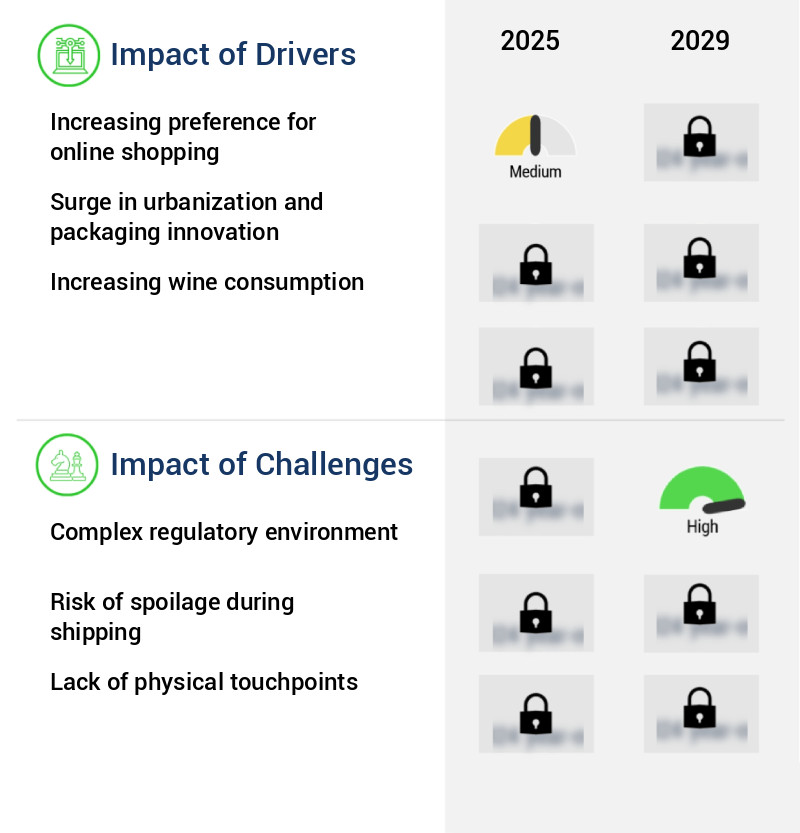
What are the key market drivers leading to the rise in the adoption of Wine E-Commerce Industry?
- The significant shift towards online shopping is the primary market trend, driving its growth with increasing consumer preference for the convenience, accessibility, and time-saving advantages it offers.
- The market experiences continuous expansion due to the escalating trend of online shopping for wine. Consumers value the extensive wine selection, competitive pricing, and home delivery offered by e-commerce platforms. This growth is driven by the escalating demand for wine, the increasing Internet penetration, and the convenience of purchasing wine online. Moreover, online auctions provide an alluring opportunity for wine collectors and enthusiasts, enabling them to bid from anywhere in the world.
- For instance, Sotheby's, a prestigious auction house, reported a 85% surge in online wine sales during the first half of 2020, with online auctions accounting for 70% of their total wine sales.
What are the market trends shaping the Wine E-Commerce Industry?
- The trend in the market indicates an upward trajectory in alcoholic beverage purchases by minors. This concerning development necessitates heightened vigilance and enforcement of applicable laws.
- The market faces a pressing issue with underage purchases of alcoholic beverages, which can negatively influence market expansion. The illegality of selling alcohol to minors in numerous countries complicates the online sales process, as the absence of physical age verification checks in e-commerce platforms can make it challenging to prevent underage transactions. The prevalence of underage drinking is a substantial public health concern, with approximately 200 million youth worldwide engaging in this behavior. Economically, the global costs associated with underage drinking amount to over USD400 billion annually.
- For instance, in the US, around 30% of online wine retailers reportedly lacked age verification procedures. This issue underscores the importance of implementing robust age verification systems to ensure regulatory compliance and promote responsible alcohol consumption.
What challenges does the Wine E-Commerce Industry face during its growth?
- The intricate regulatory landscape poses a significant challenge to the expansion of the industry.
- The market experiences continuous expansion as consumers prefer the convenience of purchasing wine online. Regulatory complexities, however, pose challenges to this growth. One significant hurdle is the intricate web of jurisdictional laws and regulations governing wine sales and distribution. For instance, in the US, each state imposes unique rules, leading to a fragmented marketplace. Moreover, the ongoing trade dispute between the US and European Union over tariffs might negatively influence the global wine e-commerce sector. Despite these challenges, the market's dynamic nature is evident in the evolving consumer preferences and increasing adoption of technology in the wine industry.
- For example, the rise of subscription services and personalized wine recommendations have gained traction, offering consumers a unique shopping experience. The market's continuous evolution underscores the need for businesses to stay informed and adapt to the changing regulatory landscape and consumer demands.
Exclusive Technavio Analysis on Customer Landscape
The wine e-commerce market forecasting report includes the adoption lifecycle of the market, covering from the innovator's stage to the laggard's stage. It focuses on adoption rates in different regions based on penetration. Furthermore, the wine e-commerce market report also includes key purchase criteria and drivers of price sensitivity to help companies evaluate and develop their market growth analysis strategies.
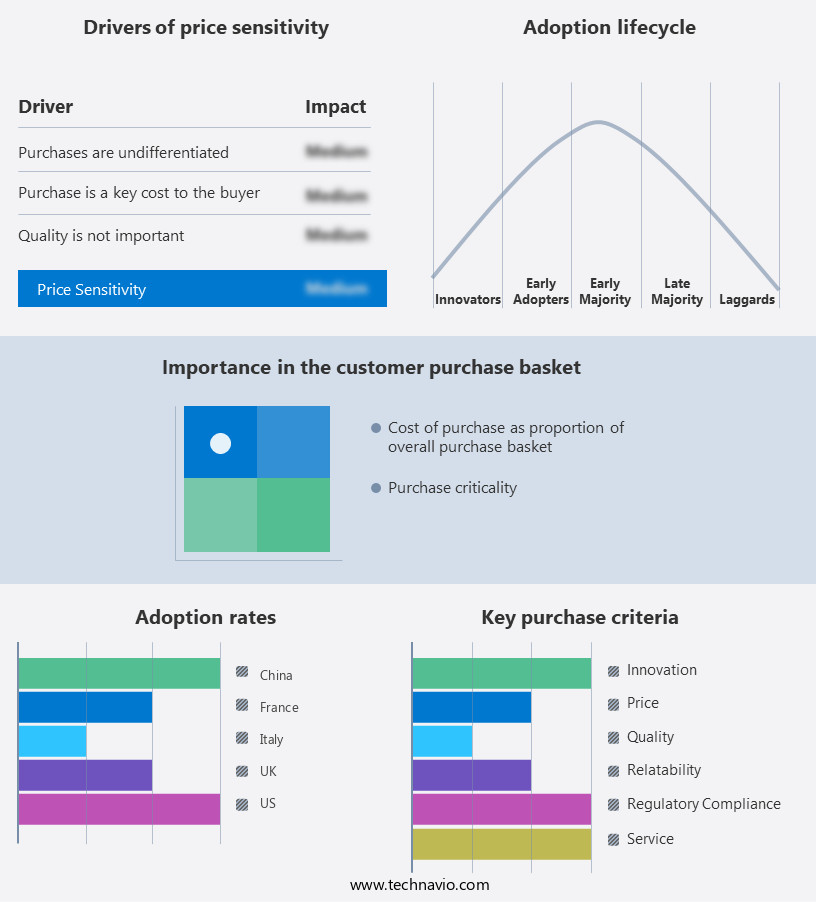
Customer Landscape of Wine E-Commerce Industry
Competitive Landscape
Companies are implementing various strategies, such as strategic alliances, wine e-commerce market forecast, partnerships, mergers and acquisitions, geographical expansion, and product/service launches, to enhance their presence in the industry.
Bright Cellars Inc. - This company specializes in providing a diverse range of wines, including premium, sparkling, low alcohol, and low sugar options, all accessible via its online platform. The selection caters to various consumer preferences, reflecting a commitment to inclusivity in the wine market.
The industry research and growth report includes detailed analyses of the competitive landscape of the market and information about key companies, including:
- Bright Cellars Inc.
- Costco Wholesale Corp.
- DRINKS Insiders LLC
- E vino Comercio de Vinhos SA
- Flaviar Inc.
- Fratelli Wines Pvt. Ltd.
- Gifts Inc.
- GoBrands Inc.
- IBEROWINE GOURMET S.C.
- Living Liquidz
- Naked Wines plc
- RESERVEBAR HOLDINGS CORP.
- Retail Services and Systems Inc.
- SNAP41 Inc.
- The Wine Emporium
- Uber Technologies Inc.
- VINELLO retail GmbH
- Vintage Wine Estates Inc.
- Vivino Inc.
- Wine Inc.
Qualitative and quantitative analysis of companies has been conducted to help clients understand the wider business environment as well as the strengths and weaknesses of key industry players. Data is qualitatively analyzed to categorize companies as pure play, category-focused, industry-focused, and diversified; it is quantitatively analyzed to categorize companies as dominant, leading, strong, tentative, and weak.
Recent Development and News in Wine E-Commerce Market
- In January 2024, major wine producer and retailer Constellation Brands announced the acquisition of a leading wine e-commerce platform, Wine.Com, for approximately USD1.7 billion. This strategic move aimed to strengthen Constellation's digital presence and expand its reach in the growing the market (Constellation Brands Press Release).
- In March 2024, Amazon and Drizly, a leading alcohol e-commerce platform, entered into a strategic partnership, allowing Amazon Prime members to shop for beer, wine, and spirits through Drizly's platform and receive free two-hour delivery in select markets (Amazon Press Release).
- In April 2025, the European Union's Digital Single Market strategy included the approval of new regulations to simplify cross-border wine sales, enabling European wineries to sell directly to consumers in other EU countries (European Commission Press Release).
- In May 2025, Nestle's Wines from Around the World division launched a new subscription service, WinePass, offering members exclusive access to discounts and limited-edition wines, further solidifying the company's commitment to the market (Nestle Press Release).
Dive into Technavio's robust research methodology, blending expert interviews, extensive data synthesis, and validated models for unparalleled Wine E-Commerce Market insights. See full methodology.
|
Market Scope |
|
|
Report Coverage |
Details |
|
Page number |
201 |
|
Base year |
2024 |
|
Historic period |
2019-2023 |
|
Forecast period |
2025-2029 |
|
Growth momentum & CAGR |
Accelerate at a CAGR of 7.8% |
|
Market growth 2025-2029 |
USD 13000.6 million |
|
Market structure |
Fragmented |
|
YoY growth 2024-2025(%) |
7.1 |
|
Key countries |
US, Canada, Germany, UK, Italy, France, China, India, Japan, Brazil, Egypt, UAE, Oman, Argentina, KSA, UAE, Brazil, and Rest of World (ROW) |
|
Competitive landscape |
Leading Companies, Market Positioning of Companies, Competitive Strategies, and Industry Risks |
Research Analyst Overview
- In the ever-evolving landscape of e-commerce, the wine industry has embraced digital transformation with notable fervor. Wine e-commerce platforms are revolutionizing the way consumers discover, purchase, and receive their favorite bottles. One significant trend is the integration of wine reviews, enabling data-driven selling and enhancing the overall shopping experience. Logistics plays a crucial role in wine e-commerce, with delivery services ensuring secure, temperature-controlled shipping to maintain the integrity of the product. Upselling techniques, such as wine recommendations and subscription services, have become essential components of e-commerce wine sales. Ecommerce wine analytics provide valuable insights into customer behavior, informing effective retention strategies and inventory management systems.
- Online wine auctions and sales offer unique opportunities for collectors and enthusiasts, while age verification systems ensure secure online transactions. Email marketing and website accessibility are essential aspects of digital wine marketing, with personalized experiences and responsive website design essential for engaging customers. Payment gateway integration and fraud prevention systems ensure a seamless purchasing process. Wine e-commerce websites also offer wine storage solutions and cross-selling strategies, leveraging recommendation engines to provide a tailored shopping experience. Wine club management systems facilitate customer loyalty, while mobile ordering and temperature-controlled shipping cater to the growing demand for convenience.
- As the market continues to unfold, these trends and patterns will evolve, shaping the future of online wine sales and the overall consumer experience.
What are the Key Data Covered in this Wine E-Commerce Market Research and Growth Report?
-
What is the expected growth of the Wine E-Commerce Market between 2025 and 2029?
-
USD 13 billion, at a CAGR of 7.8%
-
-
What segmentation does the market report cover?
-
The report segmented by Product Type (Still wine, Sparkling wine, and Fortified wine), Flavor (Red wine, White wine, and Rose wine), Geography (Europe, North America, APAC, South America, and Middle East and Africa), Distribution Platform (Dedicated Wine Platforms, General E-Commerce, and Winery Direct), and End-User (Individual Consumers, Restaurants, and Retail Stores)
-
-
Which regions are analyzed in the report?
-
Europe, North America, APAC, South America, and Middle East and Africa
-
-
What are the key growth drivers and market challenges?
-
Increasing preference for online shopping, Complex regulatory environment
-
-
Who are the major players in the Wine E-Commerce Market?
-
Key Companies Bright Cellars Inc., Costco Wholesale Corp., DRINKS Insiders LLC, E vino Comercio de Vinhos SA, Flaviar Inc., Fratelli Wines Pvt. Ltd., Gifts Inc., GoBrands Inc., IBEROWINE GOURMET S.C., Living Liquidz, Naked Wines plc, RESERVEBAR HOLDINGS CORP., Retail Services and Systems Inc., SNAP41 Inc., The Wine Emporium, Uber Technologies Inc., VINELLO retail GmbH, Vintage Wine Estates Inc., Vivino Inc., and Wine Inc.
-
Market Research Insights
- The market continues to evolve, with online wine sales experiencing significant growth. In 2020, wine e-retail accounted for 3% of global wine sales, representing a 12% increase from the previous year. This trend is driven by various factors, including the convenience of shopping from home, the rise of wine influencer marketing, and the implementation of targeted advertising strategies. Wine consumer segmentation and personalized email campaigns have become essential tools for wine e-retailers, enabling them to reach and engage their audience effectively. Delivery time optimization and real-time order tracking have also become crucial components of the customer experience, contributing to increased customer satisfaction and repeat purchases.
- Additionally, wine e-commerce platforms now offer features such as return policy management, customer service chatbots, and virtual wine tastings to enhance the shopping experience. As the market continues to mature, wine e-retailers will need to focus on cart abandonment strategies, wine producer databases, and wine news aggregation to stay competitive. The integration of wine blog content, affiliate marketing, and wine event ticketing can also provide valuable opportunities for growth. Overall, the market is a dynamic and competitive landscape, requiring continuous innovation and adaptation to meet the evolving needs of consumers.
We can help! Our analysts can customize this wine e-commerce market research report to meet your requirements.
 RIA -
RIA - 
