Portable Fan Market Size 2025-2029
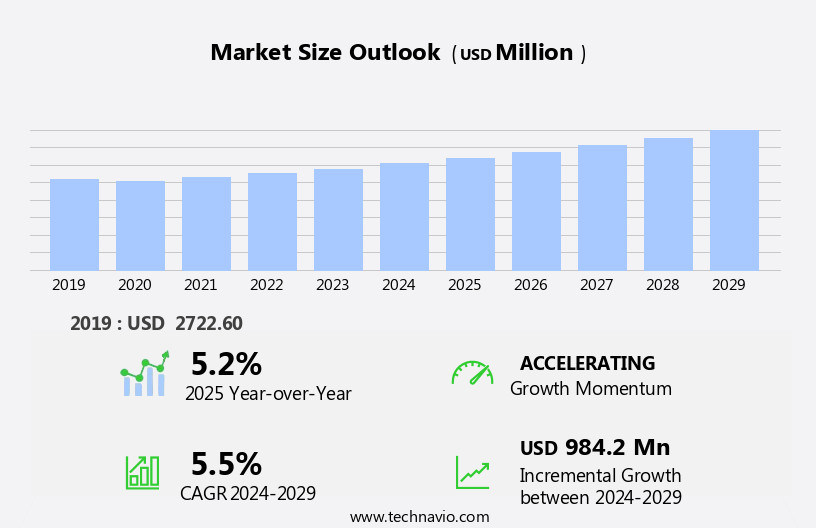
The portable fan market size is forecast to increase by USD 984.2 million, at a CAGR of 5.5% between 2024 and 2029.
- The market is driven by the cost-effective supply chain for portable fans, making them an affordable and convenient cooling solution for consumers. This trend is further bolstered by the increasing disposable income of individuals, enabling them to invest in comfort appliances. However, the market faces challenges from unorganized retailing, which may lead to price wars and profit margin compression. To capitalize on market opportunities, companies must focus on product innovation, quality, and differentiation to stand out in the competitive landscape.
- Additionally, strategic partnerships with organized retailers and e-commerce platforms can help expand reach and distribution networks. Navigating the challenges of unorganized retailing requires a robust marketing strategy and strong brand identity to maintain consumer loyalty and trust. Overall, the market presents significant growth potential for companies that can effectively balance cost, quality, and innovation to meet the evolving demands of consumers. Many portable fans now feature rechargeable batteries and USB connections, providing added convenience for consumers.
What will be the Size of the Portable Fan Market during the forecast period?

Explore in-depth regional segment analysis with market size data - historical 2019-2023 and forecasts 2025-2029 - in the full report.
Request Free Sample
The market continues to evolve, driven by advancements in technology and shifting consumer preferences. Home use remains a significant sector, with fans offering timer functions, plug types, and oscillating features to enhance comfort and convenience. Bladeless fans and tower fans, powered by DC or AC motors, have gained popularity for their sleek designs and energy efficiency. Air circulation is a key consideration, with some fans incorporating air purification and humidity control to improve indoor air quality. Rechargeable and USB fans offer flexibility for outdoor use and office settings, while safety features such as tip-over switches and overheat protection ensure user safety.
Manufacturing processes have evolved to include lightweight designs, smart fan technology, and app control, enabling fans to adapt to various applications. Eco mode and speed settings cater to energy-conscious consumers, while fan guards and noise level reduction technologies enhance user experience. The supply chain has become more complex, with distribution channels expanding to include online sales and fan maintenance services. Quality control and customer support have taken on increased importance as competition intensifies. Industrial use also presents opportunities, with fans designed for heavy-duty applications and industrial settings. Continuous innovation in fan design, blade materials, and motor technology will continue to shape the market dynamics.
How is this Portable Fan Industry segmented?
The portable fan industry research report provides comprehensive data (region-wise segment analysis), with forecasts and estimates in "USD million" for the period 2025-2029, as well as historical data from 2019-2023 for the following segments.
- Type
- Table fan
- Pedestal fan
- Tower and handheld fan
- End-user
- Residential
- Commercial
- Industrial
- Distribution Channel
- Power Source
- Battery-Operated (Rechargeable)
- USB-Powered
- AC Powered
- Feature
- Oscillating
- Non-Oscillating
- Mist/Humidifier Function
- Smart Connectivity
- LED Lighting
- Geography
- North America
- Europe
- Middle East and Africa
- APAC
- South America
- Rest of World (ROW)
By Type Insights
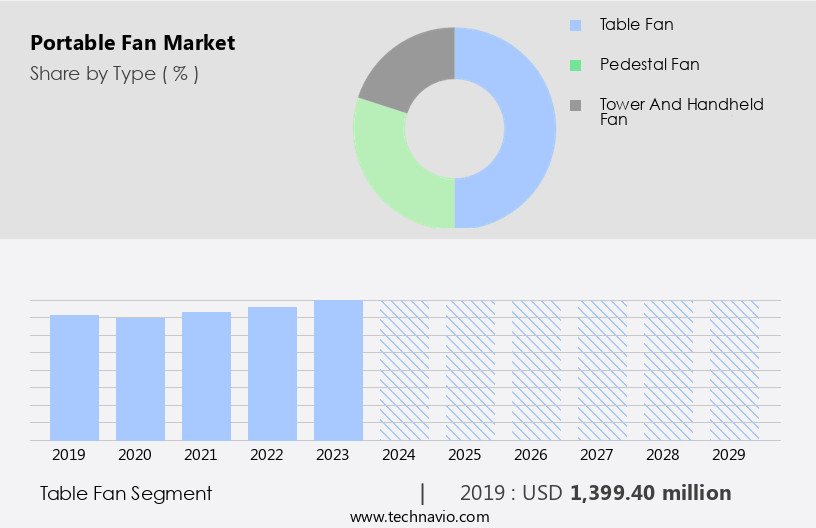
The table fan segment is estimated to witness significant growth during the forecast period.
The market encompasses various types of fans designed for heat dissipation and air circulation, catering to diverse applications such as office use and outdoor settings. Key players in this market include Orient, Bajaj Electricals, and Crompton. Innovations in fan design continue to shape the market, with the table fan segment poised for growth. Table fans, known for their lightweight and compact design, are ideal for small spaces. The emergence of bladeless fans, which offer increased airflow through air multiplier technology, has gained popularity due to their safety features, quiet operation, and ease of cleaning. These fans are also energy efficient, with some models featuring eco mode and remote control for added convenience.
The market also includes ceiling fans, pedestal fans, handheld fans, and tower fans, each catering to specific user needs. Manufacturers prioritize quality control and safety features, including tip-over switches and overheat protection. The market's evolution reflects the increasing emphasis on energy efficiency, with brushless motors and DC motors driving innovation. The market's distribution channels include retail sales, online sales, and direct sales through manufacturers, with fan maintenance and customer support playing crucial roles in ensuring customer satisfaction.

Request Free Sample
The Table fan segment was valued at USD 1399.40 million in 2019 and showed a gradual increase during the forecast period.
Regional Analysis
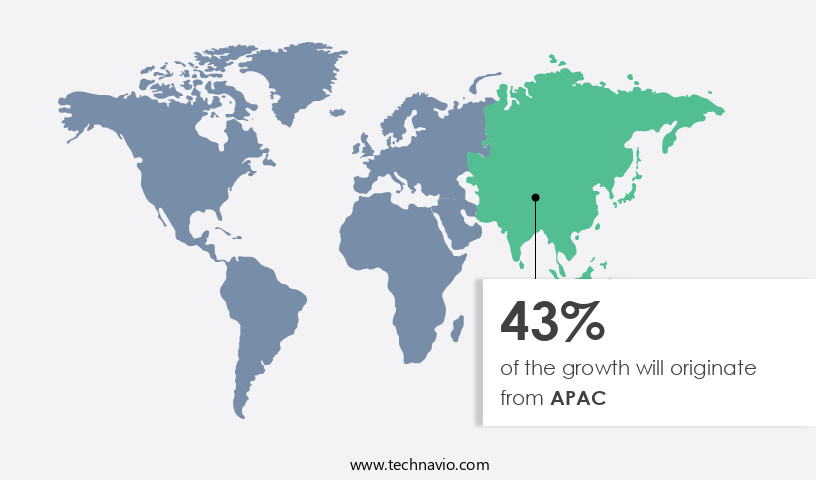
APAC is estimated to contribute 43% to the growth of the global market during the forecast period.Technavio's analysts have elaborately explained the regional trends and drivers that shape the market during the forecast period.

Request Free Sample
The market in APAC is experiencing significant growth due to several key factors. Increasing disposable income among individuals, a cost-effective supply chain, and the rising preference for luxury fans are primary drivers. Innovations in fan technology, such as USB fans, rechargeable fans, smart fans, and air multiplier technology, are also fueling market expansion. Countries like India, the Philippines, Vietnam, and China are major consumers, with a growing trend towards premium fan purchases. Safety features, including tip-over switches and overheat protection, are increasingly important considerations. Product offerings range from office-friendly, quiet battery-powered fans to industrial-grade tower fans, catering to diverse user needs.
Airflow rate, noise level, fan speed control, and aesthetic design are essential features for consumers. The manufacturing process involves careful material selection and quality control to ensure durability and cooling performance. Distribution channels include retail sales, online platforms, and direct sales, with fan maintenance and customer support ensuring long-term satisfaction. Energy consumption and sleep mode are also important considerations for eco-conscious consumers. Overall, the market in APAC is dynamic and evolving, driven by consumer preferences, technological advancements, and a growing awareness of comfort and convenience.
Market Dynamics
The Global Portable Fan Market is experiencing significant expansion, driven by increasing demand for convenient and efficient personal cooling solutions. Portable fan products like handheld fans, rechargeable portable fans, USB fans, and battery-operated fans are becoming indispensable. These personal cooling devices are widely used for outdoor activities (portable fans) and travel (portable fans), as well as for office desk cooling. Innovations such as bladeless portable fans and solar-powered portable fans are gaining traction, reflecting advancements in portable fan technology. The Asia Pacific portable fan market is a dominant force, supported by the robust online distribution channel (portable fans). Leading portable fan manufacturers are focusing on quiet operation technology (fans) and energy-efficient fan design to meet evolving global portable fan market trends. The popularity of smart portable fans and mini portable fans continues to rise.
Our researchers analyzed the data with 2024 as the base year, along with the key drivers, trends, and challenges. A holistic analysis of drivers will help companies refine their marketing strategies to gain a competitive advantage.
What are the key market drivers leading to the rise in the adoption of Portable Fan Industry?
- A cost-effective supply chain is essential for the market's growth in portable fans, as it ensures affordability and efficiency in production and distribution.
- The market is driven by the cost-effective manufacturing process, making portable fans an affordable home appliance for consumers worldwide. Portable fans, including stand, wall, and table models, are manufactured using various raw materials such as steel sheets, enameled copper wires, ball bearings, steel rods, blades, and winding wires. Suppliers offer these materials in bulk to manufacturers at low prices, resulting in reduced production costs. Advancements in portable fan technology include features like smart fan functionality, power consumption efficiency, lightweight designs, humidity control, overheat protection, and airflow rate control. Additionally, some portable fans offer voice control, fan speed control, and aesthetic designs, appealing to a broader consumer base.
- Air multiplier technology is another innovation that increases airflow without increasing power consumption, making it an attractive option for industrial use. Despite these advancements, the focus remains on maintaining low production costs to ensure retail sales competitiveness. Portable fans continue to be a popular choice due to their affordability, versatility, and energy efficiency. The global market for portable fans is expected to grow as consumers seek cost-effective cooling solutions for their homes and workplaces.
What are the market trends shaping the Portable Fan Industry?
- The trend in the market is shifting towards an increase in disposable income among individuals. This growing financial capability represents a significant opportunity for businesses.
- The global home fan market is witnessing significant growth due to the increasing disposable income of consumers. According to the Bureau of Economic Analysis, US disposable personal income increased by USD102.0 billion (0.5%) in March 2025. The personal saving rate stood at 3.9%, indicating an improvement in household saving behavior. Factors such as the rise in dual household income, per capita income, and employment rates have contributed to this trend. Consumers are investing in home appliances to enhance their living standards. Portable fans, including oscillating fans, tower fans, pedestal fans, and bladeless fans, are popular choices due to their energy efficiency and versatility.
- These fans offer features such as timer functions, eco mode, and multiple speed settings to cater to various consumer preferences. Fans with plug types, DC motors, and brushless motors ensure energy efficiency and quiet operation. Air purification features and fan guards add to the value proposition of these products. The supply chain for portable fans includes manufacturers, distributors, and retailers. Blade design and blade materials are essential considerations in the fan market. Market dynamics such as increasing consumer awareness about energy efficiency and the availability of advanced technology are driving the growth of the market. The market is expected to continue its upward trajectory during the forecast period, offering significant opportunities for businesses in this sector.
What challenges does the Portable Fan Industry face during its growth?
- The expansion of unorganized retailing poses a significant challenge to the industry's growth trajectory.
- The market is experiencing consistent expansion due to rising demand for high-end fans and a growing focus on home decoration. However, the market faces challenges from unorganized retailers, particularly in developing countries like India, Brazil, Bangladesh, and Benin. These retailers offer lower-priced regular portable fans, which have reduced the market share of organized retailers in these regions. This trend is anticipated to hinder the growth of the market during the forecast period. Consumers in these countries prefer purchasing affordable portable fans from unorganized retailers, who offer increased availability and convenience. Key features of portable fans, such as compact design, energy efficiency, and remote control, continue to attract consumers.
- Technologically advanced fans with app control and AC motor are gaining popularity due to their immersive and harmonious operation. Fan maintenance and customer support are essential factors influencing consumer preferences. Online sales channels are increasingly becoming popular due to their convenience and energy efficiency. In terms of energy consumption, fans with sleep mode are gaining traction as they offer energy savings and improved comfort. Overall, the market is expected to continue its growth trajectory, driven by these trends and consumer preferences.
Exclusive Customer Landscape
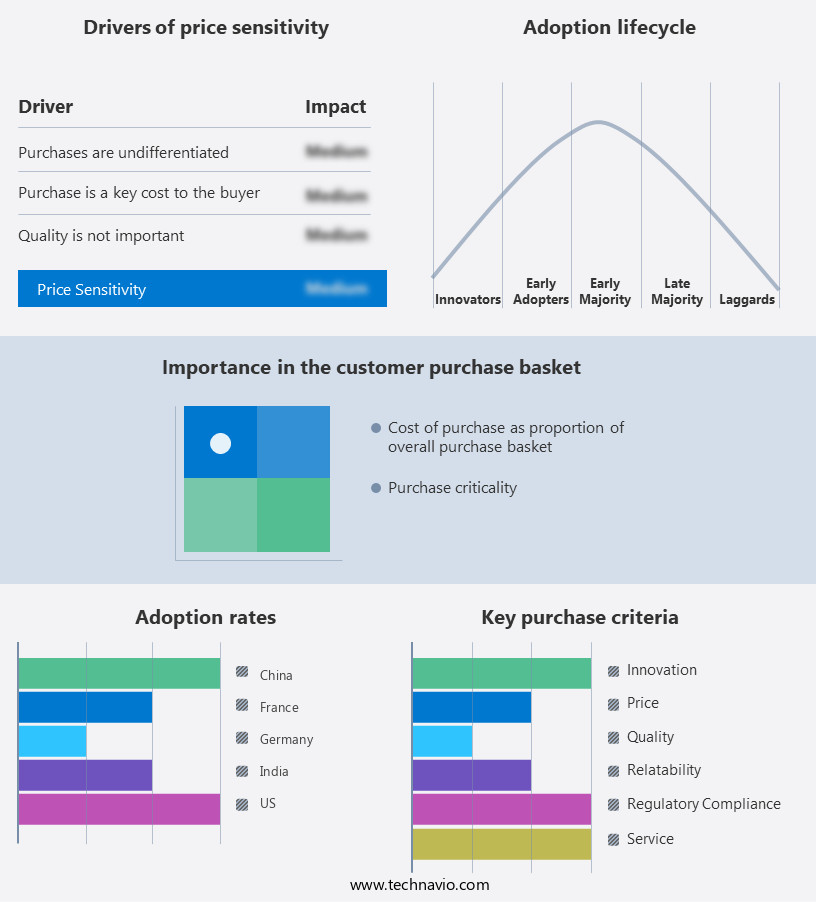
The portable fan market forecasting report includes the adoption lifecycle of the market, covering from the innovator's stage to the laggard's stage. It focuses on adoption rates in different regions based on penetration. Furthermore, the portable fan market report also includes key purchase criteria and drivers of price sensitivity to help companies evaluate and develop their market growth analysis strategies.

Customer Landscape
Key Companies & Market Insights
Companies are implementing various strategies, such as strategic alliances, portable fan market forecast, partnerships, mergers and acquisitions, geographical expansion, and product/service launches, to enhance their presence in the industry.
ACOAIRCOMFORT - This company specializes in portable fans, including box fans, suitable for various applications in commercial and residential settings. Their product line caters to diverse cooling needs, offering versatility and convenience.
The industry research and growth report includes detailed analyses of the competitive landscape of the market and information about key companies, including:
- ACOAIRCOMFORT
- Bajaj Electricals Ltd.
- Crompton Greaves Consumer Electricals Ltd.
- Dyson Group Co.
- Easyacc
- Global Product Resources Inc.
- Havells India Ltd.
- Honeywell International Inc.
- Lasko Products LLC
- Newell Brands Inc.
- O2Cool LLC
- Orient Electric Ltd.
- Pauls Fan Co.
- Stadler Form Aktiengesellschaft
- Suiden Co. Ltd.
- Travelon Inc.
- V Guard Industries Ltd.
- Vornado Air LLC
- Westinghouse Electric Corporation
- Xiaomi Inc.
Qualitative and quantitative analysis of companies has been conducted to help clients understand the wider business environment as well as the strengths and weaknesses of key industry players. Data is qualitatively analyzed to categorize companies as pure play, category-focused, industry-focused, and diversified; it is quantitatively analyzed to categorize companies as dominant, leading, strong, tentative, and weak.
Recent Development and News in Portable Fan Market
- In January 2024, Honeywell, a leading technology company, announced the launch of its new line of portable air circulators, the Honeywell QuietSet Whisper White Series, which offers advanced energy efficiency and quiet operation (Honeywell press release).
- In March 2024, Dyson, a renowned technology firm, formed a strategic partnership with Amazon to sell its portable fans directly on Amazon's platform, expanding its reach and convenience for customers (Amazon Business Wire).
- In April 2024, LG Electronics, a major appliance manufacturer, secured a significant investment of USD 150 million from Hyundai Motor Group to expand its portable air conditioner and fan production capacity (Reuters).
- In May 2025, Philips, a global health technology company, received regulatory approval for its new line of Smart Meconnect portable fans, allowing users to control fan settings via a smartphone app, enhancing the convenience and connectivity of portable fans (Philips press release).
Research Analyst Overview
- The market is witnessing significant trends and dynamics, with manufacturing automation streamlining production processes to meet increasing demand. E-commerce platforms are driving customer acquisition through convenient online purchasing options. Product innovation, such as energy-efficient fans and 3D-printed designs, differentiates brands and appeals to environmentally-conscious consumers. Sales growth is fueled by strong value propositions, positive customer reviews, and strategic retail partnerships. Pricing strategies and distribution networks are crucial for market success, with risk management ensuring profitability amidst fluctuating material sourcing costs. Product lifecycle management and marketing strategies focus on brand positioning and customer loyalty, while repair services and replacement parts extend the product's life cycle.
- IoT connectivity and smart home integration enhance user experience, providing convenience and energy savings. Energy efficiency ratings and fan accessories cater to diverse customer needs, further driving sales projections. Brand loyalty is fostered through effective marketing and customer retention strategies, ensuring a steady return on investment. Product differentiation and supply chain resilience are essential for navigating competitive markets and unforeseen challenges, respectively. Ultimately, the market is a dynamic and evolving landscape, requiring continuous innovation and strategic planning to stay ahead.
Dive into Technavio's robust research methodology, blending expert interviews, extensive data synthesis, and validated models for unparalleled Portable Fan Market insights. See full methodology.
Market Scope
|
Report Coverage
|
Details
|
Page number
|
216
|
Base year
|
2024
|
Historic period
|
2019-2023 |
Forecast period
|
2025-2029
|
Growth momentum & CAGR
|
Accelerate at a CAGR of 5.5%
|
Market growth 2025-2029
|
USD 984.2 million
|
Market structure
|
Fragmented
|
YoY growth 2024-2025(%)
|
5.2
|
Key countries
|
US, Canada, Germany, UK, Italy, France, China, India, Japan, Brazil, Egypt, UAE, Oman, Argentina, KSA, UAE, Brazil, and Rest of World (ROW)
|
Competitive landscape
|
Leading Companies, Market Positioning of Companies, Competitive Strategies, and Industry Risks
|
Request Free Sample
What are the Key Data Covered in this Portable Fan Market Research and Growth Report?
- CAGR of the Portable Fan industry during the forecast period
- Detailed information on factors that will drive the growth and forecasting between 2025 and 2029
- Precise estimation of the size of the market and its contribution of the industry in focus to the parent market
- Accurate predictions about upcoming growth and trends and changes in consumer behaviour
- Growth of the market across APAC, North America, Europe, Middle East and Africa, and South America
- Thorough analysis of the market's competitive landscape and detailed information about companies
- Comprehensive analysis of factors that will challenge the portable fan market growth of industry companies
We can help! Our analysts can customize this portable fan market research report to meet your requirements.
Get in touch
1 Executive Summary
- 1.1 Market overview
- Executive Summary - Chart on Market Overview
- Executive Summary - Data Table on Market Overview
- Executive Summary - Chart on Global Market Characteristics
- Executive Summary - Chart on Market by Geography
- Executive Summary - Chart on Market Segmentation by Type
- Executive Summary - Chart on Market Segmentation by End-user
- Executive Summary - Chart on Market Segmentation by Distribution Channel
- Executive Summary - Chart on Incremental Growth
- Executive Summary - Data Table on Incremental Growth
- Executive Summary - Chart on Company Market Positioning
2 Technavio Analysis
- 2.1 Analysis of price sensitivity, lifecycle, customer purchase basket, adoption rates, and purchase criteria
- Analysis of price sensitivity, lifecycle, customer purchase basket, adoption rates, and purchase criteria
- 2.2 Criticality of inputs and Factors of differentiation
- Overview on criticality of inputs and factors of differentiation
- 2.3 Factors of disruption
- Overview on factors of disruption
- 2.4 Impact of drivers and challenges
- Impact of drivers and challenges in 2024 and 2029
3 Market Landscape
- 3.1 Market ecosystem
- Parent Market
- Data Table on - Parent Market
- 3.2 Market characteristics
- Market characteristics analysis
4 Market Sizing
- 4.1 Market definition
- Offerings of companies included in the market definition
- 4.2 Market segment analysis
- 4.4 Market outlook: Forecast for 2024-2029
- Chart on Global - Market size and forecast 2024-2029 ($ million)
- Data Table on Global - Market size and forecast 2024-2029 ($ million)
- Chart on Global Market: Year-over-year growth 2024-2029 (%)
- Data Table on Global Market: Year-over-year growth 2024-2029 (%)
5 Historic Market Size
- 5.1 Global Portable Fan Market 2019 - 2023
- Historic Market Size - Data Table on Global Portable Fan Market 2019 - 2023 ($ million)
- 5.2 Type segment analysis 2019 - 2023
- Historic Market Size - Type Segment 2019 - 2023 ($ million)
- 5.3 End-user segment analysis 2019 - 2023
- Historic Market Size - End-user Segment 2019 - 2023 ($ million)
- 5.4 Distribution Channel segment analysis 2019 - 2023
- Historic Market Size - Distribution Channel Segment 2019 - 2023 ($ million)
- 5.5 Geography segment analysis 2019 - 2023
- Historic Market Size - Geography Segment 2019 - 2023 ($ million)
- 5.6 Country segment analysis 2019 - 2023
- Historic Market Size - Country Segment 2019 - 2023 ($ million)
6 Qualitative Analysis
- 6.1 Impact of AI in global portable fan market
7 Five Forces Analysis
- 7.1 Five forces summary
- Five forces analysis - Comparison between 2024 and 2029
- 7.2 Bargaining power of buyers
- Bargaining power of buyers - Impact of key factors 2024 and 2029
- 7.3 Bargaining power of suppliers
- Bargaining power of suppliers - Impact of key factors in 2024 and 2029
- 7.4 Threat of new entrants
- Threat of new entrants - Impact of key factors in 2024 and 2029
- 7.5 Threat of substitutes
- Threat of substitutes - Impact of key factors in 2024 and 2029
- 7.6 Threat of rivalry
- Threat of rivalry - Impact of key factors in 2024 and 2029
- 7.7 Market condition
- Chart on Market condition - Five forces 2024 and 2029
8 Market Segmentation by Type
- 8.1 Market segments
- Chart on Type - Market share (2024-2029) (%)
- Data Table on Type - Market share (2024-2029) (%)
- 8.2 Comparison by Type
- Chart on Comparison by Type
- Data Table on Comparison by Type
- 8.3 Table fan - Market size and forecast (2024-2029)
- Chart on Table fan - Market size and forecast (2024-2029) ($ million)
- Data Table on Table fan - Market size and forecast (2024-2029) ($ million)
- Chart on Table fan - Year-over-year growth (2024-2029) (%)
- Data Table on Table fan - Year-over-year growth (2024-2029) (%)
- 8.4 Pedestal fan - Market size and forecast (2024-2029)
- Chart on Pedestal fan - Market size and forecast (2024-2029) ($ million)
- Data Table on Pedestal fan - Market size and forecast (2024-2029) ($ million)
- Chart on Pedestal fan - Year-over-year growth (2024-2029) (%)
- Data Table on Pedestal fan - Year-over-year growth (2024-2029) (%)
- 8.5 Tower and handheld fan - Market size and forecast (2024-2029)
- Chart on Tower and handheld fan - Market size and forecast (2024-2029) ($ million)
- Data Table on Tower and handheld fan - Market size and forecast (2024-2029) ($ million)
- Chart on Tower and handheld fan - Year-over-year growth (2024-2029) (%)
- Data Table on Tower and handheld fan - Year-over-year growth (2024-2029) (%)
- 8.6 Market opportunity by Type
- Market opportunity by Type ($ million)
- Data Table on Market opportunity by Type ($ million)
9 Market Segmentation by End-user
- 9.1 Market segments
- Chart on End-user - Market share (2024-2029) (%)
- Data Table on End-user - Market share (2024-2029) (%)
- 9.2 Comparison by End-user
- Chart on Comparison by End-user
- Data Table on Comparison by End-user
- 9.3 Residential - Market size and forecast (2024-2029)
- Chart on Residential - Market size and forecast (2024-2029) ($ million)
- Data Table on Residential - Market size and forecast (2024-2029) ($ million)
- Chart on Residential - Year-over-year growth (2024-2029) (%)
- Data Table on Residential - Year-over-year growth (2024-2029) (%)
- 9.4 Commercial - Market size and forecast (2024-2029)
- Chart on Commercial - Market size and forecast (2024-2029) ($ million)
- Data Table on Commercial - Market size and forecast (2024-2029) ($ million)
- Chart on Commercial - Year-over-year growth (2024-2029) (%)
- Data Table on Commercial - Year-over-year growth (2024-2029) (%)
- 9.5 Industrial - Market size and forecast (2024-2029)
- Chart on Industrial - Market size and forecast (2024-2029) ($ million)
- Data Table on Industrial - Market size and forecast (2024-2029) ($ million)
- Chart on Industrial - Year-over-year growth (2024-2029) (%)
- Data Table on Industrial - Year-over-year growth (2024-2029) (%)
- 9.6 Market opportunity by End-user
- Market opportunity by End-user ($ million)
- Data Table on Market opportunity by End-user ($ million)
10 Market Segmentation by Distribution Channel
- 10.1 Market segments
- Chart on Distribution Channel - Market share (2024-2029) (%)
- Data Table on Distribution Channel - Market share (2024-2029) (%)
- 10.2 Comparison by Distribution Channel
- Chart on Comparison by Distribution Channel
- Data Table on Comparison by Distribution Channel
- 10.3 Offline - Market size and forecast (2024-2029)
- Chart on Offline - Market size and forecast (2024-2029) ($ million)
- Data Table on Offline - Market size and forecast (2024-2029) ($ million)
- Chart on Offline - Year-over-year growth (2024-2029) (%)
- Data Table on Offline - Year-over-year growth (2024-2029) (%)
- 10.4 Online - Market size and forecast (2024-2029)
- Chart on Online - Market size and forecast (2024-2029) ($ million)
- Data Table on Online - Market size and forecast (2024-2029) ($ million)
- Chart on Online - Year-over-year growth (2024-2029) (%)
- Data Table on Online - Year-over-year growth (2024-2029) (%)
- 10.5 Market opportunity by Distribution Channel
- Market opportunity by Distribution Channel ($ million)
- Data Table on Market opportunity by Distribution Channel ($ million)
11 Market Segmentation by Power Source
- 11.1 Market segments
- Chart on Power Source - Market share (2024-2029) (%)
- Data Table on Power Source - Market share (2024-2029) (%)
- 11.2 Comparison by Power Source
- Chart on Comparison by Power Source
- Data Table on Comparison by Power Source
- 11.3 Battery-Operated (Rechargeable) - Market size and forecast (2024-2029)
- Chart on Battery-Operated (Rechargeable) - Market size and forecast (2024-2029) ($ million)
- Data Table on Battery-Operated (Rechargeable) - Market size and forecast (2024-2029) ($ million)
- Chart on Battery-Operated (Rechargeable) - Year-over-year growth (2024-2029) (%)
- Data Table on Battery-Operated (Rechargeable) - Year-over-year growth (2024-2029) (%)
- 11.4 USB-Powered - Market size and forecast (2024-2029)
- Chart on USB-Powered - Market size and forecast (2024-2029) ($ million)
- Data Table on USB-Powered - Market size and forecast (2024-2029) ($ million)
- Chart on USB-Powered - Year-over-year growth (2024-2029) (%)
- Data Table on USB-Powered - Year-over-year growth (2024-2029) (%)
- 11.5 AC Powered - Market size and forecast (2024-2029)
- Chart on AC Powered - Market size and forecast (2024-2029) ($ million)
- Data Table on AC Powered - Market size and forecast (2024-2029) ($ million)
- Chart on AC Powered - Year-over-year growth (2024-2029) (%)
- Data Table on AC Powered - Year-over-year growth (2024-2029) (%)
- 11.6 Market opportunity by Power Source
- Market opportunity by Power Source ($ million)
- Data Table on Market opportunity by Power Source ($ million)
12 Market Segmentation by Feature
- 12.1 Market segments
- Chart on Feature - Market share (2024-2029) (%)
- Data Table on Feature - Market share (2024-2029) (%)
- 12.2 Comparison by Feature
- Chart on Comparison by Feature
- Data Table on Comparison by Feature
- 12.3 Oscillating - Market size and forecast (2024-2029)
- Chart on Oscillating - Market size and forecast (2024-2029) ($ million)
- Data Table on Oscillating - Market size and forecast (2024-2029) ($ million)
- Chart on Oscillating - Year-over-year growth (2024-2029) (%)
- Data Table on Oscillating - Year-over-year growth (2024-2029) (%)
- 12.4 Non-Oscillating - Market size and forecast (2024-2029)
- Chart on Non-Oscillating - Market size and forecast (2024-2029) ($ million)
- Data Table on Non-Oscillating - Market size and forecast (2024-2029) ($ million)
- Chart on Non-Oscillating - Year-over-year growth (2024-2029) (%)
- Data Table on Non-Oscillating - Year-over-year growth (2024-2029) (%)
- 12.5 Mist/Humidifier Function - Market size and forecast (2024-2029)
- Chart on Mist/Humidifier Function - Market size and forecast (2024-2029) ($ million)
- Data Table on Mist/Humidifier Function - Market size and forecast (2024-2029) ($ million)
- Chart on Mist/Humidifier Function - Year-over-year growth (2024-2029) (%)
- Data Table on Mist/Humidifier Function - Year-over-year growth (2024-2029) (%)
- 12.6 Smart Connectivity - Market size and forecast (2024-2029)
- Chart on Smart Connectivity - Market size and forecast (2024-2029) ($ million)
- Data Table on Smart Connectivity - Market size and forecast (2024-2029) ($ million)
- Chart on Smart Connectivity - Year-over-year growth (2024-2029) (%)
- Data Table on Smart Connectivity - Year-over-year growth (2024-2029) (%)
- 12.7 LED Lighting - Market size and forecast (2024-2029)
- Chart on LED Lighting - Market size and forecast (2024-2029) ($ million)
- Data Table on LED Lighting - Market size and forecast (2024-2029) ($ million)
- Chart on LED Lighting - Year-over-year growth (2024-2029) (%)
- Data Table on LED Lighting - Year-over-year growth (2024-2029) (%)
- 12.8 Market opportunity by Feature
- Market opportunity by Feature ($ million)
- Data Table on Market opportunity by Feature ($ million)
13 Customer Landscape
- 13.1 Customer landscape overview
- Analysis of price sensitivity, lifecycle, customer purchase basket, adoption rates, and purchase criteria
14 Geographic Landscape
- 14.1 Geographic segmentation
- Chart on Market share by geography 2024-2029 (%)
- Data Table on Market share by geography 2024-2029 (%)
- 14.2 Geographic comparison
- Chart on Geographic comparison
- Data Table on Geographic comparison
- 14.3 APAC - Market size and forecast 2024-2029
- Chart on APAC - Market size and forecast 2024-2029 ($ million)
- Data Table on APAC - Market size and forecast 2024-2029 ($ million)
- Chart on APAC - Year-over-year growth 2024-2029 (%)
- Data Table on APAC - Year-over-year growth 2024-2029 (%)
- 14.4 North America - Market size and forecast 2024-2029
- Chart on North America - Market size and forecast 2024-2029 ($ million)
- Data Table on North America - Market size and forecast 2024-2029 ($ million)
- Chart on North America - Year-over-year growth 2024-2029 (%)
- Data Table on North America - Year-over-year growth 2024-2029 (%)
- 14.5 Europe - Market size and forecast 2024-2029
- Chart on Europe - Market size and forecast 2024-2029 ($ million)
- Data Table on Europe - Market size and forecast 2024-2029 ($ million)
- Chart on Europe - Year-over-year growth 2024-2029 (%)
- Data Table on Europe - Year-over-year growth 2024-2029 (%)
- 14.6 Middle East and Africa - Market size and forecast 2024-2029
- Chart on Middle East and Africa - Market size and forecast 2024-2029 ($ million)
- Data Table on Middle East and Africa - Market size and forecast 2024-2029 ($ million)
- Chart on Middle East and Africa - Year-over-year growth 2024-2029 (%)
- Data Table on Middle East and Africa - Year-over-year growth 2024-2029 (%)
- 14.7 South America - Market size and forecast 2024-2029
- Chart on South America - Market size and forecast 2024-2029 ($ million)
- Data Table on South America - Market size and forecast 2024-2029 ($ million)
- Chart on South America - Year-over-year growth 2024-2029 (%)
- Data Table on South America - Year-over-year growth 2024-2029 (%)
- 14.8 China - Market size and forecast 2024-2029
- Chart on China - Market size and forecast 2024-2029 ($ million)
- Data Table on China - Market size and forecast 2024-2029 ($ million)
- Chart on China - Year-over-year growth 2024-2029 (%)
- Data Table on China - Year-over-year growth 2024-2029 (%)
- 14.9 US - Market size and forecast 2024-2029
- Chart on US - Market size and forecast 2024-2029 ($ million)
- Data Table on US - Market size and forecast 2024-2029 ($ million)
- Chart on US - Year-over-year growth 2024-2029 (%)
- Data Table on US - Year-over-year growth 2024-2029 (%)
- 14.10 India - Market size and forecast 2024-2029
- Chart on India - Market size and forecast 2024-2029 ($ million)
- Data Table on India - Market size and forecast 2024-2029 ($ million)
- Chart on India - Year-over-year growth 2024-2029 (%)
- Data Table on India - Year-over-year growth 2024-2029 (%)
- 14.11 Germany - Market size and forecast 2024-2029
- Chart on Germany - Market size and forecast 2024-2029 ($ million)
- Data Table on Germany - Market size and forecast 2024-2029 ($ million)
- Chart on Germany - Year-over-year growth 2024-2029 (%)
- Data Table on Germany - Year-over-year growth 2024-2029 (%)
- 14.12 France - Market size and forecast 2024-2029
- Chart on France - Market size and forecast 2024-2029 ($ million)
- Data Table on France - Market size and forecast 2024-2029 ($ million)
- Chart on France - Year-over-year growth 2024-2029 (%)
- Data Table on France - Year-over-year growth 2024-2029 (%)
- 14.13 Japan - Market size and forecast 2024-2029
- Chart on Japan - Market size and forecast 2024-2029 ($ million)
- Data Table on Japan - Market size and forecast 2024-2029 ($ million)
- Chart on Japan - Year-over-year growth 2024-2029 (%)
- Data Table on Japan - Year-over-year growth 2024-2029 (%)
- 14.14 South Korea - Market size and forecast 2024-2029
- Chart on South Korea - Market size and forecast 2024-2029 ($ million)
- Data Table on South Korea - Market size and forecast 2024-2029 ($ million)
- Chart on South Korea - Year-over-year growth 2024-2029 (%)
- Data Table on South Korea - Year-over-year growth 2024-2029 (%)
- 14.15 Canada - Market size and forecast 2024-2029
- Chart on Canada - Market size and forecast 2024-2029 ($ million)
- Data Table on Canada - Market size and forecast 2024-2029 ($ million)
- Chart on Canada - Year-over-year growth 2024-2029 (%)
- Data Table on Canada - Year-over-year growth 2024-2029 (%)
- 14.16 Australia - Market size and forecast 2024-2029
- Chart on Australia - Market size and forecast 2024-2029 ($ million)
- Data Table on Australia - Market size and forecast 2024-2029 ($ million)
- Chart on Australia - Year-over-year growth 2024-2029 (%)
- Data Table on Australia - Year-over-year growth 2024-2029 (%)
- 14.17 UK - Market size and forecast 2024-2029
- Chart on UK - Market size and forecast 2024-2029 ($ million)
- Data Table on UK - Market size and forecast 2024-2029 ($ million)
- Chart on UK - Year-over-year growth 2024-2029 (%)
- Data Table on UK - Year-over-year growth 2024-2029 (%)
- 14.18 Market opportunity by geography
- Market opportunity by geography ($ million)
- Data Tables on Market opportunity by geography ($ million)
- 14.19 Italy - Market size and forecast (2024-2029)
- Chart on Italy - Market size and forecast (2024-2029) ($ million)
- Data Table on Italy - Market size and forecast (2024-2029) ($ million)
- Chart on Italy - Year-over-year growth (2024-2029) (%)
- Data Table on Italy - Year-over-year growth (2024-2029) (%)
- 14.20 Brazil - Market size and forecast (2024-2029)
- Chart on Brazil - Market size and forecast (2024-2029) ($ million)
- Data Table on Brazil - Market size and forecast (2024-2029) ($ million)
- Chart on Brazil - Year-over-year growth (2024-2029) (%)
- Data Table on Brazil - Year-over-year growth (2024-2029) (%)
- 14.21 Egypt - Market size and forecast (2024-2029)
- Chart on Egypt - Market size and forecast (2024-2029) ($ million)
- Data Table on Egypt - Market size and forecast (2024-2029) ($ million)
- Chart on Egypt - Year-over-year growth (2024-2029) (%)
- Data Table on Egypt - Year-over-year growth (2024-2029) (%)
- 14.22 UAE - Market size and forecast (2024-2029)
- Chart on UAE - Market size and forecast (2024-2029) ($ million)
- Data Table on UAE - Market size and forecast (2024-2029) ($ million)
- Chart on UAE - Year-over-year growth (2024-2029) (%)
- Data Table on UAE - Year-over-year growth (2024-2029) (%)
- 14.23 Oman - Market size and forecast (2024-2029)
- Chart on Oman - Market size and forecast (2024-2029) ($ million)
- Data Table on Oman - Market size and forecast (2024-2029) ($ million)
- Chart on Oman - Year-over-year growth (2024-2029) (%)
- Data Table on Oman - Year-over-year growth (2024-2029) (%)
- 14.24 Argentina - Market size and forecast (2024-2029)
- Chart on Argentina - Market size and forecast (2024-2029) ($ million)
- Data Table on Argentina - Market size and forecast (2024-2029) ($ million)
- Chart on Argentina - Year-over-year growth (2024-2029) (%)
- Data Table on Argentina - Year-over-year growth (2024-2029) (%)
- 14.25 KSA - Market size and forecast (2024-2029)
- Chart on KSA - Market size and forecast (2024-2029) ($ million)
- Data Table on KSA - Market size and forecast (2024-2029) ($ million)
- Chart on KSA - Year-over-year growth (2024-2029) (%)
- Data Table on KSA - Year-over-year growth (2024-2029) (%)
- 14.26 Rest of World (ROW) - Market size and forecast (2024-2029)
- Chart on Rest of World (ROW) - Market size and forecast (2024-2029) ($ million)
- Data Table on Rest of World (ROW) - Market size and forecast (2024-2029) ($ million)
- Chart on Rest of World (ROW) - Year-over-year growth (2024-2029) (%)
- Data Table on Rest of World (ROW) - Year-over-year growth (2024-2029) (%)
15 Drivers, Challenges, and Opportunity/Restraints
- 15.3 Impact of drivers and challenges
- Impact of drivers and challenges in 2024 and 2029
- 15.4 Market opportunities/restraints
16 Competitive Landscape
- 16.2 Competitive Landscape
- Overview on criticality of inputs and factors of differentiation
- 16.3 Landscape disruption
- Overview on factors of disruption
- 16.4 Industry risks
- Impact of key risks on business
17 Competitive Analysis
- 17.2 Company ranking index
- 17.3 Market positioning of companies
- Matrix on companies position and classification
- 17.4 ACOAIRCOMFORT
- ACOAIRCOMFORT - Overview
- ACOAIRCOMFORT - Product / Service
- ACOAIRCOMFORT - Key offerings
- SWOT
- 17.5 Crompton Greaves Consumer Electricals Ltd.
- Crompton Greaves Consumer Electricals Ltd. - Overview
- Crompton Greaves Consumer Electricals Ltd. - Product / Service
- Crompton Greaves Consumer Electricals Ltd. - Key offerings
- SWOT
- 17.6 Dyson Group Co.
- Dyson Group Co. - Overview
- Dyson Group Co. - Product / Service
- Dyson Group Co. - Key offerings
- SWOT
- 17.7 Easyacc
- Easyacc - Overview
- Easyacc - Product / Service
- Easyacc - Key offerings
- SWOT
- 17.8 Global Product Resources Inc.
- Global Product Resources Inc. - Overview
- Global Product Resources Inc. - Product / Service
- Global Product Resources Inc. - Key offerings
- SWOT
- 17.9 Havells India Ltd.
- Havells India Ltd. - Overview
- Havells India Ltd. - Business segments
- Havells India Ltd. - Key news
- Havells India Ltd. - Key offerings
- Havells India Ltd. - Segment focus
- SWOT
- 17.10 Honeywell International Inc.
- Honeywell International Inc. - Overview
- Honeywell International Inc. - Business segments
- Honeywell International Inc. - Key news
- Honeywell International Inc. - Key offerings
- Honeywell International Inc. - Segment focus
- SWOT
- 17.11 Lasko Products LLC
- Lasko Products LLC - Overview
- Lasko Products LLC - Product / Service
- Lasko Products LLC - Key offerings
- SWOT
- 17.12 O2Cool LLC
- O2Cool LLC - Overview
- O2Cool LLC - Product / Service
- O2Cool LLC - Key offerings
- SWOT
- 17.13 Orient Electric Ltd.
- Orient Electric Ltd. - Overview
- Orient Electric Ltd. - Business segments
- Orient Electric Ltd. - Key offerings
- Orient Electric Ltd. - Segment focus
- SWOT
- 17.14 Stadler Form Aktiengesellschaft
- Stadler Form Aktiengesellschaft - Overview
- Stadler Form Aktiengesellschaft - Product / Service
- Stadler Form Aktiengesellschaft - Key offerings
- SWOT
- 17.15 Suiden Co. Ltd.
- Suiden Co. Ltd. - Overview
- Suiden Co. Ltd. - Product / Service
- Suiden Co. Ltd. - Key offerings
- SWOT
- 17.16 Vornado Air LLC
- Vornado Air LLC - Overview
- Vornado Air LLC - Product / Service
- Vornado Air LLC - Key offerings
- SWOT
- 17.17 Westinghouse Electric Corporation
- Westinghouse Electric Corporation - Overview
- Westinghouse Electric Corporation - Product / Service
- Westinghouse Electric Corporation - Key offerings
- SWOT
- 17.18 Xiaomi Inc.
- Xiaomi Inc. - Overview
- Xiaomi Inc. - Business segments
- Xiaomi Inc. - Key news
- Xiaomi Inc. - Key offerings
- Xiaomi Inc. - Segment focus
- SWOT
18 Appendix
- 18.2 Inclusions and exclusions checklist
- Inclusions checklist
- Exclusions checklist
- 18.3 Currency conversion rates for US$
- Currency conversion rates for US$
- 18.4 Research methodology
- 18.7 Validation techniques employed for market sizing
- Validation techniques employed for market sizing
- 18.9 360 degree market analysis
- 360 degree market analysis
- 18.10 List of abbreviations