Post Harvest Treatment Market Size 2025-2029
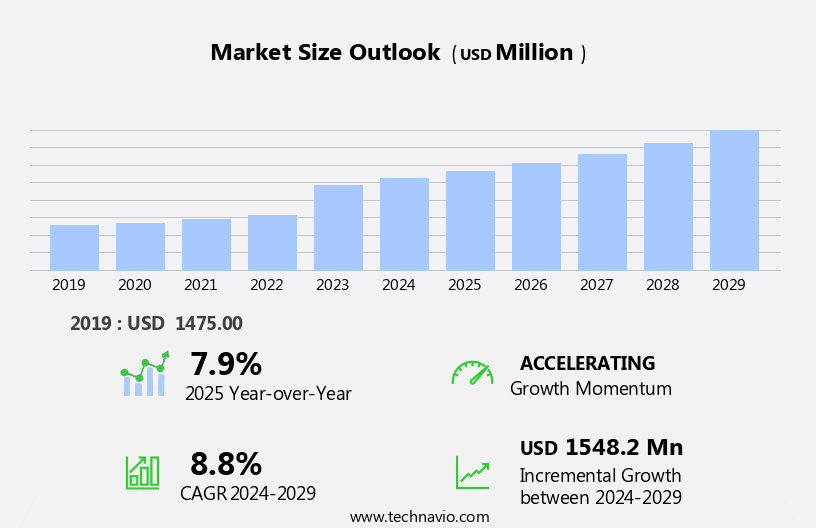
The post harvest treatment market size is forecast to increase by USD 1.55 billion, at a CAGR of 8.8% between 2024 and 2029. The market is experiencing significant growth, driven primarily by the increasing demand for fresh produce and the expanding adoption of these treatments in developing countries.
Major Market Trends & Insights
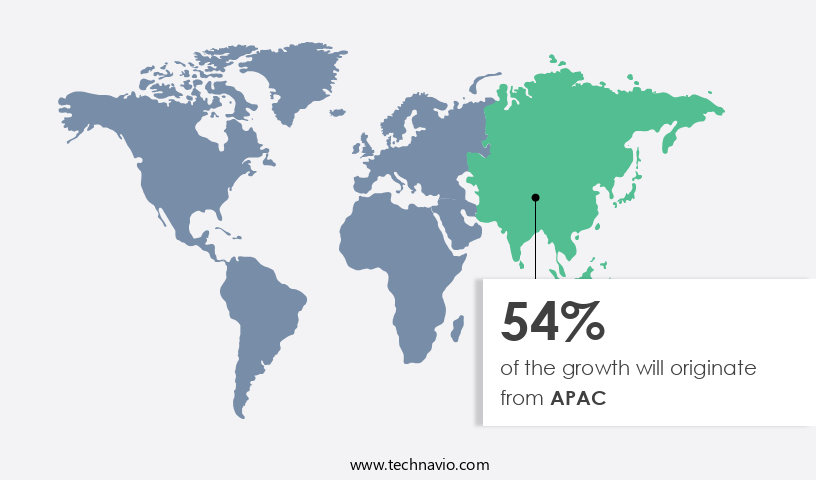
- APAC dominated the market and contributed 54% to the growth during the forecast period.
- The market is expected to grow significantly in Europe region as well over the forecast period.
- Based on the Application, the fruits segment led the market and was valued at USD 1.78 billion of the global revenue in 2023.
- Based on the Product, the coating segment accounted for the largest market revenue share in 2023.
Market Size & Forecast
- Market Opportunities: USD 206.2 Million
- Future Opportunities: USD 1.55 Billion
- CAGR (2024-2029): 8.8%
- APAC: Largest market in 2023
The fresh produce sector is witnessing a surge in demand due to consumers' growing preference for high-quality, fresh fruits and vegetables. This trend is particularly prominent in developing countries, where the population's income levels are rising, and consumers are becoming more health-conscious. However, the market faces challenges, including a lack of awareness and adoption in certain regions. Despite the numerous benefits of post-harvest treatments, such as prolonging the shelf life of produce, reducing food waste, and improving food safety, there are still areas where their use is limited. Addressing this challenge will require targeted marketing efforts and educational initiatives to increase awareness and understanding of the benefits of these treatments among farmers and consumers. By capitalizing on the growing demand and addressing the challenges, companies in the market can effectively position themselves to capitalize on the market's potential and navigate the competitive landscape.
What will be the Size of the Post Harvest Treatment Market during the forecast period?
Explore in-depth regional segment analysis with market size data - historical 2019-2023 and forecasts 2025-2029 - in the full report.
Request Free Sample
The market continues to evolve, driven by the need for effective bacterial spoilage reduction and microbial contamination control in various sectors. Packaging material selection plays a crucial role in decay reduction strategies, with ultraviolet sterilization and ethylene management being essential components. Waste reduction techniques and quality preservation methods are also gaining prominence, as is the adoption of automated grading systems and temperature monitoring sensors. Fungal decay prevention and freezing preservation methods are key focus areas, with food safety regulations increasingly stringent. Sanitation protocols and chilling injury prevention are also critical, with pulsed electric field and irradiation processing offering promising solutions.
Cold storage technology, gas composition analysis, and product traceability systems are other essential tools in the post harvest treatment arsenal. The industry is expected to grow at a robust rate, with energy efficiency measures and supply chain optimization becoming increasingly important. Postharvest disease control, osmotic dehydration, and fruit ripening control are also key areas of investment. Modified atmosphere packaging and shelf life extension are popular strategies to maintain sensory quality and extend the life of perishable goods. For instance, a leading fruit producer implemented an automated grading system and temperature monitoring sensors, resulting in a 20% reduction in spoilage and a 15% increase in sales.
This underscores the importance of advanced technology and innovative post harvest treatment methods in ensuring food safety and quality.
How is this Post Harvest Treatment Industry segmented?
The post harvest treatment industry research report provides comprehensive data (region-wise segment analysis), with forecasts and estimates in "USD million" for the period 2025-2029, as well as historical data from 2019-2023 for the following segments.
- Application
- Fruits
- Vegetables
- Product Type
- Coating
- Ethylene blockers
- Fungicides
- Cleaners
- Others
- Origin
- Natural
- Synthetic
- Geography
- North America
- US
- Canada
- Europe
- France
- Germany
- Spain
- UK
- APAC
- China
- India
- Japan
- South America
- Brazil
- Rest of World (ROW)
- North America
By Application Insights
The fruits segment is estimated to witness significant growth during the forecast period. The segment was valued at USD 1.78 billion in 2023. It continued to the largest segment at a CAGR of 37.88%.
The market experiences dynamic growth, driven by the increasing demand for fresh produce, particularly fruits. Consumers' heightened awareness of the health benefits of fresh fruits propels this trend. Post harvest treatments, including coatings, play a crucial role in preserving fruits' quality and freshness for extended periods. In the food service industry, the use of coated fruits in dishes like desserts, salads, and pastries has surged, boosting the demand for these treatments. Bacterial spoilage reduction and microbial contamination control are essential aspects of post harvest treatments. Ultraviolet sterilization and sanitation protocols are employed to ensure food safety, while temperature monitoring sensors maintain optimal temperatures.
Fungal decay prevention through the use of heat treatment methods and pulsed electric field technology is another significant trend. Food safety regulations mandate the implementation of these treatments, leading to a growing market. Cold storage technology, gas composition analysis, and product traceability systems are other key components of the market. Energy efficiency measures and supply chain optimization further enhance its appeal. The postharvest disease control and osmotic dehydration techniques ensure consistent product quality. The market is expected to grow at a significant rate, with an estimated 30% of global fruit production undergoing post harvest treatments.
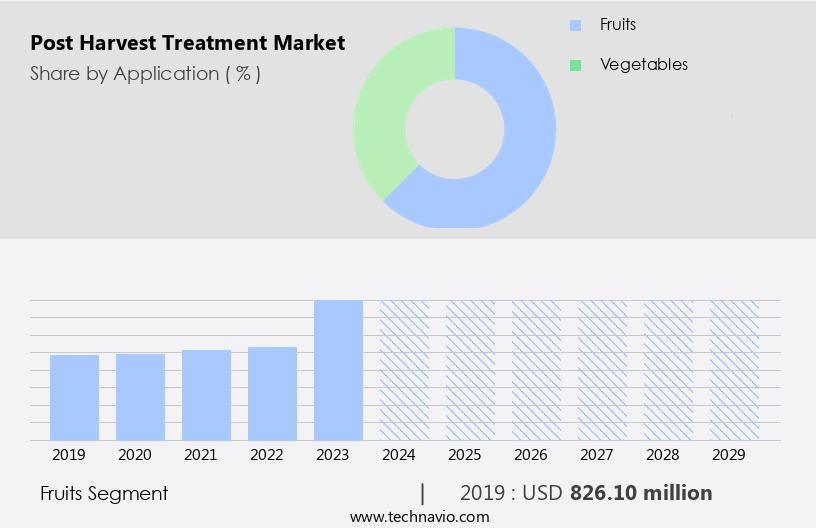
The Fruits segment was valued at USD 826.10 billion in 2019 and showed a gradual increase during the forecast period.
Regional Analysis
APAC is estimated to contribute 54% to the growth of the global market during the forecast period. Data suggests that the future opportunities for growth in the North America region estimates to be around USD 1.55 billion. Technavio's analysts have elaborately explained the regional trends and drivers that shape the market during the forecast period.
The market in Asia Pacific is experiencing significant growth due to several factors. The increasing consumer preference for fresh produce with minimal chemical usage is a major driving force. With a growing health-conscious population, the demand for fresh fruits and vegetables free from harmful chemicals is on the rise. Additionally, food safety concerns and the need to minimize food waste are further propelling market expansion. Post harvest treatments, such as coatings, help extend the shelf life of fruits and vegetables, reducing spoilage and waste. For instance, the use of ultraviolet sterilization and modified atmosphere packaging can significantly decrease microbial contamination and bacterial spoilage.
Furthermore, the implementation of automated grading systems, temperature monitoring sensors, and sanitation protocols ensures quality preservation and food safety. According to industry reports, the market in Asia Pacific is projected to grow by over 10% in the next few years, as companies invest in advanced technologies like pulsed electric field, high pressure processing, and energy efficiency measures to optimize supply chains and improve product traceability.
Market Dynamics
Our researchers analyzed the data with 2024 as the base year, along with the key drivers, trends, and challenges. A holistic analysis of drivers will help companies refine their marketing strategies to gain a competitive advantage.
The global lidding films market is experiencing significant growth due to the increasing demand for optimal cold storage temperature ranges to maintain the freshness and quality of perishable food products. Modified atmosphere packaging films, a key application area for lidding films, play a crucial role in extending the shelf life of these products by controlling the atmosphere inside the package and inhibiting postharvest disease management strategies. In the realm of food processing, non-destructive quality sorting algorithms and automated grading systems are essential for ensuring consistent product quality. Calibration of these systems is crucial, and it often involves considerations such as packaging material permeability and ethylene scavenging technologies. Refrigeration system maintenance protocols and humidity control system design parameters are also vital for maintaining the ideal conditions for perishable goods. Sanitation procedures and food safety certification requirements are non-negotiable in the post-harvest treatment market. Irradiation processing and heat treatment are common methods used to ensure food safety, and dose optimization and assessment of chilling injury susceptibility are critical factors in their application. Freezing preservation methods comparison is another important consideration, with ultraviolet sterilization effectiveness and high pressure processing equipment being key areas of research. Pulsed electric field technology and osmotic dehydration kinetics are emerging trends in the post-harvest treatment market. Supply chain traceability standards are also becoming increasingly important, as consumers demand greater transparency and accountability. In conclusion, the global lidding films market is a dynamic and complex industry that requires a deep understanding of various technologies, regulations, and trends to remain competitive.
What are the key market drivers leading to the rise in the adoption of Post Harvest Treatment Industry?
- The significant surge in consumer preference for fresh produce serves as the primary catalyst for market growth.
- The global fresh produce market is experiencing significant growth due to increasing consumer awareness and preference for fresh fruits and vegetables. However, the short shelf life of these products presents challenges for farmers, distributors, and retailers, leading to waste and spoilage. Post harvest treatments have emerged as a crucial solution to extend the shelf life of fresh produce while preserving its freshness and ensuring safety for consumption. These treatments, which include chemicals, irradiation, and modified atmospheric packaging, enable the food industry to reduce waste, optimize supply chain efficiency, and boost profitability. For instance, the use of modified atmospheric packaging for apples has been shown to increase their shelf life by up to three months, significantly reducing waste and increasing sales.
- According to industry reports, the global post harvest treatments market is expected to grow by over 5% annually, reflecting the increasing demand for these solutions in the fresh produce industry.
What are the market trends shaping the Post Harvest Treatment Industry?
- In developing countries, the use of post-harvest treatments is an emerging market trend, gaining increasing adoption. This trend reflects the growing recognition of the importance of preserving agricultural produce to ensure food security and reduce waste.
- In The market, a notable trend is the growing adoption of these treatments in developing countries. With population expansion, urbanization, and evolving dietary preferences, there has been a heightened demand for fresh produce in these regions. Post harvest treatment plays a crucial role in reducing food waste and extending the lifespan of fruits and vegetables. Moreover, governments in developing nations are escalating their investments in post harvest management to ensure food security and mitigate losses. Consequently, industry players in the post harvest treatment sector are capitalizing on these business opportunities and tailoring their solutions to cater to the unique needs of emerging markets.
- According to recent reports, the market is projected to grow by 12% based on value, reaching a market size of USD 18.5 billion by 2026.
What challenges does the Post Harvest Treatment Industry face during its growth?
- The lack of industry-wide awareness and adoption poses a significant challenge to the sector's growth trajectory.
- The market faces a substantial challenge due to the limited awareness and adoption among farmers and consumers. Despite the numerous benefits of post harvest treatments, many producers and cultivators remain uninformed. Consumers, too, may not fully understand the significance of post harvest treatment in ensuring the safety and quality of fresh produce. This lack of awareness and demand hinders market growth. To overcome this obstacle, market participants must invest in educational initiatives to inform both farmers and consumers about the advantages of post harvest treatments.
- For instance, post harvest treatments can increase the shelf life of fruits and vegetables by up to 50%, as shown in a recent study. The market is projected to grow robustly, with industry analysts anticipating a significant expansion in the coming years.
Exclusive Customer Landscape
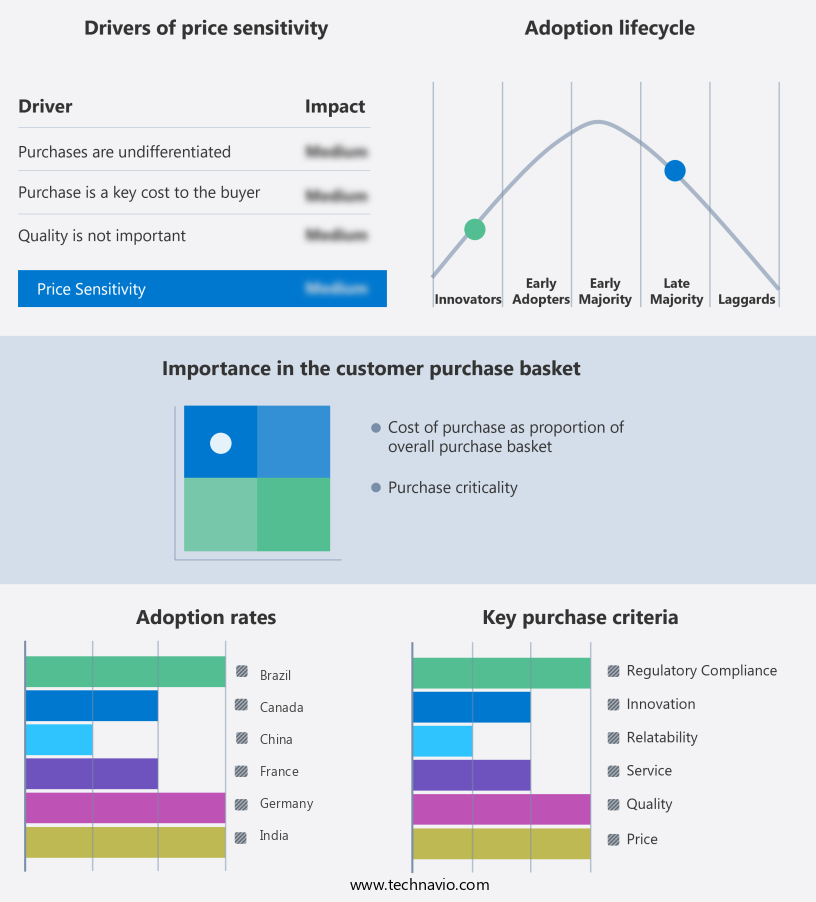
The post harvest treatment market forecasting report includes the adoption lifecycle of the market, covering from the innovator's stage to the laggard's stage. It focuses on adoption rates in different regions based on penetration. Furthermore, the post harvest treatment market report also includes key purchase criteria and drivers of price sensitivity to help companies evaluate and develop their market growth analysis strategies.
Customer Landscape
Key Companies & Market Insights
Companies are implementing various strategies, such as strategic alliances, post harvest treatment market forecast, partnerships, mergers and acquisitions, geographical expansion, and product/service launches, to enhance their presence in the industry.
AgroFresh Solutions Inc. - This company specializes in post-harvest treatments, providing innovative solutions through offerings such as SmartFresh, ActiSeal, and Control Tec.
The industry research and growth report includes detailed analyses of the competitive landscape of the market and information about key companies, including:
- AgroFresh Solutions Inc.
- Apeel Technology Inc.
- BASF SE
- Bayer AG
- Corteva Inc.
- FMC Corp.
- Fomesa Fruitech SLU
- Futureco Bioscience SA
- Gowan Co.
- John Bean Technologies Corp.
- Johnson and Johnson Inc.
- Natural Offset Farming
- Nufarm Ltd.
- Occidental Petroleum Corp.
- Post Harvest Solutions Ltd.
- Productos Citrosol SA
- Sahyadri Farms Post Harvest Care Ltd.
- Sumitomo Chemical Co. Ltd.
- Syngenta Crop Protection AG
- Tagros Chemicals India Pvt. Ltd.
- UPL Ltd.
- XEDA International SA
Qualitative and quantitative analysis of companies has been conducted to help clients understand the wider business environment as well as the strengths and weaknesses of key industry players. Data is qualitatively analyzed to categorize companies as pure play, category-focused, industry-focused, and diversified; it is quantitatively analyzed to categorize companies as dominant, leading, strong, tentative, and weak.
Recent Development and News in Post Harvest Treatment Market
- In January 2024, DuPont Nutrition & Biosciences announced the launch of its new post-harvest treatment solution, "Mavrik," designed to extend the shelf life of potatoes and reduce food waste (DuPont Press Release, 2024).
- In March 2024, Syngenta and Microsoft entered into a strategic partnership to develop digital solutions for the agriculture industry, including post-harvest treatment, using Microsoft's Azure cloud platform (Microsoft News Center, 2024).
- In April 2024, German chemical company BASF SE acquired Biomax Technologies, a leading provider of post-harvest treatment solutions for fruits and vegetables, expanding BASF's portfolio and market presence in this sector (BASF Press Release, 2024).
- In May 2025, the European Commission approved the use of the natural preservative, natamycin, for post-harvest treatment of a wider range of fruits and vegetables, enhancing food safety and reducing waste (European Commission Press Release, 2025).
Research Analyst Overview
- The post-harvest treatment market continues to evolve, driven by advancements in technology and consumer demand for high-quality, fresh produce. Aroma retention and respiration rate monitoring are crucial aspects of maintaining the freshness and nutritional value of fruits and vegetables. Distribution networks and spoilage detection systems play a significant role in minimizing quality degradation during transportation. Retail display methods and handling optimization techniques contribute to consumer acceptance and reduce waste. Natural preservatives, such as antifungal coatings and antibacterial agents, extend shelf life and prevent microbial inactivation. Active packaging technology, including ethylene production control and antioxidant release, preserves flavor profiles and color.
- Storage facility design and water loss prevention systems ensure optimal conditions for perishable goods. Enzyme activity control and transport logistics are essential for maintaining texture and preventing weight loss. According to industry reports, the post-harvest treatment market is expected to grow by 5% annually, with ongoing innovation in sensory evaluation, consumer handling practices, and packaging solutions. For instance, a leading fruit processor increased sales by 10% through the implementation of a new antifungal coating technology.
Dive into Technavio's robust research methodology, blending expert interviews, extensive data synthesis, and validated models for unparalleled Post Harvest Treatment Market insights. See full methodology.
|
Market Scope |
|
|
Report Coverage |
Details |
|
Page number |
210 |
|
Base year |
2024 |
|
Historic period |
2019-2023 |
|
Forecast period |
2025-2029 |
|
Growth momentum & CAGR |
Accelerate at a CAGR of 8.8% |
|
Market growth 2025-2029 |
USD 1548.2 million |
|
Market structure |
Fragmented |
|
YoY growth 2024-2025(%) |
7.9 |
|
Key countries |
China, Japan, US, Spain, France, India, Brazil, UK, Canada, and Germany |
|
Competitive landscape |
Leading Companies, Market Positioning of Companies, Competitive Strategies, and Industry Risks |
What are the Key Data Covered in this Post Harvest Treatment Market Research and Growth Report?
- CAGR of the Post Harvest Treatment industry during the forecast period
- Detailed information on factors that will drive the growth and forecasting between 2025 and 2029
- Precise estimation of the size of the market and its contribution of the industry in focus to the parent market
- Accurate predictions about upcoming growth and trends and changes in consumer behaviour
- Growth of the market across APAC, Europe, North America, South America, and Middle East and Africa
- Thorough analysis of the market's competitive landscape and detailed information about companies
- Comprehensive analysis of factors that will challenge the post harvest treatment market growth of industry companies
We can help! Our analysts can customize this post harvest treatment market research report to meet your requirements.
 RIA -
RIA - 
