Power Factor Correction (PFC) Control IC Market Size 2024-2028
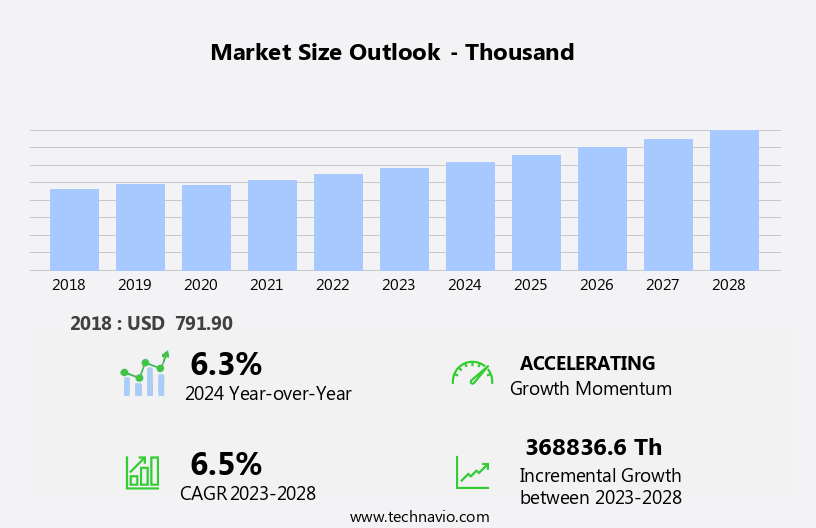
The power factor correction (PFC) control IC market size is forecast to increase by USD 368836.6 thousand, at a CAGR of 6.5% between 2023 and 2028.
- The market is driven by stringent global regulations mandating improved power efficiency and reduced harmonic distortion. These regulations have led to increased demand for PFC ICs in various applications, including industrial automation, renewable energy systems, and power supplies. The market is further propelled by continuous innovation, with companies introducing new products to cater to evolving customer needs and expectations. However, the market faces challenges from competition posed by alternative power conversion technologies, such as DC-DC converters and AC-AC converters. These alternatives offer advantages like higher efficiency, smaller size, and simpler design, making them attractive options for certain applications.
- Companies seeking to capitalize on market opportunities should focus on developing advanced PFC ICs with high efficiency, low harmonic distortion, and compact designs. Navigating the challenges requires a deep understanding of the competitive landscape and the ability to differentiate through superior technology and customer service.
What will be the Size of the Power Factor Correction (PFC) Control IC Market during the forecast period?
Explore in-depth regional segment analysis with market size data - historical 2018-2022 and forecasts 2024-2028 - in the full report.
Request Free Sample
The market showcases a dynamic and evolving landscape, driven by the expanding applications across various sectors. PFC technology, a crucial component in ensuring power efficiency and regulatory compliance, is increasingly sought after in servers, lighting, and industrial equipment. Buck-boost PFC, an advanced PFC topology, is gaining traction due to its ability to provide constant output voltage and current despite input voltage variations. PFC research continues to push the boundaries of innovation, with ongoing advancements in PFC circuit design, PFC controller development, and PFC compensation techniques. PFC testing plays a pivotal role in ensuring the reliability and efficiency of these solutions, while PFC standards and regulations shape the industry landscape.
PFC market growth is fueled by the increasing demand for energy-efficient solutions and stringent regulatory requirements. The market is expected to witness significant expansion in the coming years, driven by the continuous unfolding of market activities and evolving patterns. PFC innovation is not limited to control ICs alone; PFC suppliers, distributors, and manufacturers are also investing in research and development to provide comprehensive PFC solutions. Active PFC and passive PFC, two primary PFC types, cater to different application requirements, further expanding the market scope. The future of PFC technology lies in its ability to adapt to emerging trends, such as renewable energy integration and the Internet of Things (IoT).
PFC market forecasts indicate a promising future, with growth opportunities arising from these developments. PFC thd (total harmonic distortion) reduction and PFC efficiency optimization are critical factors influencing the market, as industries strive for more energy-efficient and environmentally friendly solutions. PFC design and PFC output current optimization are essential aspects of this ongoing innovation. In conclusion, the PFC control IC market exhibits a continuous and evolving nature, with applications spanning various sectors and ongoing research and development driving growth and innovation. The market's dynamic landscape is shaped by regulatory requirements, technological advancements, and industry trends.
How is this Power Factor Correction (PFC) Control IC Industry segmented?
The power factor correction (pfc) control ic industry research report provides comprehensive data (region-wise segment analysis), with forecasts and estimates in "USD thousand" for the period 2024-2028, as well as historical data from 2018-2022 for the following segments.
- Type
- Boost converter
- Buck converter
- Buck-boost converter
- End-user
- Electronics
- Automotive
- Telecommunication
- Others
- Geography
- North America
- US
- Canada
- Europe
- France
- Germany
- UK
- APAC
- China
- India
- Japan
- South Korea
- Taiwan
- Rest of World (ROW)
- North America
.
By Type Insights
The boost converter segment is estimated to witness significant growth during the forecast period.
Power Factor Correction (PFC) systems are essential in managing power efficiently and ensuring a stable output in single-phase applications. Boost converters, a type of DC-DC converter, play a significant role in PFC systems due to their ability to step up input voltages and improve power factor. These converters are particularly valuable in energy-sensitive applications, where maximizing power efficiency and minimizing strain on power sources are crucial. The global push for energy efficiency and the increasing demand for reliable power management in high-performance electronics have driven the growth of the boost converter market. In the realm of PFC applications, servers are a notable sector, as they require a consistent power supply and efficient voltage regulation.
Buck-boost PFC circuits, which combine the functions of a buck and a boost converter, offer additional flexibility in managing input and output voltages. PFC research continues to advance, with innovations in topology, circuit design, and controller technology. Flyback PFC, for instance, offers higher efficiency and simpler design compared to traditional PFC circuits. PFC standards and regulations, such as THD (Total Harmonic Distortion) limits, ensure compliance with industry norms and protect against potential harm. PFC testing is a critical aspect of the development process, ensuring the efficiency, reliability, and safety of PFC circuits. The PFC industry is diverse, with various manufacturers, distributors, and suppliers catering to the market.
Active PFC solutions, which actively correct power factor, are increasingly popular due to their ability to minimize harmonic distortion and improve power efficiency. Passive PFC solutions, on the other hand, rely on passive components to correct power factor. Both solutions have their merits and are used depending on the specific application requirements. The PFC market is expected to grow significantly in the coming years, driven by the increasing demand for energy-efficient solutions and the need for reliable power management in various industries, including lighting. The market trends reflect the ongoing efforts to improve PFC technology, increase efficiency, and reduce costs.
As the PFC market evolves, it continues to play a vital role in ensuring the efficient and reliable delivery of power in modern electronics.
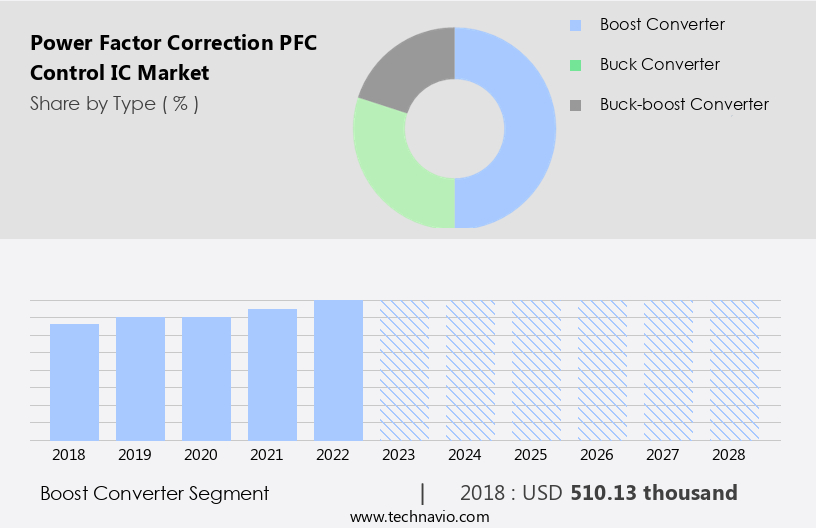
The Boost converter segment was valued at USD 510.13 thousand in 2018 and showed a gradual increase during the forecast period.
Regional Analysis
APAC is estimated to contribute 43% to the growth of the global market during the forecast period. Technavio's analysts have elaborately explained the regional trends and drivers that shape the market during the forecast period.

The PFC control IC market in the Asia-Pacific region experiences significant growth due to the industrial sector's robust expansion and the emphasis on sustainable energy and automation. In 2023, China's industrial production witnessed a steady increase, particularly in sectors focusing on intelligent and green transformation. The value-added industrial output rose by 6.8% year-on-year, with solar batteries (54%), new energy vehicles (30.3%), and power generation equipment (28.5%) showing remarkable growth. This surge is driven by China's commitment to sustainable energy and industrial automation, consequently fueling the demand for power factor correction (PFC) control ICs. These components are crucial for energy-efficient systems, making them indispensable in the region's industrial evolution.
India is also progressing towards Industry 4.0, further increasing the demand for PFC control ICs in various applications, including servers, lighting, and power conversion systems. Innovations in PFC topologies, such as buck-boost and flyback, contribute to the market's growth, ensuring higher efficiency and compliance with stringent regulations. The market's future looks promising, with ongoing research and development efforts aimed at enhancing PFC circuit performance and reducing ripple. The industry's growth is further supported by the increasing adoption of active PFC and passive PFC solutions, as well as the development of advanced PFC controllers and certification standards.
The market's size is expected to expand as PFC control ICs become increasingly essential for energy-efficient systems and industrial applications.
Market Dynamics
Our researchers analyzed the data with 2023 as the base year, along with the key drivers, trends, and challenges. A holistic analysis of drivers will help companies refine their marketing strategies to gain a competitive advantage.
What are the key market drivers leading to the rise in the adoption of Power Factor Correction (PFC) Control IC Industry?
- Strict global regulations governing power factor and harmonic distortion are the primary market drivers, necessitating compliance from power system equipment manufacturers and users alike.
- The Power Factor Correction (PFC) control IC industry is driven by government regulations that mandate energy efficiency and power quality to ensure grid stability and minimize energy wastage. These regulations focus on reducing harmonic distortion, improving power factor, and enforcing specific power quality standards for electrical devices. For instance, the IEC 61000-3-2 standard in the European Union sets limits on harmonic emissions from devices with input currents up to 16A per phase. As a result, the integration of PFC control ICs into power supply systems is becoming increasingly necessary across various industries to meet these regulations.
- The global PFC control IC market size is expected to grow due to this regulatory demand, as well as the need for energy savings and improved power quality. PFC design plays a crucial role in enhancing the efficiency of power conversion systems, making it a valuable investment for businesses aiming to reduce energy consumption and comply with regulatory requirements.
What are the market trends shaping the Power Factor Correction (PFC) Control IC Industry?
- The introduction of new products by companies is a prevailing market trend. This dynamic process reflects the industry's commitment to innovation and progress.
- The market is experiencing significant growth due to the increasing emphasis on energy efficiency and stricter power quality regulations. companies are responding to this trend by introducing innovative PFC control ICs that offer enhanced performance, smaller size, and greater reliability. These advancements not only improve power factor but also cater to a wide range of applications, including servers and industrial equipment. For instance, Toshiba recently launched the GT35J65MRB, a 650V discrete insulated gate bipolar transistor (IGBT) designed for PFC circuits in air conditioners and industrial equipment. PFC research is ongoing to further optimize these solutions, with a focus on reducing THD (Total Harmonic Distortion) and improving compensation techniques.
- The PFC market growth is driven by the global demand for energy-efficient solutions, making it an essential component in various industries. Buck-boost PFC and other advanced PFC topologies are also gaining popularity due to their ability to provide high power density and flexibility. Overall, the PFC control IC market is an evolving landscape that continues to innovate and adapt to the changing power electronics landscape.
What challenges does the Power Factor Correction (PFC) Control IC Industry face during its growth?
- The expansion of the industry is significantly influenced by the intensifying competition from advanced technologies, posing a substantial challenge that requires continuous innovation and adaptation to maintain a competitive edge.
- The market is experiencing notable competition from alternative harmonic filtration technologies. Active harmonic filters, in particular, are gaining traction due to their ability to mitigate harmonic distortion without requiring extensive modifications to existing PFC circuits. These filters actively monitor and adjust the current to compensate for harmonic loads, making them ideal for industrial applications with high levels of non-linear loads. On the other hand, passive harmonic filters offer a simpler and more cost-effective solution for reducing harmonics. Utilizing passive components like inductors and capacitors, these filters effectively manage harmonic distortion, providing an attractive alternative to PFC control ICs in specific applications.
- Compliance with PFC regulations and standards is a crucial factor driving the market growth. Stringent regulations and increasing awareness of energy efficiency have led to the widespread adoption of PFC technology. Moreover, PFC control ICs offer protection against overvoltage, overcurrent, and overtemperature, making them an essential component in power electronics systems. In conclusion, the PFC control IC market faces challenges from alternative harmonic filtration technologies, but the importance of PFC compliance and the need for efficient power conversion solutions ensure the market's continued growth.
Exclusive Customer Landscape
The power factor correction (PFC) control IC market forecasting report includes the adoption lifecycle of the market, covering from the innovator's stage to the laggard's stage. It focuses on adoption rates in different regions based on penetration. Furthermore, the power factor correction (PFC) control IC market report also includes key purchase criteria and drivers of price sensitivity to help companies evaluate and develop their market growth analysis strategies.

Customer Landscape
Key Companies & Market Insights
Companies are implementing various strategies, such as strategic alliances, power factor correction (PFC) control IC market forecast, partnerships, mergers and acquisitions, geographical expansion, and product/service launches, to enhance their presence in the industry.
Analog Devices Inc. - The company specializes in providing power factor correction control Integrated Circuits (ICs), including the LT1249, LT1248, and LT1105 models, among others.
The industry research and growth report includes detailed analyses of the competitive landscape of the market and information about key companies, including:
- Analog Devices Inc.
- Diodes Inc.
- Fuji Electric Co. Ltd.
- Infineon Technologies AG
- Microchip Technology Inc.
- Monolithic Power Systems Inc.
- NXP Semiconductors NV
- ON Semiconductor Corp.
- Power Integrations Inc.
- Renesas Electronics Corp.
- Richtek Technology Corp.
- ROHM Co. Ltd.
- Sanken Electric Co. Ltd.
- Shindengen Electric Manufacturing Co. Ltd.
- STMicroelectronics International NV
- Texas Instruments Inc.
- Torex Semiconductor Ltd.
- Toshiba Electronic Devices & Storage Corp.
- Vicor Corp.
- Vishay Intertechnology Inc.
Qualitative and quantitative analysis of companies has been conducted to help clients understand the wider business environment as well as the strengths and weaknesses of key industry players. Data is qualitatively analyzed to categorize companies as pure play, category-focused, industry-focused, and diversified; it is quantitatively analyzed to categorize companies as dominant, leading, strong, tentative, and weak.
Recent Development and News in Power Factor Correction (PFC) Control IC Market
- In February 2023, Infineon Technologies AG introduced its new 650V Power Factor Correction (PFC) controller, the CoolMOS C6 Power Module, designed to increase energy efficiency and reduce system costs for industrial applications (Infineon Technologies AG, 2023). This innovation builds on Infineon's CoolMOS C6 Power Module series, which has already gained significant market traction due to its high performance and reliability.
- In April 2024, Texas Instruments (TI) and ON Semiconductor announced a strategic collaboration to combine their power management portfolios, including PFC control ICs, to create a comprehensive offering for customers (Texas Instruments, 2024). This partnership aims to provide more comprehensive solutions and enable faster time-to-market for their clients in various industries, such as industrial, automotive, and consumer electronics.
- In June 2024, Dialog Semiconductor completed the acquisition of Adesto Technologies, a leading provider of energy harvesting and energy management solutions, including PFC control ICs (Dialog Semiconductor, 2024). This strategic move expands Dialog's power management capabilities and strengthens its position in the growing energy harvesting and energy management market.
Research Analyst Overview
- The market is experiencing significant growth, driven by the increasing adoption of green technology and renewable energy sources. PFC control ICs play a crucial role in optimizing efficiency and reducing Electromagnetic Interference (EMI/RFI) in power electronics systems. These devices enable current control and voltage regulation, essential for compliance with safety regulations and power quality requirements. Semiconductor technology advancements, such as System-on-a-Chip (SoC) and design tools, have facilitated the development of more efficient and cost-effective PFC control ICs. Thermal management and inductor design are critical aspects of PFC control IC design, ensuring reliable operation under various conditions.
- Energy savings and cost optimization are primary concerns for businesses in various industries, leading to a growing demand for advanced PFC control ICs. Smart grid integration and energy management systems further expand the market potential for these devices. Compliance with various standards, such as safety regulations and power quality requirements, necessitates the use of sophisticated PFC control ICs. Simulation software and capacitor selection tools aid in the design process, enabling engineers to optimize system performance and minimize line impedance. In summary, the market is witnessing dynamic growth, driven by the increasing importance of green technology, renewable energy, and energy efficiency.
- PFC control ICs are essential components in power electronics systems, enabling efficient energy conversion, reducing EMI/RFI, and ensuring power quality and safety. Semiconductor technology advancements and design tools facilitate the development of more efficient and cost-effective PFC control ICs, catering to the evolving needs of various industries.
Dive into Technavio's robust research methodology, blending expert interviews, extensive data synthesis, and validated models for unparalleled Power Factor Correction (PFC) Control IC Market insights. See full methodology.
|
Market Scope |
|
|
Report Coverage |
Details |
|
Page number |
215 |
|
Base year |
2023 |
|
Historic period |
2018-2022 |
|
Forecast period |
2024-2028 |
|
Growth momentum & CAGR |
Accelerate at a CAGR of 6.5% |
|
Market growth 2024-2028 |
USD 368836.6 thousand |
|
Market structure |
Fragmented |
|
YoY growth 2023-2024(%) |
6.3 |
|
Key countries |
US, China, Japan, Germany, India, France, Canada, South Korea, UK, and Taiwan |
|
Competitive landscape |
Leading Companies, Market Positioning of Companies, Competitive Strategies, and Industry Risks |
What are the Key Data Covered in this Power Factor Correction (PFC) Control IC Market Research and Growth Report?
- CAGR of the Power Factor Correction (PFC) Control IC industry during the forecast period
- Detailed information on factors that will drive the growth and forecasting between 2024 and 2028
- Precise estimation of the size of the market and its contribution of the industry in focus to the parent market
- Accurate predictions about upcoming growth and trends and changes in consumer behaviour
- Growth of the market across APAC, North America, Europe, South America, and Middle East and Africa
- Thorough analysis of the market's competitive landscape and detailed information about companies
- Comprehensive analysis of factors that will challenge the power factor correction (pfc) control ic market growth of industry companies
We can help! Our analysts can customize this power factor correction (pfc) control ic market research report to meet your requirements.
 RIA -
RIA - 
