Power Metering Market Analysis APAC, Europe, North America, South America, Middle East and Africa - China, US, Japan, Germany, UK - Size and Forecast 2024-2028

Power Metering Market Analysis APAC, Europe, North America, South America, Middle East and Africa - China, US, Japan, Germany, UK - Size and Forecast 2024-2028

Published: Aug 2024 144 Pages SKU: IRTNTR74239

Market Overview at a Glance

$9.79 B
Market Opportunity
8.51%
CAGR
7.67
YoY growth 2023-2024(%)

Power Metering Market Size 2024-2028 

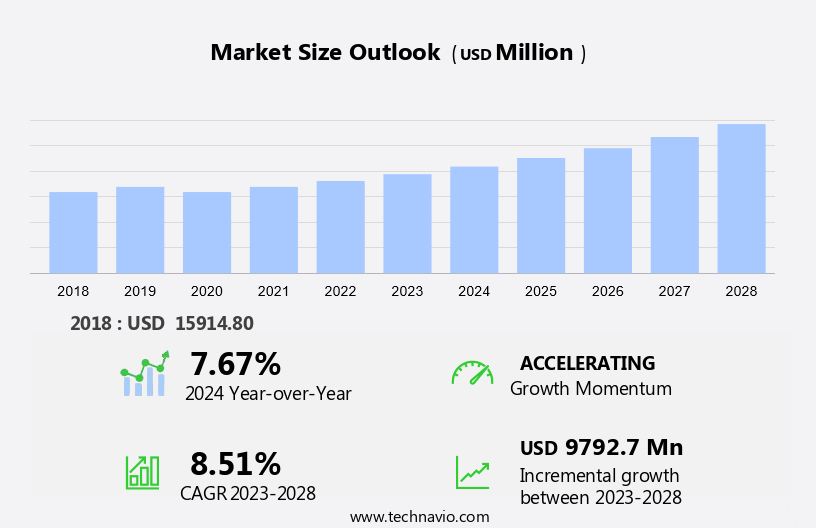
The power metering market size is forecast to increase by USD 9.79 billion at a CAGR of 8.51% between 2023 and 2028.

  • In the market, utility companies and city infrastructure are driving the adoption of advanced technologies to monitor and manage electricity consumption more efficiently. Smart City initiatives and environmental concerns are key trends propelling market growth. Technological upgrades, such as AI technology and data metrics, enable real-time monitoring and analysis of energy consumption, enhancing grid stability and reducing wastage.
  • Moreover, the construction sector is also embracing wireless smart power meters to optimize energy usage in new buildings. Despite these opportunities, high costs remain a challenge for widespread market penetration. Overall, the market is evolving to meet the demands of a more connected and sustainable energy landscape.

What will be the Size of the Market During the Forecast Period?

Power Metering Market Size

 Request Free Sample

  • The market in North America is witnessing significant advancements driven by the increasing demand for energy management and the integration of renewable infrastructure. Power metering systems enable accurate measurement and monitoring of electricity consumption, which is essential for effective energy management. User interfaces have become increasingly important in power metering systems, providing real-time data metrics for energy consumption and facilitating two-way communication between utilities and consumers. This allows for the implementation of multi-rate tariffs, which incentivize energy efficiency and promote the use of renewable energy sources. Renewable energy systems, such as solar and wind, are becoming more prevalent in North America, necessitating the installation of power metering systems to monitor their output and ensure efficient energy management.
  • Moreover, the construction of renewable infrastructure, including charging stations for electric vehicles, also requires the integration of power metering systems to ensure optimal performance and energy efficiency. Smart cities are another application of power metering systems, where they are used to monitor and manage energy consumption in urban areas. This includes residential and commercial usage, as well as urban applications such as street lighting and public transportation. Power metering systems are also essential in rural applications, where they help to optimize energy usage and reduce costs. Power meter manufacturers are focusing on technological upgrades to enhance the capabilities of power metering systems. These upgrades include the integration of load balancing and remote reading features, which enable utilities to optimize energy distribution and reduce the need for manual inspections. Environmental concerns are also driving the development of more efficient and eco-friendly power metering systems. Single phase and three phase meters are the two main types of power meters used in North America. Single phase meters are suitable for residential and small commercial applications, while three phase meters are used for larger commercial and industrial applications. The market for power meters is expected to grow as the demand for energy management and renewable energy integration continues to increase.
  • In conclusion, the market in North America is experiencing significant growth due to the increasing demand for energy management and the integration of renewable infrastructure. Power metering systems enable accurate measurement and monitoring of electricity consumption, facilitating effective energy management and the integration of renewable energy sources. The market is expected to continue growing as technological upgrades and the integration of smart city applications drive demand for more advanced power metering systems.

How is this market segmented and which is the largest segment?

The market research report provides comprehensive data (region-wise segment analysis), with forecasts and estimates in "USD billion" for the period 2024-2028, as well as historical data from 2018-2022 for the following segments.
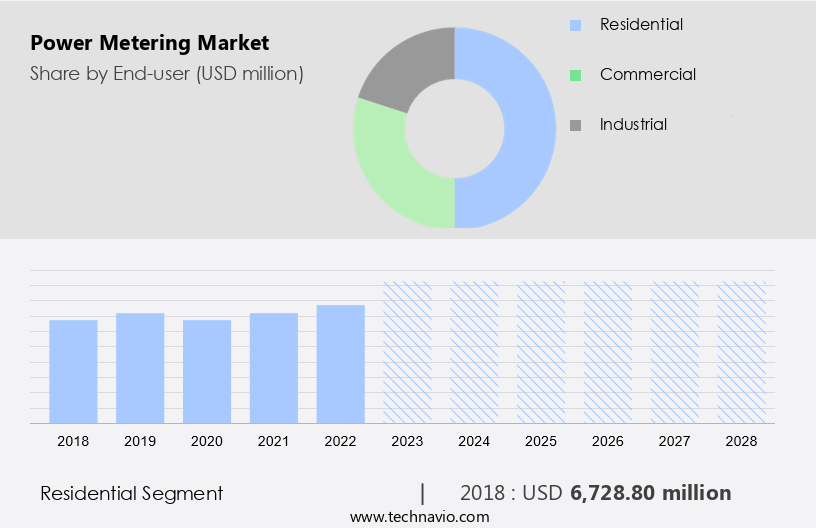
  • End-user
    • Residential
    • Commercial
    • Industrial
  • Geography
    • APAC
      • China
      • Japan
    • Europe
      • Germany
      • UK
    • North America
      • US
    • South America
    • Middle East and Africa

By End-user Insights

  • The residential segment is estimated to witness significant growth during the forecast period.

The market is experiencing significant growth due to the increasing demand for electricity worldwide. Factors such as population growth, urbanization, and rising employment levels are driving this need. In the residential sector, governments in various countries are offering incentives for the installation of advanced power meters, leading to a growth in demand. Additionally, the implementation of smart grids on a global scale is fueling the demand for power meters among utility companies. Power meter manufacturers are responding to this demand by offering innovative solutions with high accuracy. For instance, some companies provide chainring options for bicycle power meters, while others use Ultra-Torque Titanium Axles for enhanced durability.

Furthermore, power meters are available in single-phase and three-phase versions to cater to both residential and commercial applications. Power meters find extensive usage in urban applications due to the high energy consumption in densely populated areas. However, they are also essential in rural areas where electricity is often generated on-site, requiring precise measurement for efficient energy management. Overall, the market is poised for continued growth as the world's energy needs evolve.

Power Metering Market Size

Get a glance at the market report of share of various segments Request Free Sample

The residential segment was valued at USD 6.73 billion in 2018 and showed a gradual increase during the forecast period.

Regional Analysis

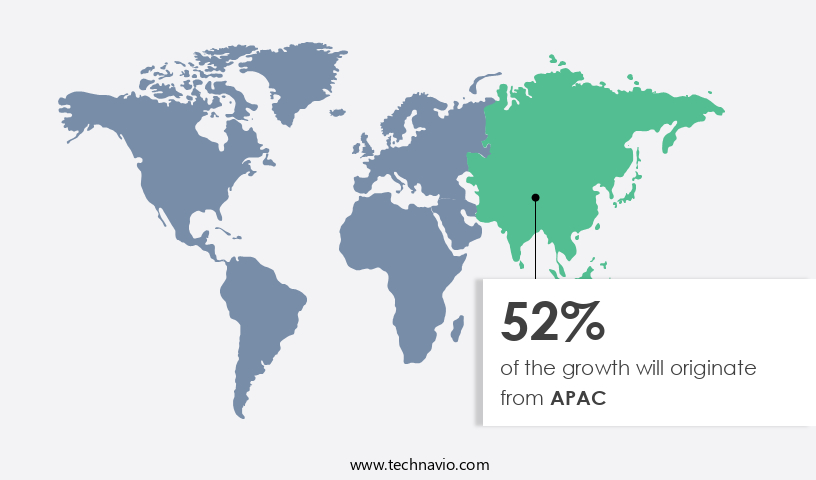
  • APAC is estimated to contribute 52% to the growth of the global market during the forecast period.

Technavio's analysts have elaborately explained the regional trends and drivers that shape the market during the forecast period.

Power Metering Market Share by Geography

For more insights on the market share of various regions Request Free Sample

The market in Asia Pacific (APAC) is experiencing significant growth due to the increasing commercial and urban developments in countries like China and India. Factors driving this growth include the burgeoning population, increasing urbanization, and the growth of manufacturing industries. Moreover, supportive regulatory actions are further fueling the adoption of power meters in the region. The electric power demand in APAC has been on a steady rise over the past decade, primarily due to industrialization and urbanization. Key countries contributing to this growth include China, India, South Korea, and Japan.

Market Dynamics

Our researchers analyzed the data with 2023 as the base year, along with the key drivers, trends, and challenges. A holistic analysis of drivers will help companies refine their marketing strategies to gain a competitive advantage.

What are the key market drivers leading to the rise in adoption of Power Metering Market?

Growing investment in smart grid projects is the key driver of the market.

  • In the global energy sector, power metering systems have gained significant attention due to the increasing adoption of renewable infrastructure. These systems play a crucial role in managing energy consumption and distribution, particularly in the context of renewable energy systems and charging stations for electric vehicles. Power metering systems offer advanced features such as user interfaces, energy management, load balancing, and remote reading. Multi-rate tariffs are becoming increasingly common, requiring sophisticated metering systems to accurately measure and bill consumers.
  • Moreover, the implementation of these systems enables utilities to analyze power consumption patterns, facilitating load forecasting, peak demand management, and risk assessment. The US, alongside countries like China, India, and European nations such as Spain, Germany, and France, have made substantial investments in smart grid projects, integrating power metering systems as part of comprehensive digital grid strategies. These networking systems offer utilities valuable insights into their customers' energy usage, promoting efficient energy management and optimizing grid performance.

What are the market trends shaping the Power Metering Market?

Growing demand for wireless smart power meters is the upcoming trend in the market.

  • In the US market, utilities are embracing the adoption of advanced wireless power metering systems to enhance energy efficiency and optimize electricity consumption. The implementation of AI technology in these systems allows for real-time monitoring and analysis of energy usage patterns, providing utilities with valuable data metrics to address environmental concerns and improve overall grid performance. The shift from traditional manual meter checks to smart power meters enables consumers to access real-time pricing information, fostering energy conservation and demand response. The aging infrastructure of utilities calls for technological upgrades, leading to the construction of smart energy networks.
  • Moreover, these networks consist of a cohesive set of systems, products, and solutions that facilitate remote and continuous monitoring and diagnosis of distribution-related issues. The integration of AI technology in power metering systems is a significant step towards creating a sustainable and efficient energy ecosystem in the US. The growing emphasis on energy efficiency and sustainability, coupled with the need for accurate and timely data, is driving the demand for advanced power metering solutions. The smart city initiative is also playing a crucial role in the market's growth, as cities aim to reduce their carbon footprint and improve energy management. The implementation of these systems not only benefits utilities but also empowers consumers to make informed decisions about their energy usage, ultimately contributing to a more sustainable energy future.

What challenges does Power Metering Market face during the growth?

The high cost of products is a key challenge affecting the market growth.

  • Smart power meters, which include Digital meters, Multi-function meters, and Smart meters, offer advanced features such as real-time energy consumption data and remote monitoring capabilities. However, their higher installation costs compared to traditional Analog meters, Single-phase meters, and Three-phase meters, can be a significant barrier for smaller utilities. The investment in these meters typically yields a return on investment within a period of five to eight years. Yet, the initial expense may not be justifiable for utilities with limited resources.
  • Furthermore, the installation of smart power meters necessitates investment in networking technology for seamless integration with utility networks. This integration is essential for the effective functioning of smart power meters. In the context of the United States, the large population and the need for extensive networking infrastructure add to the complexity and cost of implementing smart power meters. Nevertheless, the long-term benefits, including energy conservation and IoT integration, make it a worthwhile investment for utilities with the necessary resources. 

Exclusive Customer Landscape

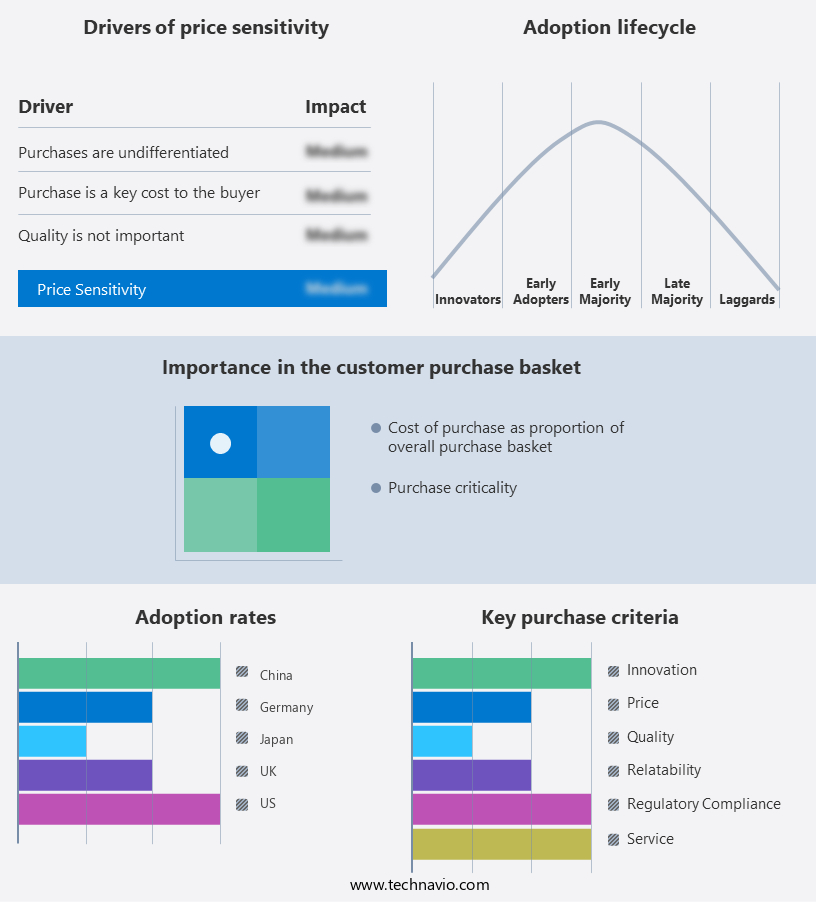
The market forecasting report includes the adoption lifecycle of the market, covering from the innovator's stage to the laggard's stage. It focuses on adoption rates in different regions based on penetration. Furthermore, the market report also includes key purchase criteria and drivers of price sensitivity to help companies evaluate and develop their market growth analysis strategies.

Power Metering Market Share by Geography

 Customer Landscape

Key Companies & Market Insights

Companies are implementing various strategies, such as strategic alliances, market forecast, partnerships, mergers and acquisitions, geographical expansion, and product/service launches, to enhance their presence in the market. The market research and growth report includes detailed analyses of the competitive landscape of the market and information about key companies, including:

  • ABB Ltd.
  • Aichi Tokei Denki Co. Ltd.
  • ALLETE Inc
  • Eaton Corp. Plc
  • General Electric Co.
  • Holley Technology Ltd.
  • Honeywell International Inc.
  • Hubbell Inc.
  • Itron Inc.
  • Jabil Inc.
  • Kamstrup AS
  • Landis Gyr AG
  • Networked Energy Services
  • Ningbo Sanxing Medical and Electric Co. Ltd.
  • Schneider Electric SE
  • Shenzhen Kaifa Technology Co. Ltd
  • Siemens AG
  • Suntront Tech Co. Ltd
  • Wasion Holdings Ltd.
  • Xylem Inc.

Qualitative and quantitative analysis of companies has been conducted to help clients understand the wider business environment as well as the strengths and weaknesses of key market players. Data is qualitatively analyzed to categorize companies as pure play, category-focused, industry-focused, and diversified; it is quantitatively analyzed to categorize companies as dominant, leading, strong, tentative, and weak.

Research Analyst Overview

Power metering systems have gained significant traction in recent years due to the increasing focus on energy management and conservation. Renewable infrastructure, including renewable energy systems and charging stations for electric vehicles, has driven the demand for advanced power metering solutions. Multi-rate tariffs and energy management systems enable efficient load balancing and optimize energy consumption. User interfaces have evolved from analog meters to digital and multi-function meters, offering real-time data metrics and two-way communication. IoT and AI technology have revolutionized power metering, enabling predictive maintenance and energy conservation. Utilities and smart city construction projects are major applications for power metering systems.

Moreover, renewable energy systems and electrification projects require high operating efficiency and accurate sensors, including gyroscopes and strain gauges. Power meter manufacturers are investing in technological upgrades, such as AI algorithms and smart grid players, to meet the growing demand for advanced power metering solutions. Venture capital firms and investment banks are also investing in the sector, driving innovation and growth. Power metering systems are essential for residential, commercial, and urban applications, as well as rural areas. Single-phase and three-phase meters cater to various power consumption needs. Energy conservation and environmental concerns continue to be key drivers for the market.

Market Scope

Report Coverage

Details

Page number

144

Base year

2023

Historic period

2018-2022

Forecast period

2024-2028

Growth momentum & CAGR

Accelerate at a CAGR of 8.51%

Market growth 2024-2028

USD 9.79 billion

Market structure

Fragmented

YoY growth 2023-2024(%)

7.67

Key countries

China, US, Japan, Germany, and UK

Competitive landscape

Leading Companies, Market Positioning of Companies, Competitive Strategies, and Industry Risks

Request Free Sample

What are the Key Data Covered in this Market Research and Growth Report?

  • CAGR of the market during the forecast period
  • Detailed information on factors that will drive the market growth and forecasting between 2024 and 2028
  • Precise estimation of the size of the market  and its contribution of the market in focus to the parent market
  • Accurate predictions about upcoming market growth and trends and changes in consumer behaviour
  • Growth of the market across APAC, Europe, North America, South America, and Middle East and Africa
  • Thorough analysis of the market's competitive landscape and detailed information about companies
  • Comprehensive analysis of factors that will challenge the growth of market companies

We can help! Our analysts can customize this market research report to meet your requirements. Get in touch

1 Executive Summary

  • 1.1 Market overview
    • Executive Summary - Chart on Market Overview
    • Executive Summary - Data Table on Market Overview
    • Executive Summary - Chart on Global Market Characteristics
    • Executive Summary - Chart on Market by Geography
    • Executive Summary - Chart on Market Segmentation by End-user
    • Executive Summary - Chart on Incremental Growth
    • Executive Summary - Data Table on Incremental Growth
    • Executive Summary - Chart on Company Market Positioning

2 Market Landscape

  • 2.1 Market ecosystem
    • Parent Market
    • Data Table on - Parent Market
  • 2.2 Market characteristics
    • Market characteristics analysis
  • 2.3 Value chain analysis
    • Value Chain Analysis

3 Market Sizing

  • 3.1 Market definition
    • Offerings of companies included in the market definition
  • 3.2 Market segment analysis
    • Market segments
  • 3.3 Market size 2023
    • 3.4 Market outlook: Forecast for 2023-2028
      • Chart on Global - Market size and forecast 2023-2028 ($ million)
      • Data Table on Global - Market size and forecast 2023-2028 ($ million)
      • Chart on Global Market: Year-over-year growth 2023-2028 (%)
      • Data Table on Global Market: Year-over-year growth 2023-2028 (%)

    4 Historic Market Size

    • 4.1 Global Power Metering Market 2018 - 2022
      • Historic Market Size - Data Table on Global Power Metering Market 2018 - 2022 ($ million)
    • 4.2 End-user segment analysis 2018 - 2022
      • Historic Market Size - End-user Segment 2018 - 2022 ($ million)
    • 4.3 Geography segment analysis 2018 - 2022
      • Historic Market Size - Geography Segment 2018 - 2022 ($ million)
    • 4.4 Country segment analysis 2018 - 2022
      • Historic Market Size - Country Segment 2018 - 2022 ($ million)

    5 Five Forces Analysis

    • 5.1 Five forces summary
      • Five forces analysis - Comparison between 2023 and 2028
    • 5.2 Bargaining power of buyers
      • Bargaining power of buyers - Impact of key factors 2023 and 2028
    • 5.3 Bargaining power of suppliers
      • Bargaining power of suppliers - Impact of key factors in 2023 and 2028
    • 5.4 Threat of new entrants
      • Threat of new entrants - Impact of key factors in 2023 and 2028
    • 5.5 Threat of substitutes
      • Threat of substitutes - Impact of key factors in 2023 and 2028
    • 5.6 Threat of rivalry
      • Threat of rivalry - Impact of key factors in 2023 and 2028
    • 5.7 Market condition
      • Chart on Market condition - Five forces 2023 and 2028

    6 Market Segmentation by End-user

    • 6.1 Market segments
      • Chart on End-user - Market share 2023-2028 (%)
      • Data Table on End-user - Market share 2023-2028 (%)
    • 6.2 Comparison by End-user
      • Chart on Comparison by End-user
      • Data Table on Comparison by End-user
    • 6.3 Residential - Market size and forecast 2023-2028
      • Chart on Residential - Market size and forecast 2023-2028 ($ million)
      • Data Table on Residential - Market size and forecast 2023-2028 ($ million)
      • Chart on Residential - Year-over-year growth 2023-2028 (%)
      • Data Table on Residential - Year-over-year growth 2023-2028 (%)
    • 6.4 Commercial - Market size and forecast 2023-2028
      • Chart on Commercial - Market size and forecast 2023-2028 ($ million)
      • Data Table on Commercial - Market size and forecast 2023-2028 ($ million)
      • Chart on Commercial - Year-over-year growth 2023-2028 (%)
      • Data Table on Commercial - Year-over-year growth 2023-2028 (%)
    • 6.5 Industrial - Market size and forecast 2023-2028
      • Chart on Industrial - Market size and forecast 2023-2028 ($ million)
      • Data Table on Industrial - Market size and forecast 2023-2028 ($ million)
      • Chart on Industrial - Year-over-year growth 2023-2028 (%)
      • Data Table on Industrial - Year-over-year growth 2023-2028 (%)
    • 6.6 Market opportunity by End-user
      • Market opportunity by End-user ($ million)
      • Data Table on Market opportunity by End-user ($ million)

    7 Customer Landscape

    • 7.1 Customer landscape overview
      • Analysis of price sensitivity, lifecycle, customer purchase basket, adoption rates, and purchase criteria

    8 Geographic Landscape

    • 8.1 Geographic segmentation
      • Chart on Market share by geography 2023-2028 (%)
      • Data Table on Market share by geography 2023-2028 (%)
    • 8.2 Geographic comparison
      • Chart on Geographic comparison
      • Data Table on Geographic comparison
    • 8.3 APAC - Market size and forecast 2023-2028
      • Chart on APAC - Market size and forecast 2023-2028 ($ million)
      • Data Table on APAC - Market size and forecast 2023-2028 ($ million)
      • Chart on APAC - Year-over-year growth 2023-2028 (%)
      • Data Table on APAC - Year-over-year growth 2023-2028 (%)
    • 8.4 Europe - Market size and forecast 2023-2028
      • Chart on Europe - Market size and forecast 2023-2028 ($ million)
      • Data Table on Europe - Market size and forecast 2023-2028 ($ million)
      • Chart on Europe - Year-over-year growth 2023-2028 (%)
      • Data Table on Europe - Year-over-year growth 2023-2028 (%)
    • 8.5 North America - Market size and forecast 2023-2028
      • Chart on North America - Market size and forecast 2023-2028 ($ million)
      • Data Table on North America - Market size and forecast 2023-2028 ($ million)
      • Chart on North America - Year-over-year growth 2023-2028 (%)
      • Data Table on North America - Year-over-year growth 2023-2028 (%)
    • 8.6 South America - Market size and forecast 2023-2028
      • Chart on South America - Market size and forecast 2023-2028 ($ million)
      • Data Table on South America - Market size and forecast 2023-2028 ($ million)
      • Chart on South America - Year-over-year growth 2023-2028 (%)
      • Data Table on South America - Year-over-year growth 2023-2028 (%)
    • 8.7 Middle East and Africa - Market size and forecast 2023-2028
      • Chart on Middle East and Africa - Market size and forecast 2023-2028 ($ million)
      • Data Table on Middle East and Africa - Market size and forecast 2023-2028 ($ million)
      • Chart on Middle East and Africa - Year-over-year growth 2023-2028 (%)
      • Data Table on Middle East and Africa - Year-over-year growth 2023-2028 (%)
    • 8.8 China - Market size and forecast 2023-2028
      • Chart on China - Market size and forecast 2023-2028 ($ million)
      • Data Table on China - Market size and forecast 2023-2028 ($ million)
      • Chart on China - Year-over-year growth 2023-2028 (%)
      • Data Table on China - Year-over-year growth 2023-2028 (%)
    • 8.9 US - Market size and forecast 2023-2028
      • Chart on US - Market size and forecast 2023-2028 ($ million)
      • Data Table on US - Market size and forecast 2023-2028 ($ million)
      • Chart on US - Year-over-year growth 2023-2028 (%)
      • Data Table on US - Year-over-year growth 2023-2028 (%)
    • 8.10 Japan - Market size and forecast 2023-2028
      • Chart on Japan - Market size and forecast 2023-2028 ($ million)
      • Data Table on Japan - Market size and forecast 2023-2028 ($ million)
      • Chart on Japan - Year-over-year growth 2023-2028 (%)
      • Data Table on Japan - Year-over-year growth 2023-2028 (%)
    • 8.11 Germany - Market size and forecast 2023-2028
      • Chart on Germany - Market size and forecast 2023-2028 ($ million)
      • Data Table on Germany - Market size and forecast 2023-2028 ($ million)
      • Chart on Germany - Year-over-year growth 2023-2028 (%)
      • Data Table on Germany - Year-over-year growth 2023-2028 (%)
    • 8.12 UK - Market size and forecast 2023-2028
      • Chart on UK - Market size and forecast 2023-2028 ($ million)
      • Data Table on UK - Market size and forecast 2023-2028 ($ million)
      • Chart on UK - Year-over-year growth 2023-2028 (%)
      • Data Table on UK - Year-over-year growth 2023-2028 (%)
    • 8.13 Market opportunity by geography
      • Market opportunity by geography ($ million)
      • Data Tables on Market opportunity by geography ($ million)

    9 Drivers, Challenges, and Opportunity/Restraints

    • 9.1 Market drivers
      • 9.2 Market challenges
        • 9.3 Impact of drivers and challenges
          • Impact of drivers and challenges in 2023 and 2028
        • 9.4 Market opportunities/restraints

          10 Competitive Landscape

          • 10.1 Overview
            • 10.2 Competitive Landscape
              • Overview on criticality of inputs and factors of differentiation
            • 10.3 Landscape disruption
              • Overview on factors of disruption
            • 10.4 Industry risks
              • Impact of key risks on business

            11 Competitive Analysis

            • 11.1 Companies profiled
              • Companies covered
            • 11.2 Market positioning of companies
              • Matrix on companies position and classification
            • 11.3 ABB Ltd.
              • ABB Ltd. - Overview
              • ABB Ltd. - Business segments
              • ABB Ltd. - Key news
              • ABB Ltd. - Key offerings
              • ABB Ltd. - Segment focus
            • 11.4 Eaton Corp. Plc
              • Eaton Corp. Plc - Overview
              • Eaton Corp. Plc - Business segments
              • Eaton Corp. Plc - Key news
              • Eaton Corp. Plc - Key offerings
              • Eaton Corp. Plc - Segment focus
            • 11.5 General Electric Co.
              • General Electric Co. - Overview
              • General Electric Co. - Business segments
              • General Electric Co. - Key news
              • General Electric Co. - Key offerings
              • General Electric Co. - Segment focus
            • 11.6 Honeywell International Inc.
              • Honeywell International Inc. - Overview
              • Honeywell International Inc. - Business segments
              • Honeywell International Inc. - Key news
              • Honeywell International Inc. - Key offerings
              • Honeywell International Inc. - Segment focus
            • 11.7 Hubbell Inc.
              • Hubbell Inc. - Overview
              • Hubbell Inc. - Business segments
              • Hubbell Inc. - Key news
              • Hubbell Inc. - Key offerings
              • Hubbell Inc. - Segment focus
            • 11.8 Itron Inc.
              • Itron Inc. - Overview
              • Itron Inc. - Business segments
              • Itron Inc. - Key news
              • Itron Inc. - Key offerings
              • Itron Inc. - Segment focus
            • 11.9 Kamstrup AS
              • Kamstrup AS - Overview
              • Kamstrup AS - Product / Service
              • Kamstrup AS - Key offerings
            • 11.10 Landis Gyr AG
              • Landis Gyr AG - Overview
              • Landis Gyr AG - Product / Service
              • Landis Gyr AG - Key offerings
            • 11.11 Networked Energy Services
              • Networked Energy Services - Overview
              • Networked Energy Services - Product / Service
              • Networked Energy Services - Key offerings
            • 11.12 Siemens AG
              • Siemens AG - Overview
              • Siemens AG - Business segments
              • Siemens AG - Key news
              • Siemens AG - Key offerings
              • Siemens AG - Segment focus

            12 Appendix

            • 12.1 Scope of the report
              • 12.2 Inclusions and exclusions checklist
                • Inclusions checklist
                • Exclusions checklist
              • 12.3 Currency conversion rates for US$
                • Currency conversion rates for US$
              • 12.4 Research methodology
                • Research methodology
              • 12.5 Data procurement
                • Information sources
              • 12.6 Data validation
                • Data validation
              • 12.7 Validation techniques employed for market sizing
                • Validation techniques employed for market sizing
              • 12.8 Data synthesis
                • Data synthesis
              • 360 degree market analysis
                • 360 degree market analysis
              • 12.10 List of abbreviations
                • List of abbreviations

              Research Methodology

              Technavio presents a detailed picture of the market by way of study, synthesis, and summation of data from multiple sources. The analysts have presented the various facets of the market with a particular focus on identifying the key industry influencers. The data thus presented is comprehensive, reliable, and the result of extensive research, both primary and secondary.

              INFORMATION SOURCES

              Primary sources

              • Manufacturers and suppliers
              • Channel partners
              • Industry experts
              • Strategic decision makers

              Secondary sources

              • Industry journals and periodicals
              • Government data
              • Financial reports of key industry players
              • Historical data
              • Press releases

              DATA ANALYSIS

              Data Synthesis

              • Collation of data
              • Estimation of key figures
              • Analysis of derived insights

              Data Validation

              • Triangulation with data models
              • Reference against proprietary databases
              • Corroboration with industry experts

              REPORT WRITING

              Qualitative

              • Market drivers
              • Market challenges
              • Market trends
              • Five forces analysis

              Quantitative

              • Market size and forecast
              • Market segmentation
              • Geographical insights
              • Competitive landscape

              Interested in this report?

              Get your sample now to see our research methodology and insights!

              Download Now

              Frequently Asked Questions

              Power Metering market growth will increase by $ 9792.7 mn during 2024-2028.

              The Power Metering market is expected to grow at a CAGR of 8.51% during 2024-2028.

              Power Metering market is segmented by End-user( Residential, Commercial, Industrial)

              ABB Ltd., Aichi Tokei Denki Co. Ltd., ALLETE Inc, Eaton Corp. Plc, General Electric Co., Holley Technology Ltd., Honeywell International Inc., Hubbell Inc., Itron Inc., Jabil Inc., Kamstrup AS, Landis Gyr AG, Networked Energy Services, Ningbo Sanxing Medical and Electric Co. Ltd., Schneider Electric SE, Shenzhen Kaifa Technology Co. Ltd, Siemens AG, Suntront Tech Co. Ltd, Wasion Holdings Ltd., Xylem Inc. are a few of the key vendors in the Power Metering market.

              APAC will register the highest growth rate of 52% among the other regions. Therefore, the Power Metering market in APAC is expected to garner significant business opportunities for the vendors during the forecast period.

              China, US, Japan, Germany, UK

              • Growing investment in smart grid projectsGlobally is the driving factor this market.
              • huge investments have been made in smart grid projects in countries such as China is the driving factor this market.
              • the US is the driving factor this market.
              • India is the driving factor this market.
              • and other European countries such as Spain is the driving factor this market.
              • Germany is the driving factor this market.
              • and France is the driving factor this market.
              • enforcing ambitious smart grid plans. Smart grids include grid applications such as smart electric meters is the driving factor this market.
              • supervisory control and data acquisition (SCADA) systems is the driving factor this market.
              • IT is the driving factor this market.
              • and other communication networks. These devices enable utilities to have complete control and manage the digital assets present in the field. Smart grid networking systems enable a utility to analyze and map the power consumption patterns of its customers is the driving factor this market.
              • thereby helping in load forecasting and peak demand management along with risk determination. These systems also enable the reduction of power outages by providing detailed information about the functioning status of the power system networks. With the rapid development of smart grids and smart grid-related equipment and solutions is the driving factor this market.
              • the management of huge data volumes has become a major concern among power utilities. Smart grid networking systems equip grids with huge data management capability. Over the years is the driving factor this market.
              • the investment in smart grids has increased worldwide. Companies are undertaking several large-scale projects. Smart grid networking technologies help integrate renewable power generation technologies with the grid. Smart grid networking includes generation is the driving factor this market.
              • transmission is the driving factor this market.
              • distribution is the driving factor this market.
              • and end usage of electricity. Increased endeavors from several countries to achieve better energy management and improve energy efficiency across their power sector have led to an increase in the implementation of smart grid networking technologies. The gradual shift from conventional energy generation sources to renewable sources has also fueled the development of smart grid technologies. There have been huge developments in the smart grid sector across countries is the driving factor this market.
              • such as China is the driving factor this market.
              • India is the driving factor this market.
              • and Japan. The shift toward smart grids results in utilities managing complex smart devices is the driving factor this market.
              • thus reducing the risk of grid failures and outages. Hence is the driving factor this market.
              • the growing investment in smart grid projects can become a major driver for the growth of the global power metering market during the forecast period. is the driving factor this market.

              The Power Metering market vendors should focus on grabbing business opportunities from the Residential segment as it accounted for the largest market share in the base year.
              RIA - Research AI Assistant
              Ask RIA