Power Transmission Lines and Towers Market Size 2023-2027
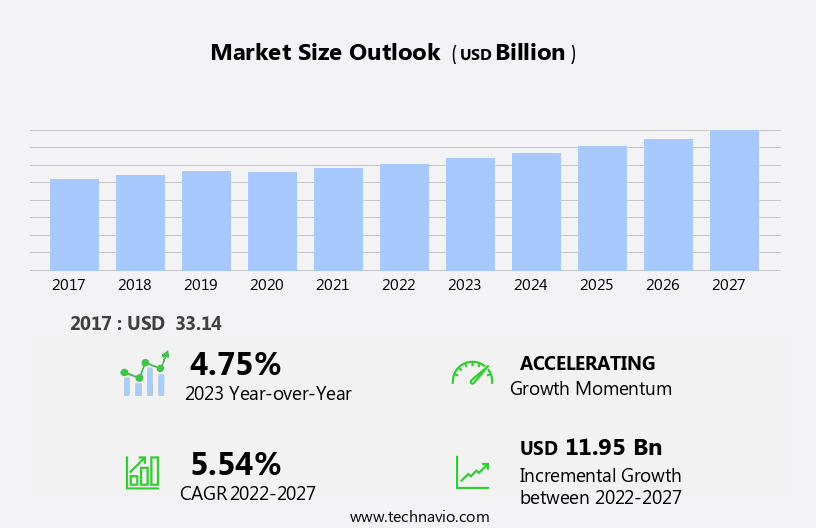
The power transmission lines and towers market size is forecast to increase by USD 11.95 billion, at a CAGR of 5.54% between 2022 and 2027.
- The market is experiencing robust growth, driven primarily by the escalating demand for high-voltage transmission lines in the utility sector. This trend is fueled by the increasing adoption of renewable energy sources and the need for efficient power transmission to support the expanding energy infrastructure. Another significant factor shaping the market is the evolution of smart grids, which necessitates the installation of advanced transmission lines and towers to ensure seamless power distribution and improved grid reliability. However, the market faces several challenges that necessitate strategic planning and innovative solutions. One of the most pressing challenges is the need to meet stringent government regulations and industry standards, which require the use of high-quality materials and adherence to safety protocols.
- Additionally, the complex and intricate nature of power transmission projects, coupled with the geographical challenges posed by diverse terrains and weather conditions, can significantly impact project execution and profitability. Companies operating in the market must address these challenges effectively to capitalize on the growth opportunities and maintain a competitive edge.
What will be the Size of the Power Transmission Lines and Towers Market during the forecast period?
Explore in-depth regional segment analysis with market size data - historical 2017-2021 and forecasts 2023-2027 - in the full report.
Request Free Sample
The market continues to evolve, driven by the ever-increasing demand for reliable and efficient electricity transmission. Lattice towers, a common type of transmission tower, are utilized to support high-voltage transmission lines, ensuring grid stability and minimizing power losses. HVAC transmission systems integrate energy efficiency into power transmission, reducing environmental impact and enhancing overall system performance. Aluminum conductors, with their lightweight and high-conductivity properties, are increasingly adopted for transmission lines, leading to improved power capacity and reduced construction costs. Project planning plays a crucial role in the market, with the implementation of advanced techniques and technologies to optimize project execution and minimize risks.
Steel-reinforced aluminum conductors offer enhanced durability and corrosion protection, extending the lifespan of transmission lines. Optical ground wires and strain insulators are essential components of modern transmission systems, providing reliable communication and ensuring the safe operation of power lines. Guyed towers and monopole towers, each with their unique advantages, are used to support transmission lines, adapting to various terrain and environmental conditions. Power transformers, a vital component of the power transmission network, undergo continuous advancements to improve efficiency and reduce losses. Quality control measures, including hot-dip galvanizing and powder coating, are employed to ensure the longevity and reliability of transmission towers and components.
The market further embraces digital substations, SCADA systems, and smart grid technologies to enhance grid stability and improve operational efficiency. The ongoing evolution of the market encompasses a multitude of components and applications, from transmission lines and towers to HVAC transmission, energy efficiency, and advanced technologies. This dynamic landscape continues to unfold, driven by the ever-changing needs of the electricity sector and the pursuit of innovation and sustainability.
How is this Power Transmission Lines and Towers Industry segmented?
The power transmission lines and towers industry research report provides comprehensive data (region-wise segment analysis), with forecasts and estimates in "USD billion" for the period 2023-2027, as well as historical data from 2017-2021 for the following segments.
- Product
- Transmission lines
- Transmission towers
- Type
- HVAC
- HVDC
- Voltage Level
- High Voltage (HV - 132 kV to 220 kV)
- Extra High Voltage (EHV - 221 kV to 660 kV)
- Ultra High Voltage (UHV - > 660 kV)
- Application
- High Tension Transmission
- Extra High Tension Transmission
- Ultra High Tension Transmission
- End-User
- Utilities & Power Grids
- Industrial
- Renewable Energy Projects (Wind Farms, Solar Farms)
- Geography
- North America
- US
- Canada
- Europe
- France
- Germany
- Italy
- UK
- Middle East and Africa
- Egypt
- KSA
- Oman
- UAE
- APAC
- China
- India
- Japan
- South America
- Argentina
- Brazil
- Rest of World (ROW)
- North America
By Product Insights
The transmission lines segment is estimated to witness significant growth during the forecast period.
The market is witnessing significant growth, driven by the increasing demand for electricity and the expansion of renewable energy sources. Transmission lines, which accounted for the largest market share in 2022, are experiencing a surge in demand due to numerous grid expansion and interconnection projects worldwide. Renewable energy sector's growth is a major catalyst, with countries transitioning to cleaner energy sources like wind and solar to reduce carbon emissions and lessen dependence on fossil fuels. Construction management plays a crucial role in the market, ensuring efficient project planning and execution. Self-supporting towers and lattice towers are commonly used, with corrosion protection a significant consideration for their longevity.
High-voltage transmission lines, including those using aluminum conductors and steel-reinforced aluminum conductors, are increasingly adopted for their energy efficiency and power capacity. Grid stability is ensured through the use of circuit breakers, disconnecting switches, and protective relays. Condition monitoring systems, digital substations, and SCADA systems help maintain optimal performance. HVDC transmission and monopole towers are gaining popularity due to their advantages in energy transfer and reduced environmental impact. Underground transmission lines are another trend, with right-of-way acquisition and environmental impact assessments crucial for their implementation. Surge arresters, suspension insulators, strain insulators, and optical ground wires are essential components in ensuring the reliable transmission of electricity.
HVAC transmission, energy efficiency, and smart grid technologies are also shaping the market's future. Risk assessment is vital in the market, with safety and quality control paramount. The market is continually evolving, with new technologies like powder coating, guyed towers, and post insulators contributing to its growth. The integration of advanced technologies like HVAC transmission, digital substations, and SCADA systems is transforming the power transmission landscape.
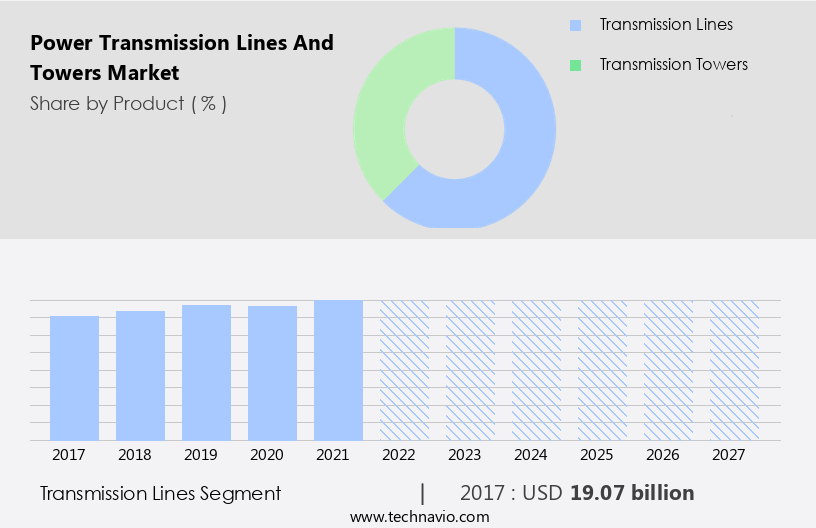
The Transmission lines segment was valued at USD 19.07 billion in 2017 and showed a gradual increase during the forecast period.
Regional Analysis
APAC is estimated to contribute 49% to the growth of the global market during the forecast period.Technavio's analysts have elaborately explained the regional trends and drivers that shape the market during the forecast period.

In the market, China and Japan emerge as the largest consumers of electricity in the region. The increasing investment in the tertiary sector, particularly in software companies, IT infrastructure, telecommunication, and broadband Internet, is driving the demand for transmission lines and towers in emerging South Asian countries like India and China. Over the last decade, the rapid expansion of Chinese Internet companies, such as Alibaba, Tencent, and Baidu, has been fueled by increased Internet penetration and online trade and retail. This growth has accelerated the development of domestic IT and server infrastructure, necessitating the construction of extensive transmission networks.
High-voltage transmission lines, self-supporting towers, and lattice towers are commonly used for these projects. Corrosion protection through hot-dip galvanizing and powder coating ensures durability, while construction management, project planning, and quality control ensure efficient execution. Transmission losses are minimized through the use of high-voltage conductors, steel-reinforced aluminum conductors, and optical ground wires. Grid stability is maintained through circuit breakers, disconnecting switches, and protective relays. HVDC transmission and smart grid technologies are also gaining popularity for their energy efficiency and reduced transmission losses. The market is further characterized by the use of distribution transformers, condition monitoring systems, SCADA systems, surge arresters, and environmental impact assessments.
Transmission towers and substation equipment, including power transformers and digital substations, are essential components of the transmission network. Risk assessment and the integration of suspension insulators, guyed towers, and strain insulators are crucial for ensuring the safety and reliability of the transmission system.
Market Dynamics
The Global Power Transmission Lines and Towers Market is experiencing significant growth, driven by the increasing need for reliable power transmission lines and robust transmission towers. Key drivers include the expansion of HVDC transmission for efficient long-distance power transmission and the crucial role of renewable energy integration in national grids. Both overhead transmission lines and underground transmission cables are seeing investment as part of ongoing grid modernization efforts and power grid expansion. Advanced power transmission conductors and durable transmission line insulators are vital components ensuring system integrity. The Asia Pacific power transmission market is a dominant force, leading in new power transmission infrastructure development. The market is also heavily influenced by smart grid technology and the adoption of UHV transmission, reflecting dynamic power transmission market trends and the importance of continuous transmission line maintenance.
Our researchers analyzed the data with 2022 as the base year, along with the key drivers, trends, and challenges. A holistic analysis of drivers will help companies refine their marketing strategies to gain a competitive advantage.
What are the key market drivers leading to the rise in the adoption of Power Transmission Lines and Towers Industry?
- The utility sector's expanding requirement for high-voltage transmission lines serves as the primary market driver, given the rapid demand growth in this area.
- The utility sector has witnessed a significant increase in the demand for high-voltage transmission lines due to the growing energy consumption, particularly in sectors like data centers and communication base stations. In 2021, the US consumed approximately 97 quadrillion Btu of primary energy. To meet the increasing power demands, utilities rely on high-voltage transmission lines for bulk electricity transmission over long distances. These lines are essential for grid stability, enabling the delivery of power efficiently and reducing transmission losses. Hot-dip galvanizing is a common method for corrosion protection of transmission towers and structures. Self-supporting towers are a popular choice due to their ability to support the weight of the power lines without the need for additional guy wires.
- The transmission line infrastructure includes various components such as distribution transformers, circuit breakers, disconnecting switches, and surge arrestors, which ensure the reliable and efficient transfer of power. Construction management plays a crucial role in the installation and maintenance of transmission lines. Proper planning, execution, and monitoring of the construction process are essential to minimize disruptions and ensure project completion within the stipulated timeframe. The use of advanced technologies like Building Information Modeling (BIM) and Geographic Information Systems (GIS) can streamline the construction process and improve overall project efficiency. In conclusion, the demand for high-voltage transmission lines continues to grow due to the increasing energy consumption and the need for reliable and efficient power transmission.
- Utilities invest in advanced technologies and construction management practices to ensure the timely completion of transmission line projects and maintain grid stability. Corrosion protection through hot-dip galvanizing and the use of self-supporting towers are essential for the longevity and reliability of the transmission infrastructure.
What are the market trends shaping the Power Transmission Lines and Towers Industry?
- Smart grids are currently undergoing significant evolution, representing an emerging market trend in the energy sector. This advancement is essential for enhancing the efficiency, reliability, and sustainability of power distribution systems.
- Transmission lines play a crucial role in the delivery of electricity in smart grids, which are becoming increasingly prevalent in the utility sector due to the need for reliable and uninterrupted power supply. In these advanced systems, transmission lines may be connected to wireless sensor networks, providing real-time price information to consumers for efficient energy management. Two common types of transmission lines are monopole towers supporting high-voltage AC lines and suspension insulators for HVDC (High Voltage Direct Current) transmission. Maintaining the optimal condition of these transmission lines is essential to ensure their longevity and efficiency.
- Condition monitoring systems, including SCADA (Supervisory Control and Data Acquisition) and surge arresters, help detect and address potential issues. Additionally, environmental impact assessments and right-of-way acquisition are critical considerations in the planning and implementation of new transmission lines. Underground transmission lines offer an alternative to traditional overhead lines, reducing the visual impact and potential environmental concerns. However, they require specialized installation techniques and increased costs. Powder coating is a common protective measure for transmission towers and lines, ensuring their durability and resistance to harsh weather conditions. In summary, the transmission lines sector is evolving with the adoption of smart grids and advanced technologies, enabling the delivery of sustainable, secure, and economical electricity supply.
- Condition monitoring, HVDC transmission, monopole towers, suspension insulators, right-of-way acquisition, underground transmission lines, surge arresters, environmental impact assessment, SCADA systems, and powder coating are key components in the development and maintenance of these essential infrastructure projects.
What challenges does the Power Transmission Lines and Towers Industry face during its growth?
- Complying with government regulations and adhering to industry standards is a significant challenge that mandatorily impacts the industry's growth trajectory. This requirement poses a substantial hurdle for businesses, as they must invest resources to ensure compliance while maintaining competitiveness within the market.
- The market is subject to various regulations and standards imposed by international organizations, influencing the generation and transmission of electricity. For instance, the Public Utilities Regulatory Policy Act of 1978 in the US has led to a decentralized electricity generation landscape, with industrial firms and non-utility generators (NUGs) preferring equipment for small electricity-generating units. In contrast, utilities opt for equipment for large electricity-generating units. These diverse requirements add complexity to the electricity generation process. Regarding tower structures, the American Society of Civil Engineers (ASCE) 10-97 standard sets stringent requirements for designing guyed and self-supporting lattice steel electrical transmission towers.
- The towers' materials, including lattice towers, hvac transmission lines, and steel-reinforced aluminum conductors, must meet specifications for optimal energy efficiency and durability. Moreover, the use of advanced technologies such as optical ground wires, strain insulators, and project planning software contributes to the market's growth. Quality control measures are essential to ensure the reliability and safety of power transmission lines and towers. Aluminum conductors, for instance, are often used due to their superior electrical conductivity and lower weight compared to copper conductors. In summary, the market is influenced by various factors, including government regulations, industry standards, and technological advancements, which impact the design, materials, and efficiency of the towers and transmission lines.
Exclusive Customer Landscape
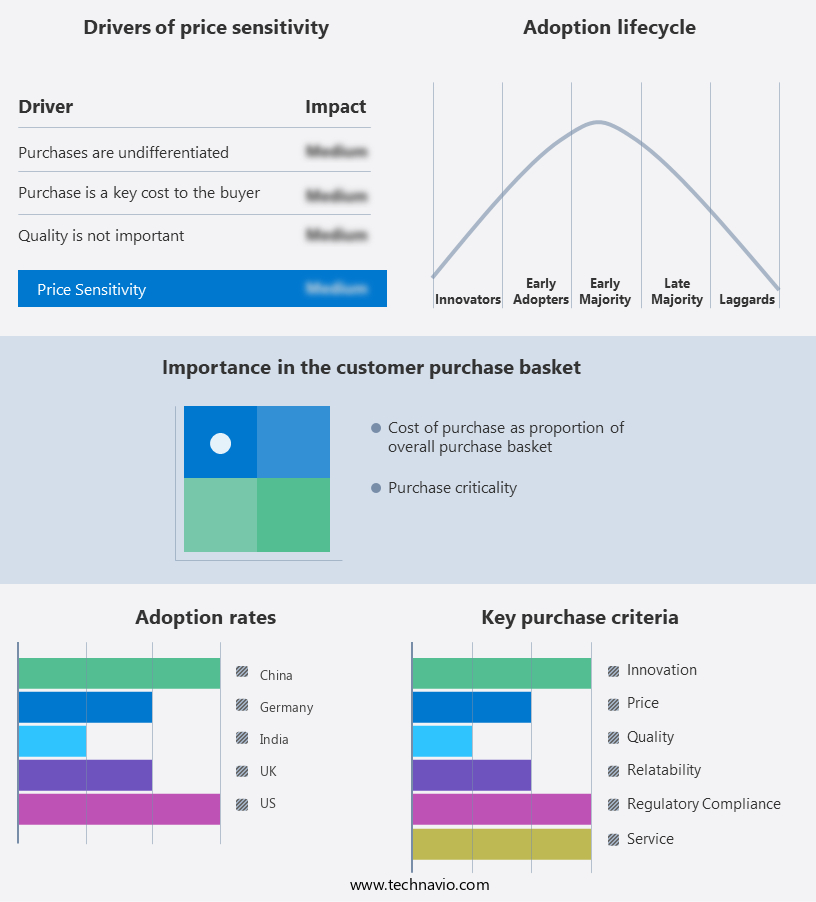
The power transmission lines and towers market forecasting report includes the adoption lifecycle of the market, covering from the innovator's stage to the laggard's stage. It focuses on adoption rates in different regions based on penetration. Furthermore, the power transmission lines and towers market report also includes key purchase criteria and drivers of price sensitivity to help companies evaluate and develop their market growth analysis strategies.
Customer Landscape
Key Companies & Market Insights
Companies are implementing various strategies, such as strategic alliances, power transmission lines and towers market forecast, partnerships, mergers and acquisitions, geographical expansion, and product/service launches, to enhance their presence in the industry.
3M Co. - The company specializes in power transmission solutions, including 3M's advanced Aluminum Conductor Composite Reinforced and Cold Shrink products. These offerings enhance electrical efficiency and reliability, contributing significantly to the power industry's infrastructure development.
The industry research and growth report includes detailed analyses of the competitive landscape of the market and information about key companies, including:
- 3M Co.
- Arrow Electronics Inc.
- Cabcon India Ltd.
- CG Power and Industrial Solutions Ltd.
- CTC Global Inc.
- Eland Cables Ltd.
- Gupta Power Infrastructure Ltd.
- Hindusthan Urban Infrastructure Ltd.
- Jiangsu Zhongtian Technology Co Ltd
- Jyoti Structures Ltd.
- KEC International Ltd.
- Lamifil NV
- MasTec Inc.
- Neccon Power and Infra Ltd.
- Nexans SA
- NV Bekaert SA
- Prysmian Spa
- Skipper Ltd.
- Sumitomo Electric Industries Ltd.
- Tratos Cavi S.p.A.
Qualitative and quantitative analysis of companies has been conducted to help clients understand the wider business environment as well as the strengths and weaknesses of key industry players. Data is qualitatively analyzed to categorize companies as pure play, category-focused, industry-focused, and diversified; it is quantitatively analyzed to categorize companies as dominant, leading, strong, tentative, and weak.
Recent Development and News in Power Transmission Lines And Towers Market
- In January 2024, Siemens Energy and Siemens Gamesa Renewable Energy announced a strategic collaboration to jointly develop and market turnkey grid solutions for renewable energy projects. This partnership aimed to integrate wind farms with power transmission lines and towers, addressing the challenges of integrating renewable energy into the power grid (Siemens Energy press release, 2024).
- In March 2024, Prysmian Group, a leading cable systems and solutions provider, secured a â¬350 million (USD395 million) contract from 50Hertz Transmission GmbH to supply and install high-voltage direct current (HVDC) cables and related accessories for the SuedLink 1 project in Germany. This project represents a significant expansion of the German HVDC grid (Prysmian Group press release, 2024).
- In April 2025, ABB and Hitachi Energy signed a memorandum of understanding to explore collaboration on the development and delivery of grid solutions, including power transmission lines and towers. The agreement aimed to combine ABB's digital solutions and Hitachi Energy's grid technologies to create more efficient and sustainable power transmission systems (ABB press release, 2025).
- In May 2025, the European Union approved the Trans-European Networks for Energy (TEN-E) regulation, which sets a binding target of deploying at least 15 new cross-border electricity interconnections by 2030. This initiative is expected to boost demand for power transmission lines and towers, as well as contribute to a more integrated and resilient European power grid (European Commission press release, 2025).
Research Analyst Overview
- The market is experiencing significant advancements driven by the integration of renewable energy sources and grid modernization. ICE loading and wind loading analysis are crucial for ensuring the structural integrity of transmission lines, particularly in extreme weather conditions. Remote control and wireless communication enable efficient tower inspections and maintenance. Vibration damping and fiber optic cables are essential for minimizing power losses and enhancing data analytics. Load flow studies and short circuit analysis are vital for maintaining grid stability, while compliance with safety regulations and environmental standards is a top priority. Machine learning and artificial intelligence are revolutionizing power system analysis, enabling predictive maintenance and fault detection.
- Energy storage and voltage regulation are key components of the transition towards a more sustainable and resilient power grid. Throughout the market, there is a growing emphasis on asset management, with life cycle costing and thermal rating playing significant roles in optimizing investments. Protective devices and earth grounding are essential for ensuring safety and reliability, while insulator testing and concrete foundations ensure structural durability. High-strength steel and IoT sensors contribute to the development of more efficient and cost-effective transmission infrastructure. In summary, the market is undergoing a transformation driven by the integration of renewable energy, grid modernization, and advanced technologies.
- ICE and wind loading analysis, remote control, vibration damping, load flow studies, IoT sensors, artificial intelligence, energy storage, voltage regulation, fiber optic cables, data analytics, transient stability, safety regulations, conductor sag, earth grounding, insulator testing, concrete foundations, high-strength steel, compliance standards, fault current, life cycle costing, protective devices, thermal rating, asset management, wireless communication, relay settings, and machine learning are all key components shaping the market's future.
Dive into Technavio's robust research methodology, blending expert interviews, extensive data synthesis, and validated models for unparalleled Power Transmission Lines and Towers Market insights. See full methodology.
|
Market Scope |
|
|
Report Coverage |
Details |
|
Page number |
165 |
|
Base year |
2022 |
|
Historic period |
2017-2021 |
|
Forecast period |
2023-2027 |
|
Growth momentum & CAGR |
Accelerate at a CAGR of 5.54% |
|
Market growth 2023-2027 |
USD 11.95 billion |
|
Market structure |
Fragmented |
|
YoY growth 2022-2023(%) |
4.75 |
|
Key countries |
US, China, India, Germany, and UK |
|
Competitive landscape |
Leading Companies, Market Positioning of Companies, Competitive Strategies, and Industry Risks |
What are the Key Data Covered in this Power Transmission Lines and Towers Market Research and Growth Report?
- CAGR of the Power Transmission Lines and Towers industry during the forecast period
- Detailed information on factors that will drive the growth and forecasting between 2023 and 2027
- Precise estimation of the size of the market and its contribution of the industry in focus to the parent market
- Accurate predictions about upcoming growth and trends and changes in consumer behaviour
- Growth of the market across APAC, Europe, North America, Middle East and Africa, and South America
- Thorough analysis of the market's competitive landscape and detailed information about companies
- Comprehensive analysis of factors that will challenge the power transmission lines and towers market growth of industry companies
We can help! Our analysts can customize this power transmission lines and towers market research report to meet your requirements.
 RIA -
RIA - 
